


ObjectivelyDrew
@objectivelydrew.bsky.social
Data over opinion (including mine)
College sports metrics
Design, UX, human/visual interaction
Father. Hot sauce chemist. Games of all kinds & their theory and design.
College sports metrics
Design, UX, human/visual interaction
Father. Hot sauce chemist. Games of all kinds & their theory and design.
Pinned
#promosky
I'm Drew, a designer in ad/marketing focused on the 👨🔬 behind human/visual interaction. More importantly...
I love data. Especially in sports. If you love that, please consider following here, and at
tinyurl.com/4weuh8rr
I also love:
🎮Video games
🎲 TTRPGs
🎨Creating
⁉️Game theory
Say hi!
I'm Drew, a designer in ad/marketing focused on the 👨🔬 behind human/visual interaction. More importantly...
I love data. Especially in sports. If you love that, please consider following here, and at
tinyurl.com/4weuh8rr
I also love:
🎮Video games
🎲 TTRPGs
🎨Creating
⁉️Game theory
Say hi!
No one brave enough to wade into the waters of objective statistical outcomes; all simply declare the final two teams to be the best two teams
Polling remains, as ever, an incredibly poor means to measure reality
Polling remains, as ever, an incredibly poor means to measure reality

January 20, 2026 at 8:25 PM
No one brave enough to wade into the waters of objective statistical outcomes; all simply declare the final two teams to be the best two teams
Polling remains, as ever, an incredibly poor means to measure reality
Polling remains, as ever, an incredibly poor means to measure reality
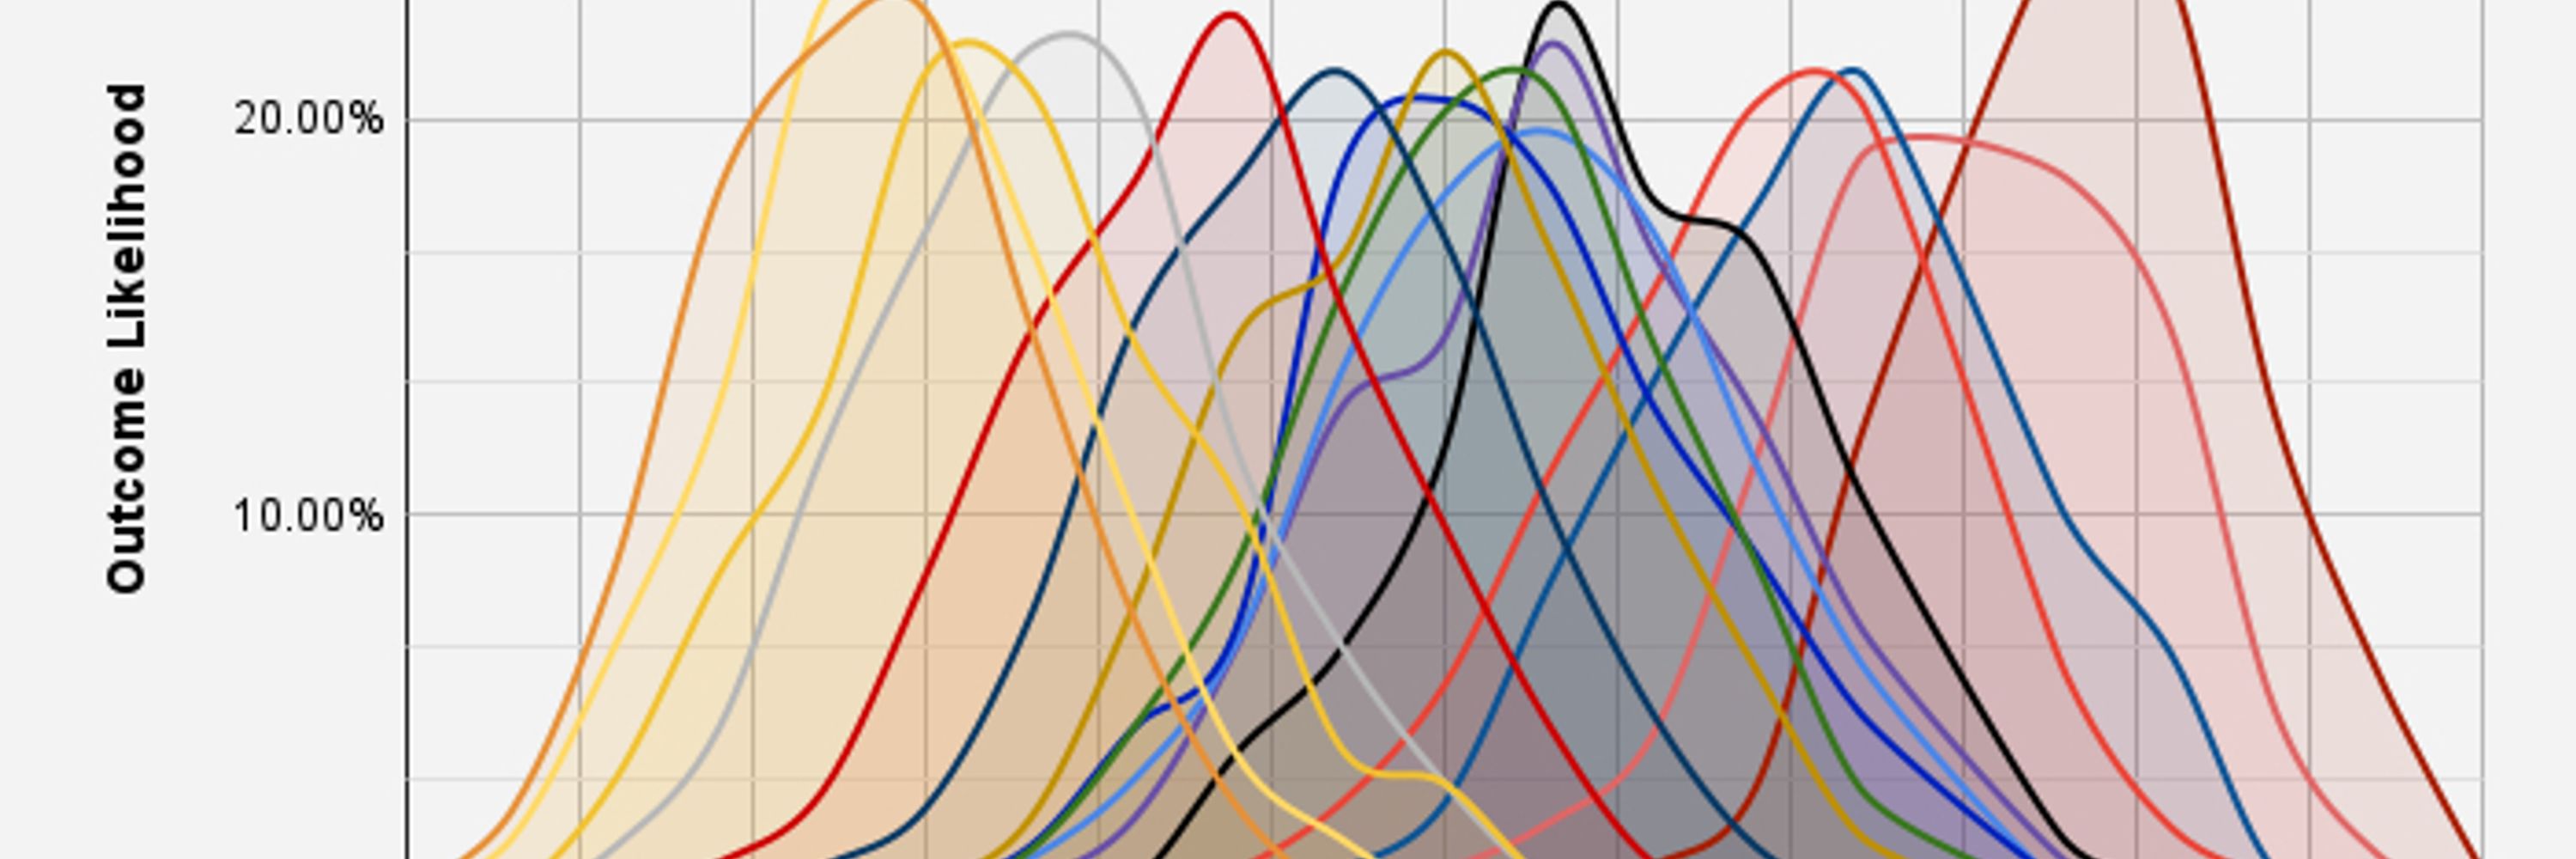
I'm really looking forward to charting where Indiana ranks compared to other champions in performance against strength of schedule.
Spoiler: it's ahead of 2019 LSU. By a lot.
Spoiler: it's ahead of 2019 LSU. By a lot.
January 20, 2026 at 4:59 AM
I'm really looking forward to charting where Indiana ranks compared to other champions in performance against strength of schedule.
Spoiler: it's ahead of 2019 LSU. By a lot.
Spoiler: it's ahead of 2019 LSU. By a lot.
Congrats Indiana!! The simulator's average projection of 29-19 was only off by two points for each team, nailing the combined score.
sTem (scoring tempo margin) projection was even closer at 28-21.
It's amazing what a full season of data can project/when it is that close.
#cfb #cfbsky
sTem (scoring tempo margin) projection was even closer at 28-21.
It's amazing what a full season of data can project/when it is that close.
#cfb #cfbsky
January 20, 2026 at 4:50 AM
May the world feel our whole year of Big XII pain: What it's like to not get obvious roughing the passer or PI flags, sometimes multiple times on the same drive

FYI:
The 2002 Fiesta Bowl between Miami-Ohio State also had Big 12 refs.
The 2002 Fiesta Bowl between Miami-Ohio State also had Big 12 refs.
January 20, 2026 at 3:35 AM
May the world feel our whole year of Big XII pain: What it's like to not get obvious roughing the passer or PI flags, sometimes multiple times on the same drive
Oregon was objectively a better team than Miami even without healthy RBs. Voting outcomes like these are why polling can never be considered valid or reflective of reality.


January 20, 2026 at 12:54 AM
Oregon was objectively a better team than Miami even without healthy RBs. Voting outcomes like these are why polling can never be considered valid or reflective of reality.
So does anyone believe Miami can win this game? Or is it just a question of how many points Indiana can run up?
#cfb #cfbsky
#cfb #cfbsky
Bad news for Miami fans ...if you don't hold Indiana below 34 points, that's likely to be the point it's all over.
Indiana averages 42.6 points a game and wins 78.6% of simulations. The spread is an average of 14 points.
#cfb #cfbsky #cfbplayoff
Indiana averages 42.6 points a game and wins 78.6% of simulations. The spread is an average of 14 points.
#cfb #cfbsky #cfbplayoff


January 19, 2026 at 6:35 PM
It's been Caleb's signature move since college, it just didn't work out very often at USC. Growth??

I also remember how Tecmo Super Bowl didn’t care how far the QB had to throw so you could just run back and never get sacked
January 19, 2026 at 2:44 AM
It's been Caleb's signature move since college, it just didn't work out very often at USC. Growth??
Collingsworth talking about urgency like he hasn't seen the Bears play a first half all year

I appreciate that Caleb Williams gets the stinky throws out the way in the first 3 quarters
January 19, 2026 at 12:04 AM
Collingsworth talking about urgency like he hasn't seen the Bears play a first half all year
It was just 50° this past week, but the gods of true football heard the call and we have a kickoff temp of -2°.
I love this for the away fans who don't get to experience seasons.
I love this for the away fans who don't get to experience seasons.

January 18, 2026 at 9:48 PM
It was just 50° this past week, but the gods of true football heard the call and we have a kickoff temp of -2°.
I love this for the away fans who don't get to experience seasons.
I love this for the away fans who don't get to experience seasons.
AI still hasn't gotten much better than a 1st/2nd grade reading level. Its output is much better than its ability to scan.
Writing on the internet is awful, either:
Everyone is using AI to populate their site
Scrapers are being used too often
Writing ability in adults is severely stunted
Or
Middle schoolers are possibly the authors/editors of over half the internet
Instead, subscribe to @channel6.bsky.social
Everyone is using AI to populate their site
Scrapers are being used too often
Writing ability in adults is severely stunted
Or
Middle schoolers are possibly the authors/editors of over half the internet
Instead, subscribe to @channel6.bsky.social
January 18, 2026 at 5:39 PM
AI still hasn't gotten much better than a 1st/2nd grade reading level. Its output is much better than its ability to scan.
Projected real feel of 2 degrees for kickoff, welcome LA fans
No offense to Chicago, but a Rams-Seahawks NFC Championship to complete the trilogy is what we need.
January 18, 2026 at 4:45 AM
Projected real feel of 2 degrees for kickoff, welcome LA fans
QB Bo Nix backwards is xiNo BBQ, so one could assume he was always ready to be cooked (Xino, Greek: citric acid. Likely delicious)
Stunner: Broncos coach Sean Payton just announced QB Bo Nix broke a bone in his ankle and is out for the season.
January 18, 2026 at 4:34 AM
QB Bo Nix backwards is xiNo BBQ, so one could assume he was always ready to be cooked (Xino, Greek: citric acid. Likely delicious)
I mean, this is the sole kind of good crazy from the past year

in the last 105 days, unranked Cincinnati teams have defeated #14 Iowa State in football (Oct. 4), #11 Iowa State in women's basketball (Jan. 7), and #2 Iowa State in men's basketball (today), all at home
January 17, 2026 at 10:44 PM
I mean, this is the sole kind of good crazy from the past year
Quite frankly ISU on the calendar is the only thing we have to look forward to these days

the Big 12's biggest rivals: Cincinnati and Iowa State
in the last 105 days, unranked Cincinnati teams have defeated #14 Iowa State in football (Oct. 4), #11 Iowa State in women's basketball (Jan. 7), and #2 Iowa State in men's basketball (today), all at home
January 17, 2026 at 10:43 PM
Quite frankly ISU on the calendar is the only thing we have to look forward to these days
Bad news for Miami fans ...if you don't hold Indiana below 34 points, that's likely to be the point it's all over.
Indiana averages 42.6 points a game and wins 78.6% of simulations. The spread is an average of 14 points.
#cfb #cfbsky #cfbplayoff
Indiana averages 42.6 points a game and wins 78.6% of simulations. The spread is an average of 14 points.
#cfb #cfbsky #cfbplayoff
January 16, 2026 at 6:44 PM
Bad news for Miami fans ...if you don't hold Indiana below 34 points, that's likely to be the point it's all over.
Indiana averages 42.6 points a game and wins 78.6% of simulations. The spread is an average of 14 points.
#cfb #cfbsky #cfbplayoff
Indiana averages 42.6 points a game and wins 78.6% of simulations. The spread is an average of 14 points.
#cfb #cfbsky #cfbplayoff
"with help" is so generous when it's more realistically "fully because of".


January 15, 2026 at 5:42 PM
"with help" is so generous when it's more realistically "fully because of".
*Rayland Givens intensifies*
January 14, 2026 at 2:54 AM
*Rayland Givens intensifies*
Just thinking back on what a special time Saturday late-night was

January 14, 2026 at 2:45 AM
Just thinking back on what a special time Saturday late-night was
A fringe theory that this team should in fact now be called the Santa Clara 49ers holds much more weight
my SFGATE colleague Anna Guth spoke with scientists about the dumbest fringe theory in sports www.sfgate.com/bayarea/arti...

A fringe theory about 49ers injuries has gone viral. Here's what scientists say.
The theory hunts for an explanation to all the injuries.
www.sfgate.com
January 13, 2026 at 9:08 PM
A fringe theory that this team should in fact now be called the Santa Clara 49ers holds much more weight
Not that I can be expected to take any poll related to college sports seriously, but I really do enjoy the analysis of @robertgriffiniii.bsky.social - it makes even a bad game from my school interesting

The best college football announce teams, based on more than 3,500 responses from Athletic readers.
More results: www.nytimes.com/athletic/694...
More results: www.nytimes.com/athletic/694...

January 12, 2026 at 5:07 PM
Not that I can be expected to take any poll related to college sports seriously, but I really do enjoy the analysis of @robertgriffiniii.bsky.social - it makes even a bad game from my school interesting
Reposted by ObjectivelyDrew


January 11, 2026 at 7:15 AM
Reposted by ObjectivelyDrew

in baseball, we call this a wheeeeeeeee!

January 11, 2026 at 4:39 AM
in baseball, we call this a wheeeeeeeee!
Boooo hissss (dad cheers)

If Caleb keeps coming back on the Packers like this they’ve gotta call him The Grate One
January 11, 2026 at 6:18 AM
Boooo hissss (dad cheers)
Indiana is in unheralded statistical territory. They're more than a full 20% more efficient in scoring per play, adjusted for schedule, than 2019 LSU.
January 10, 2026 at 4:17 AM
Indiana is in unheralded statistical territory. They're more than a full 20% more efficient in scoring per play, adjusted for schedule, than 2019 LSU.