


Leonard Tang
@leonardtang.bsky.social
Reposted by Leonard Tang

Unbelievable. This would be a terrible blow to American science, writ large. It would decimate not only climate research, but also the kind of weather, wildfire, and disaster research that has underpinned half a century of progress in prediction, early warning, and increased resilience.

Exclusive: The Trump administration is moving to dismantle the National Center for Atmospheric Research in Colorado, according to a senior White House official, taking aim at one of the world's leading climate research labs.

Trump moves to dismantle major US climate research center in Colorado
The Trump administration is breaking up the National Center for Atmospheric Research, taking aim at one of the world's leading climate research labs.
bit.ly
December 17, 2025 at 2:49 AM
Unbelievable. This would be a terrible blow to American science, writ large. It would decimate not only climate research, but also the kind of weather, wildfire, and disaster research that has underpinned half a century of progress in prediction, early warning, and increased resilience.
Reposted by Leonard Tang
It appears that the U.S. Environmental Protection Agency (EPA) has, within the past week, scrubbed a large amount of climate change content from its official website, as well as *removed human-caused warming* from the discussion on its "causes of climate change" page.

December 8, 2025 at 5:50 PM
It appears that the U.S. Environmental Protection Agency (EPA) has, within the past week, scrubbed a large amount of climate change content from its official website, as well as *removed human-caused warming* from the discussion on its "causes of climate change" page.
Reposted by Leonard Tang

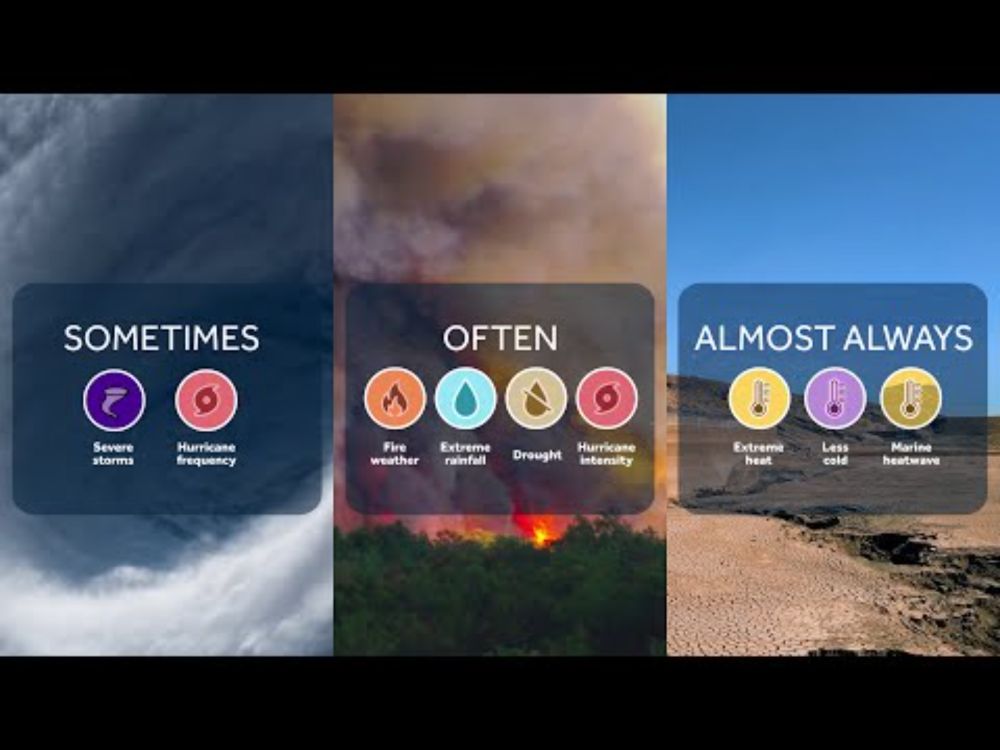
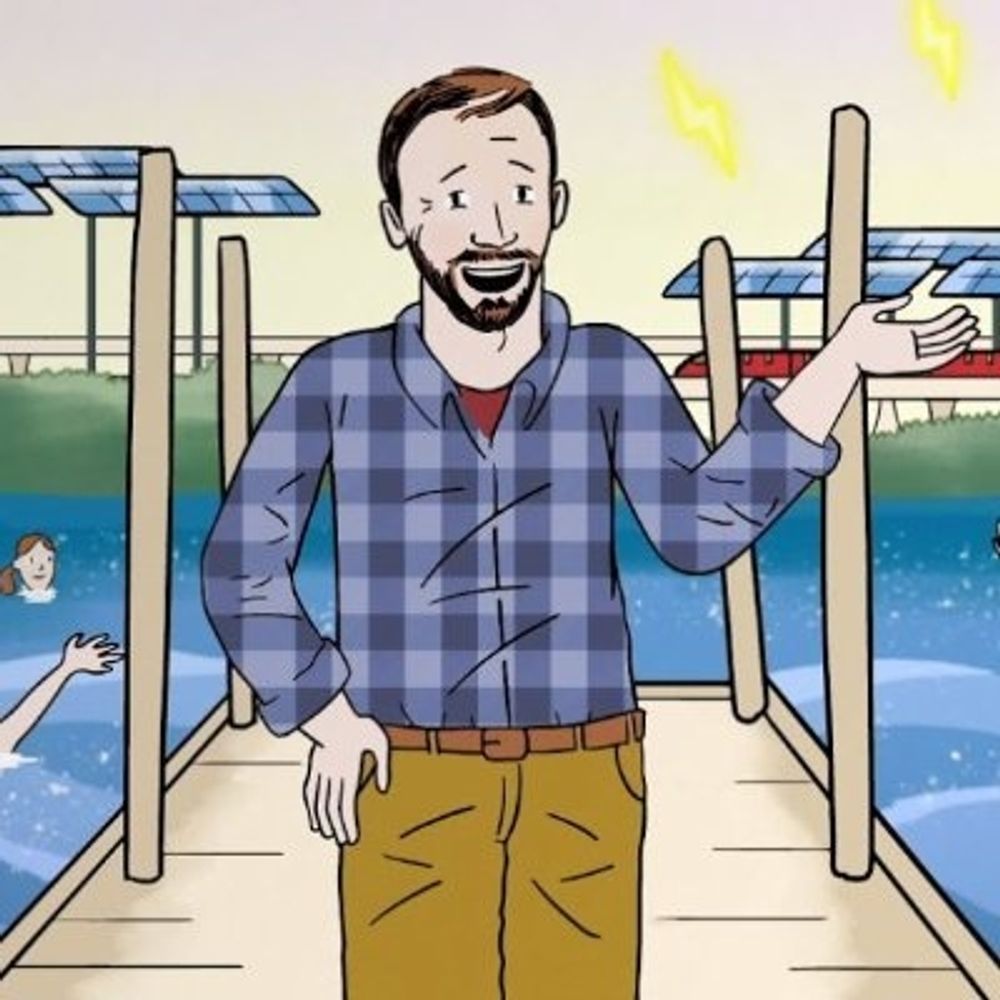
Ever wonder how scientists can say climate change made an extreme weather event more likely or more intense?
That’s attribution science at work.
It compares today’s world to one without the extra heat we’ve added through heat-trapping carbon pollution.
📺Learn more⤵️
youtu.be/A2vUBBkEOjA
That’s attribution science at work.
It compares today’s world to one without the extra heat we’ve added through heat-trapping carbon pollution.
📺Learn more⤵️
youtu.be/A2vUBBkEOjA
How Scientists Connect Climate Change to Extreme Weather
YouTube video by climatecentral
youtu.be
December 3, 2025 at 8:35 PM
Ever wonder how scientists can say climate change made an extreme weather event more likely or more intense?
That’s attribution science at work.
It compares today’s world to one without the extra heat we’ve added through heat-trapping carbon pollution.
📺Learn more⤵️
youtu.be/A2vUBBkEOjA
That’s attribution science at work.
It compares today’s world to one without the extra heat we’ve added through heat-trapping carbon pollution.
📺Learn more⤵️
youtu.be/A2vUBBkEOjA
Reposted by Leonard Tang
We have reached the stage of atmospheric river where the skylight in my office leaks a slow, cold drip directly on my head.
December 9, 2025 at 4:29 AM
We have reached the stage of atmospheric river where the skylight in my office leaks a slow, cold drip directly on my head.
Reposted by Leonard Tang

A timeline of Earth’s average temperature since the last ice age. Spoiler alert: It’s definitely getting warmer. And it’s happening increasingly, scarily fast. xkcd.com/1732/

Earth Temperature Timeline
xkcd.com
December 5, 2025 at 3:58 PM
A timeline of Earth’s average temperature since the last ice age. Spoiler alert: It’s definitely getting warmer. And it’s happening increasingly, scarily fast. xkcd.com/1732/
Reposted by Leonard Tang

All aboard!
Would you hop on this @cpkcrail holiday train?
🎥 This special holiday edition of #ScenicSaturday was captured the famous Morant’s Curve on December 16th 2024, by Will Lambert
Would you hop on this @cpkcrail holiday train?
🎥 This special holiday edition of #ScenicSaturday was captured the famous Morant’s Curve on December 16th 2024, by Will Lambert
December 6, 2025 at 9:14 PM
All aboard!
Would you hop on this @cpkcrail holiday train?
🎥 This special holiday edition of #ScenicSaturday was captured the famous Morant’s Curve on December 16th 2024, by Will Lambert
Would you hop on this @cpkcrail holiday train?
🎥 This special holiday edition of #ScenicSaturday was captured the famous Morant’s Curve on December 16th 2024, by Will Lambert
Reposted by Leonard Tang

An atmospheric river pounds the West Coast with a fire hose of moisture, delivering a good soaking of rainfall and mountain snow for the region.
October 24, 2025 at 5:32 PM
An atmospheric river pounds the West Coast with a fire hose of moisture, delivering a good soaking of rainfall and mountain snow for the region.
Reposted by Leonard Tang
Polar-orbiting satellites witnessed a classic comma-shaped mid-latitude cyclone hanging over the United States and Canada yesterday.
The central low of the system spins over the Great Lakes region, while storms pop up along the tail end of the cold front over the Deep South.
The central low of the system spins over the Great Lakes region, while storms pop up along the tail end of the cold front over the Deep South.

October 22, 2025 at 7:26 PM
Polar-orbiting satellites witnessed a classic comma-shaped mid-latitude cyclone hanging over the United States and Canada yesterday.
The central low of the system spins over the Great Lakes region, while storms pop up along the tail end of the cold front over the Deep South.
The central low of the system spins over the Great Lakes region, while storms pop up along the tail end of the cold front over the Deep South.
Reposted by Leonard Tang

Admittedly a bit slow on the uptake, but i am enjoying diving into HCLIM: nature.com/articles/s41...
A dataset of weather stations with pre-1890 data.
This includes ~450 temperature stations whose data was not previously available in the normal digital archives.
h/t @labradorice.bsky.social
A dataset of weather stations with pre-1890 data.
This includes ~450 temperature stations whose data was not previously available in the normal digital archives.
h/t @labradorice.bsky.social

The global historical climate database HCLIM - Scientific Data
Measurement(s) temperature of air Technology Type(s) weather stations Sample Characteristic - Environment Air - temperature, precipitation and pressre Sample Characteristic - Location ...
nature.com
October 22, 2025 at 10:43 AM
Admittedly a bit slow on the uptake, but i am enjoying diving into HCLIM: nature.com/articles/s41...
A dataset of weather stations with pre-1890 data.
This includes ~450 temperature stations whose data was not previously available in the normal digital archives.
h/t @labradorice.bsky.social
A dataset of weather stations with pre-1890 data.
This includes ~450 temperature stations whose data was not previously available in the normal digital archives.
h/t @labradorice.bsky.social
Reposted by Leonard Tang

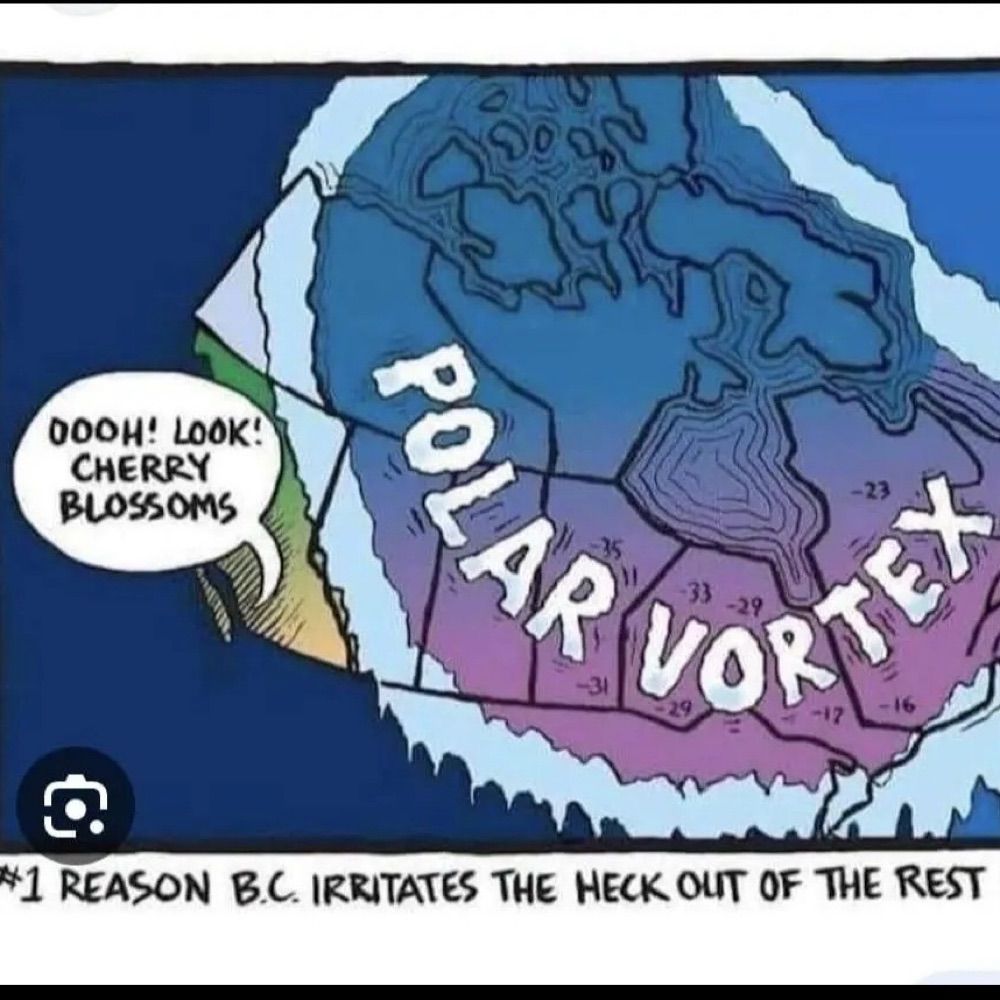
Fuelled by the remnants of a typhoon, a frontal system will impact the B.C. coast this weekend with soaking rains, heavy alpine snow and blustery winds. #BCstorm #BCwx
https://ow.ly/NaQU50Xetru
https://ow.ly/NaQU50Xetru

Remains of typhoon to boost fall storm's impact on the B.C. coast - The Weather Network
Fuelled by the remnants of a typhoon, a frontal system will impact the B.C. coast this weekend with soaking rains, heavy alpine snow and blustery winds
ow.ly
October 18, 2025 at 12:44 PM
Fuelled by the remnants of a typhoon, a frontal system will impact the B.C. coast this weekend with soaking rains, heavy alpine snow and blustery winds. #BCstorm #BCwx
https://ow.ly/NaQU50Xetru
https://ow.ly/NaQU50Xetru
Reposted by Leonard Tang
Following their dance together near the United States' East Coast, the last few days saw Hurricane Imelda absorb the remnants of Hurricane Humberto after its dissipation.
October 2, 2025 at 5:40 PM
Following their dance together near the United States' East Coast, the last few days saw Hurricane Imelda absorb the remnants of Hurricane Humberto after its dissipation.
Reposted by Leonard Tang
Remarkable amount of fire on the ground in Pacific NW and British Columbia right now (black dots/splotches on map)--especially for Sep, which is pretty late in season here. Not coincidentally, today was the hottest September day on record for most of B.C. and interior WA/ID.

September 4, 2025 at 2:23 AM
Remarkable amount of fire on the ground in Pacific NW and British Columbia right now (black dots/splotches on map)--especially for Sep, which is pretty late in season here. Not coincidentally, today was the hottest September day on record for most of B.C. and interior WA/ID.
Reposted by Leonard Tang


Reposted by Leonard Tang
I published a video focused on my perspective on the 1.5°C temperature target and what it will mean to exceed it. This monologue is an honest (and unvarnished) scientifically-informed personal reflection, so I hope you'll give it a listen. #ClimateChange www.youtube.com/watc...
Thoughts from a climate scientist on what it means to exceed the 1.5°C global warming target
In 2015, global nations pledged to take actions to limit global warming to 1.5°C (2.7°F) above the pre-industrial baseline temperature in what has come to be known as the "Paris Agreement." In 2023 and 2024, global temperatures approached or even exceeded that warming target on a temporary basis--an
www.youtube.com
August 11, 2025 at 7:47 PM
I published a video focused on my perspective on the 1.5°C temperature target and what it will mean to exceed it. This monologue is an honest (and unvarnished) scientifically-informed personal reflection, so I hope you'll give it a listen. #ClimateChange www.youtube.com/watc...
Reposted by Leonard Tang
The Klyuchevskoy Volcano on the Kamchatka Peninsula began erupting following yesterday's massive 8.8 magnitude earthquake just off the Russian east coast.
July 30, 2025 at 5:42 PM
The Klyuchevskoy Volcano on the Kamchatka Peninsula began erupting following yesterday's massive 8.8 magnitude earthquake just off the Russian east coast.
On the side of a U-Haul…

July 22, 2025 at 10:45 PM
On the side of a U-Haul…
Reposted by Leonard Tang
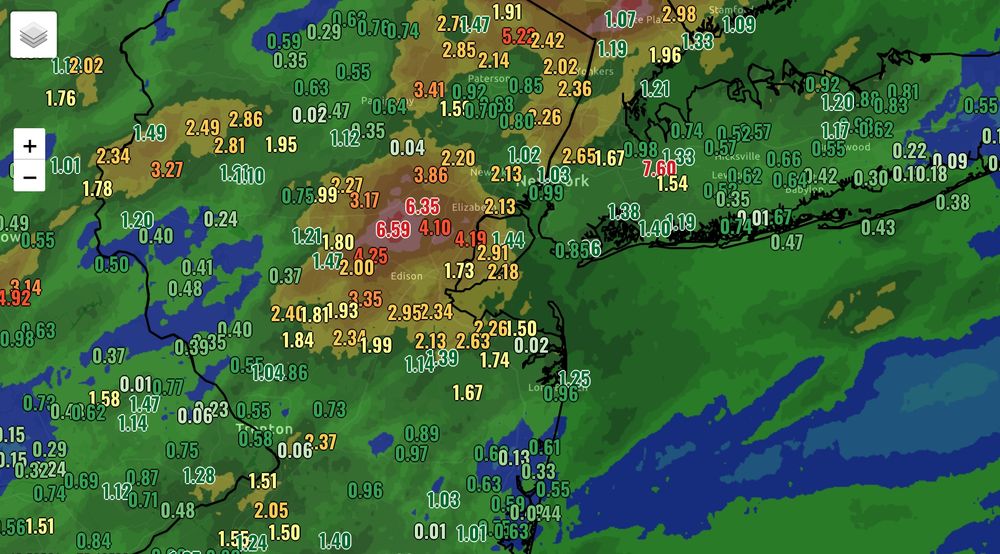
Another day. Another flash flood—this time across New York and New Jersey.
Record rainfall in a short span overwhelmed streets, subways, and neighborhoods.
• Here's what happened (via @nytimes.com): www.nytimes.com/live/2025/07...
• 🧵below is how climate change played a role ⤵️
Record rainfall in a short span overwhelmed streets, subways, and neighborhoods.
• Here's what happened (via @nytimes.com): www.nytimes.com/live/2025/07...
• 🧵below is how climate change played a role ⤵️
July 15, 2025 at 2:25 PM
Another day. Another flash flood—this time across New York and New Jersey.
Record rainfall in a short span overwhelmed streets, subways, and neighborhoods.
• Here's what happened (via @nytimes.com): www.nytimes.com/live/2025/07...
• 🧵below is how climate change played a role ⤵️
Record rainfall in a short span overwhelmed streets, subways, and neighborhoods.
• Here's what happened (via @nytimes.com): www.nytimes.com/live/2025/07...
• 🧵below is how climate change played a role ⤵️
Reposted by Leonard Tang
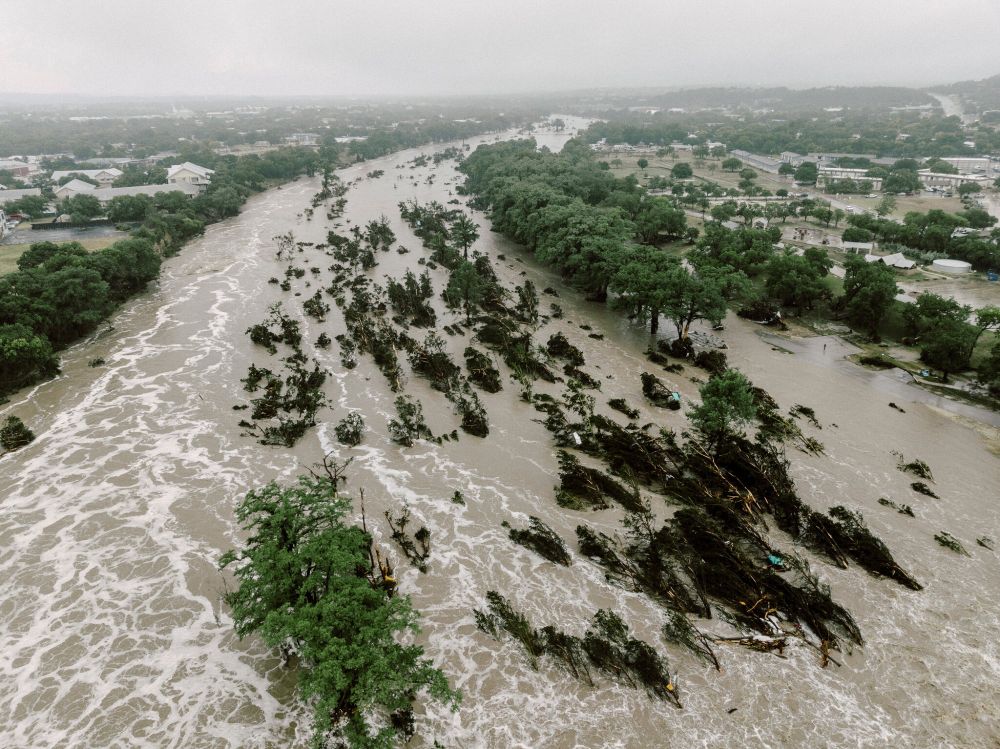
A quick🧵about the devastating Texas flooding -- and how it connects to climate change. ⬇️
(Photo cred: @nytimes.com)
(Photo cred: @nytimes.com)
July 5, 2025 at 5:28 PM
A quick🧵about the devastating Texas flooding -- and how it connects to climate change. ⬇️
(Photo cred: @nytimes.com)
(Photo cred: @nytimes.com)
Reposted by Leonard Tang

Our study from last week (as discussed here by @borenbears.bsky.social for the @apnews.com) provides some critical context for as "heat domes" bring record temperatures to Europe and North: apnews.com/article/extr...
June 20, 2025 at 2:27 PM
Our study from last week (as discussed here by @borenbears.bsky.social for the @apnews.com) provides some critical context for as "heat domes" bring record temperatures to Europe and North: apnews.com/article/extr...
Reposted by Leonard Tang

June 21 is Show Your Stripes Day—a time to spark conversation about how our world is warming.
This video shows how @noaa.gov temperature data for the U.S. is turned into the iconic stripes visualizations you may see shared today and tomorrow.
@edhawkins.org
This video shows how @noaa.gov temperature data for the U.S. is turned into the iconic stripes visualizations you may see shared today and tomorrow.
@edhawkins.org
June 20, 2025 at 2:59 PM
June 21 is Show Your Stripes Day—a time to spark conversation about how our world is warming.
This video shows how @noaa.gov temperature data for the U.S. is turned into the iconic stripes visualizations you may see shared today and tomorrow.
@edhawkins.org
This video shows how @noaa.gov temperature data for the U.S. is turned into the iconic stripes visualizations you may see shared today and tomorrow.
@edhawkins.org
Reposted by Leonard Tang
New work being done by NASA and the Smithsonian Institution builds upon the existing knowledge that changes in tree leaves can signify a volcanic eruption.

Trees may be able to help us predict volcanic eruptions - The Weather Network
“Tracking the effects of volcanic carbon dioxide on trees will not be a silver bullet. But it will be something that could change the game.”
www.theweathernetwork.com
June 4, 2025 at 9:06 PM
New work being done by NASA and the Smithsonian Institution builds upon the existing knowledge that changes in tree leaves can signify a volcanic eruption.
Reposted by Leonard Tang
2023 and 2024 were the worst two fire seasons in Canadian history, and so far 2025 is starting on a similar pace.
Get ready for more orange skies and dangerous smokey days this summer.
My analysis for @theguardian.com:
www.theguardian.com/us-news/2025...
Get ready for more orange skies and dangerous smokey days this summer.
My analysis for @theguardian.com:
www.theguardian.com/us-news/2025...

Recent Canadian wildfires are record-breaking – and will threaten US air quality for days
After historic seasons in last two years, blazes continue trend of warm, dry conditions intensified by climate crisis
www.theguardian.com
May 30, 2025 at 12:40 PM
2023 and 2024 were the worst two fire seasons in Canadian history, and so far 2025 is starting on a similar pace.
Get ready for more orange skies and dangerous smokey days this summer.
My analysis for @theguardian.com:
www.theguardian.com/us-news/2025...
Get ready for more orange skies and dangerous smokey days this summer.
My analysis for @theguardian.com:
www.theguardian.com/us-news/2025...
Reposted by Leonard Tang

NOAA's 2025 hurricane outlook predicts a busy season, with up to 19 named storms and 5 major hurricanes. Officials urged people to start preparing for the season now.

Busy Hurricane Season Expected in 2025 - Eos
A new NOAA report predicts an active Atlantic hurricane season, though global weather patterns could still shift predictions.
eos.org
May 25, 2025 at 6:45 PM
NOAA's 2025 hurricane outlook predicts a busy season, with up to 19 named storms and 5 major hurricanes. Officials urged people to start preparing for the season now.
Reposted by Leonard Tang

My latest Forbes dot com writing was inspired by a conversation with friends at a post graduation cookout. It synthesized a challenging "aha" moment for me as a meteorologist and public scholar. Hope you will give this a read and would love your thoughts too
www.forbes.com/sites/marsha...
www.forbes.com/sites/marsha...

4 Reasons Why Perfect Weather Forecasts Still Aren’t Enough
Even if meteorologists deliver a perfect forecast, there are barriers that prevent intended or appropriate responses.
www.forbes.com
May 24, 2025 at 1:10 PM
My latest Forbes dot com writing was inspired by a conversation with friends at a post graduation cookout. It synthesized a challenging "aha" moment for me as a meteorologist and public scholar. Hope you will give this a read and would love your thoughts too
www.forbes.com/sites/marsha...
www.forbes.com/sites/marsha...