


Lisa Charlotte Muth
@lisacmuth.bsky.social
Creating & writing about data vis for @datawrapper.de
Wow! It's a great honor to receive this Information is Beautiful Award.
Thanks to @datawrapper.de for letting me inspire people. And thanks to everyone else who's contributing to the lovely #dataviz community!
Find all #IIBAwards winners here: www.informationisbeautifulawards.com/news/680-ann...
Thanks to @datawrapper.de for letting me inspire people. And thanks to everyone else who's contributing to the lovely #dataviz community!
Find all #IIBAwards winners here: www.informationisbeautifulawards.com/news/680-ann...
June 18, 2025 at 1:08 PM
Wow! It's a great honor to receive this Information is Beautiful Award.
Thanks to @datawrapper.de for letting me inspire people. And thanks to everyone else who's contributing to the lovely #dataviz community!
Find all #IIBAwards winners here: www.informationisbeautifulawards.com/news/680-ann...
Thanks to @datawrapper.de for letting me inspire people. And thanks to everyone else who's contributing to the lovely #dataviz community!
Find all #IIBAwards winners here: www.informationisbeautifulawards.com/news/680-ann...
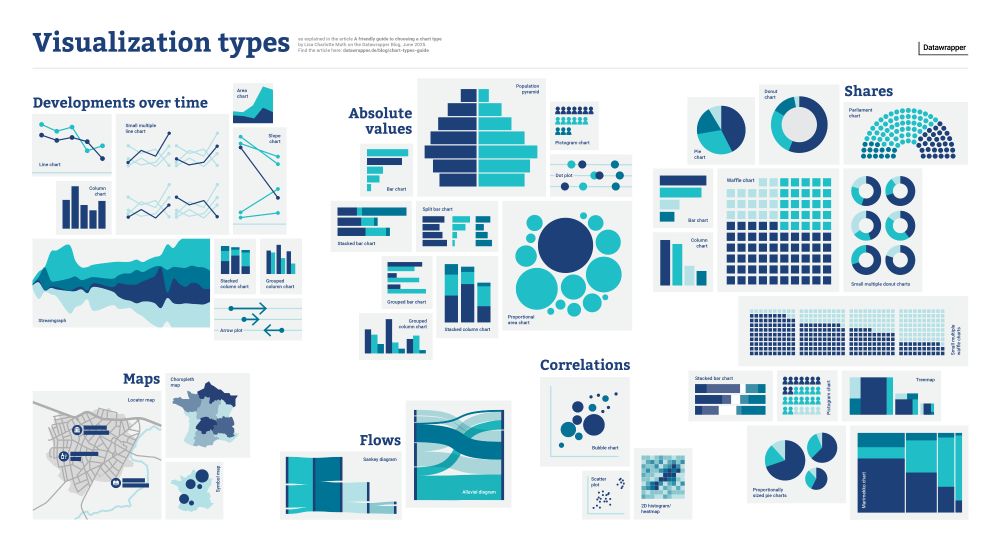
📊 There are *so* many chart types out there. Which one should you use for what kind of data and goal?
I tried to answer the question in a new blog post (and poster!): www.datawrapper.de/blog/chart-t...
I tried to answer the question in a new blog post (and poster!): www.datawrapper.de/blog/chart-t...
June 16, 2025 at 7:14 PM
📊 There are *so* many chart types out there. Which one should you use for what kind of data and goal?
I tried to answer the question in a new blog post (and poster!): www.datawrapper.de/blog/chart-t...
I tried to answer the question in a new blog post (and poster!): www.datawrapper.de/blog/chart-t...
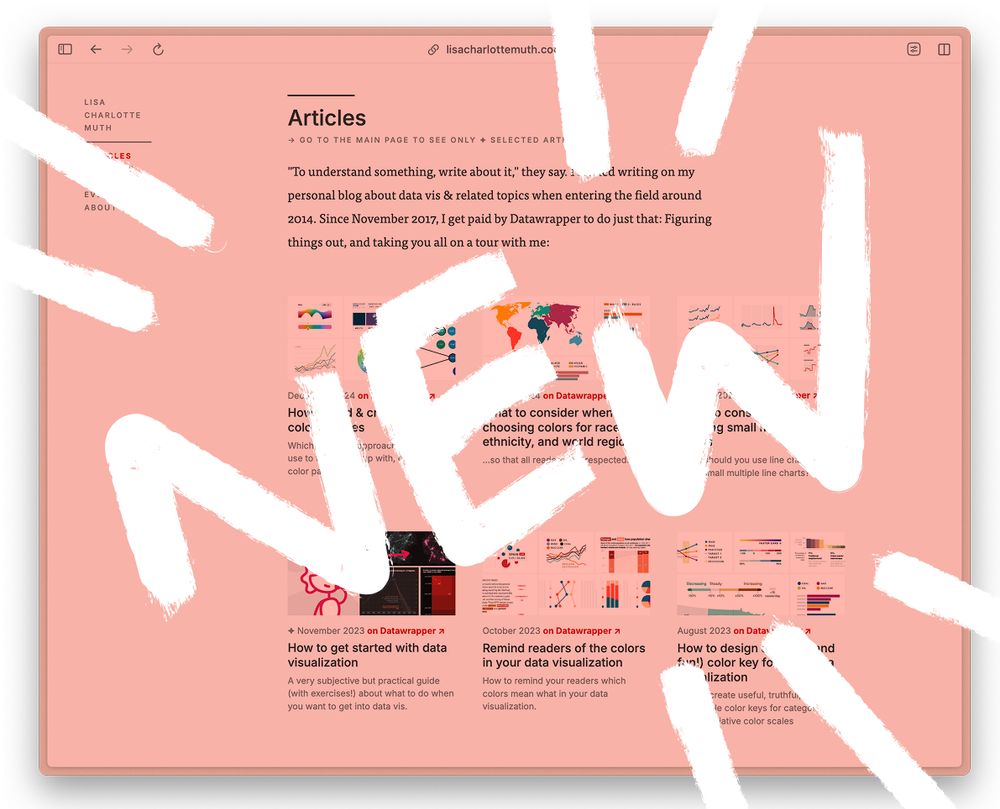
I just added lots of new content to my website! lisacharlottemuth.com
→ #dataviz projects & articles I've worked on at @datawrapper.de in the past years
→ a new "Events" page with information about the Data Vis Meetup, the Data Vis Book Club, and the Unwrapped conference
→ an updated About me page
→ #dataviz projects & articles I've worked on at @datawrapper.de in the past years
→ a new "Events" page with information about the Data Vis Meetup, the Data Vis Book Club, and the Unwrapped conference
→ an updated About me page
May 29, 2025 at 9:35 AM
I just added lots of new content to my website! lisacharlottemuth.com
→ #dataviz projects & articles I've worked on at @datawrapper.de in the past years
→ a new "Events" page with information about the Data Vis Meetup, the Data Vis Book Club, and the Unwrapped conference
→ an updated About me page
→ #dataviz projects & articles I've worked on at @datawrapper.de in the past years
→ a new "Events" page with information about the Data Vis Meetup, the Data Vis Book Club, and the Unwrapped conference
→ an updated About me page
🌈 Jan's tool looks amazing to find a #dataviz palette!
A similar tool is the Python Color Palette Finder by @yan-holtz.bsky.social: python-graph-gallery.com/color-palett...
What I like about Jan's tool is that I can browse palettes *by chart type* – so smart. (This, and the German name.)
A similar tool is the Python Color Palette Finder by @yan-holtz.bsky.social: python-graph-gallery.com/color-palett...
What I like about Jan's tool is that I can browse palettes *by chart type* – so smart. (This, and the German name.)

Looking for the right color palette for your next data visualization? Then check out this little helper app I built, where you can quickly browse through 2.4k different color palettes: simson.io/regenbogen/ 🌈
Source code at: github.com/jansim/regen...
Source code at: github.com/jansim/regen...

March 2, 2025 at 4:54 PM
🌈 Jan's tool looks amazing to find a #dataviz palette!
A similar tool is the Python Color Palette Finder by @yan-holtz.bsky.social: python-graph-gallery.com/color-palett...
What I like about Jan's tool is that I can browse palettes *by chart type* – so smart. (This, and the German name.)
A similar tool is the Python Color Palette Finder by @yan-holtz.bsky.social: python-graph-gallery.com/color-palett...
What I like about Jan's tool is that I can browse palettes *by chart type* – so smart. (This, and the German name.)
Yay, another small multiple chart type in Datawrapper! It's been lots of fun to play around with it so far:
🎉🎉 🎉 You can now create small multiple column charts in Datawrapper – for both time series and categorical data! Highlight individual columns, display values on all of them, add annotations, overlays, range highlights, and more: https://blog.datawrapper.de/small-multiple-column-charts/


February 18, 2025 at 2:47 PM
Yay, another small multiple chart type in Datawrapper! It's been lots of fun to play around with it so far:
Reposted by Lisa Charlotte Muth

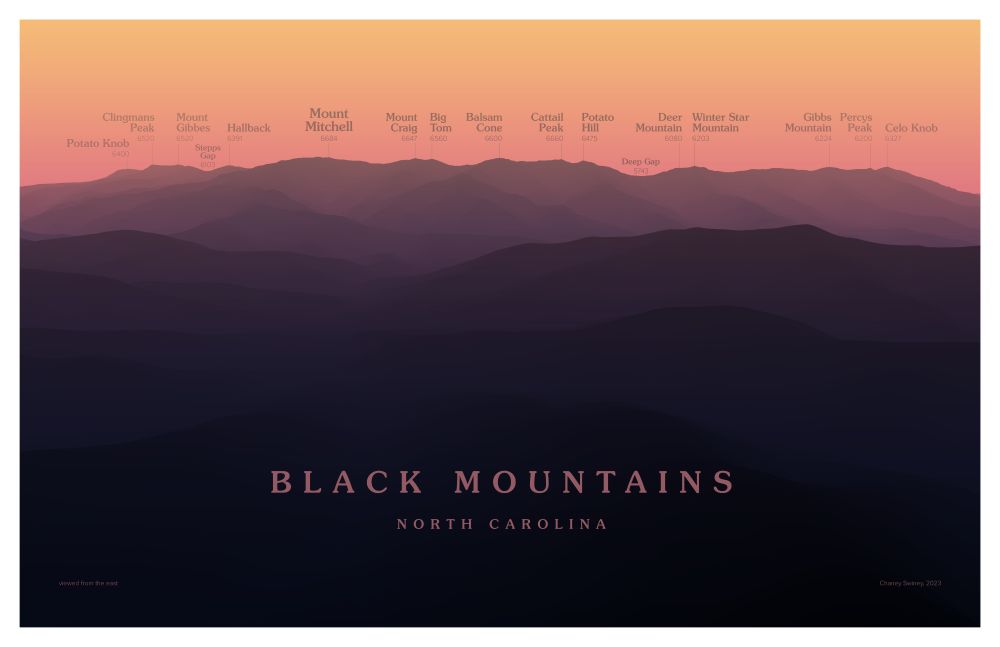
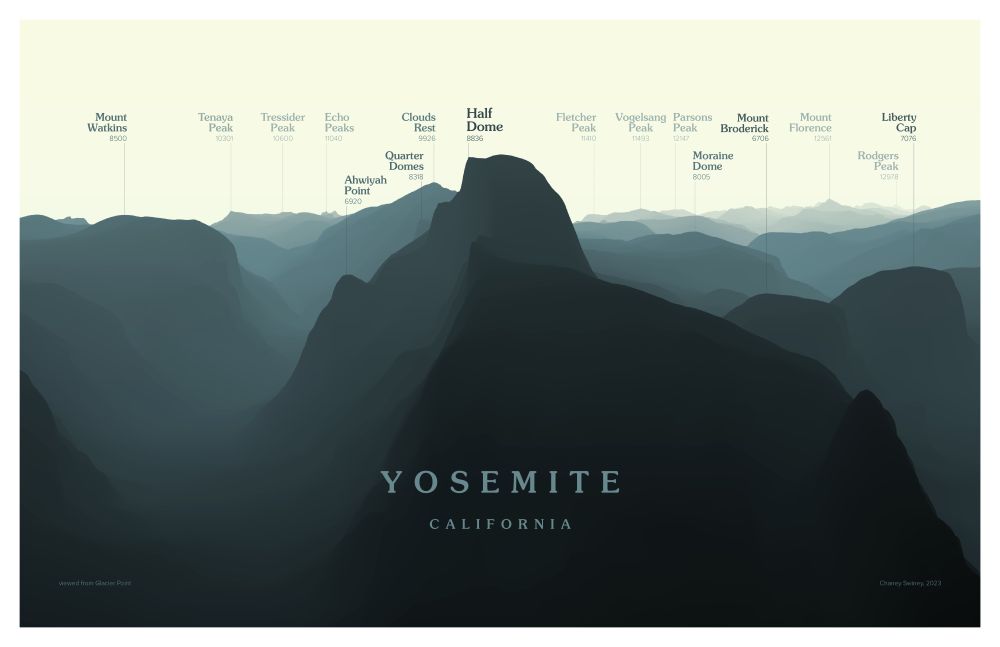
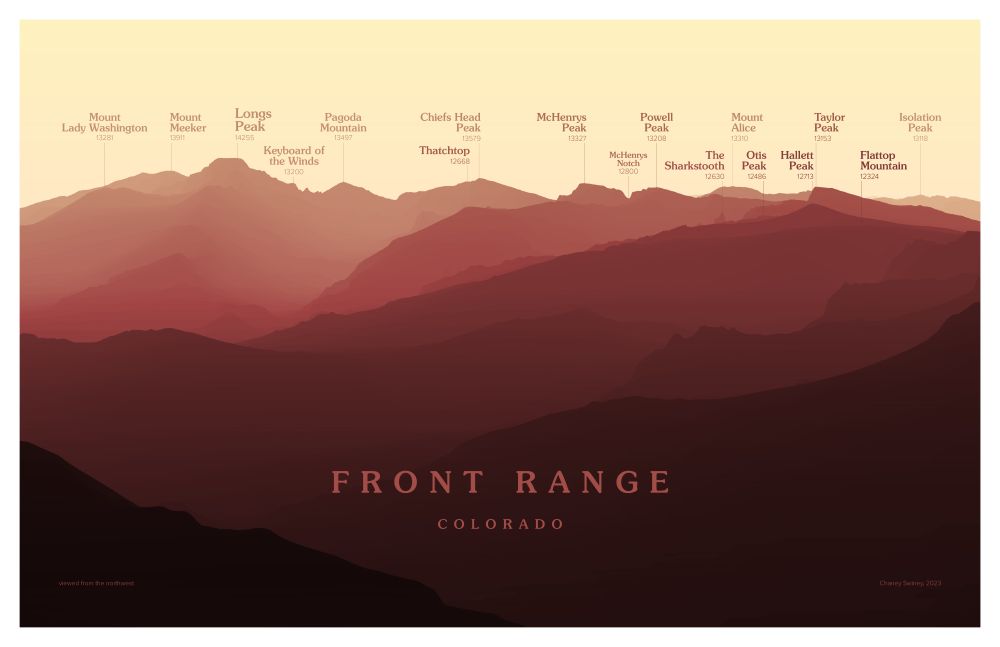
A favorite recent project: Peakscapes. I love the layered looks you get in the #mountains, and I always want to be able to name everything in view. These designs provide a cleaner, more idealized view of the landscape than a photo can.
Are they #maps? Or geographic art? I'm not sure.
Are they #maps? Or geographic art? I'm not sure.
December 5, 2024 at 3:48 PM
A favorite recent project: Peakscapes. I love the layered looks you get in the #mountains, and I always want to be able to name everything in view. These designs provide a cleaner, more idealized view of the landscape than a photo can.
Are they #maps? Or geographic art? I'm not sure.
Are they #maps? Or geographic art? I'm not sure.
It was fun putting this together! Have a look and let me know what you think:
Fargo, Severance, Black Mirror, Atlanta, Master of None, Euphoria – they all left their fans waiting for three years or more between seasons. In fact, we're waiting longer than ever for TV shows to return, as @lisacmuth.bsky.social shows in her Weekly Chart: blog.datawrapper.de/waittime-for...

November 28, 2024 at 3:00 PM
It was fun putting this together! Have a look and let me know what you think:
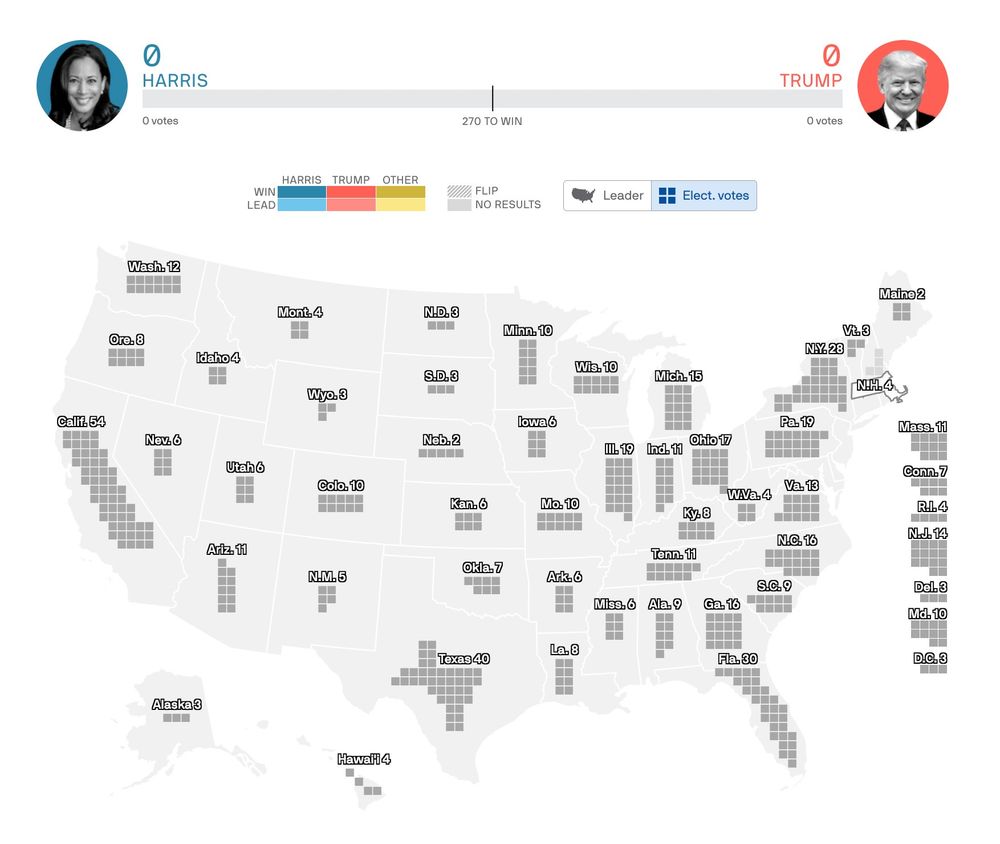
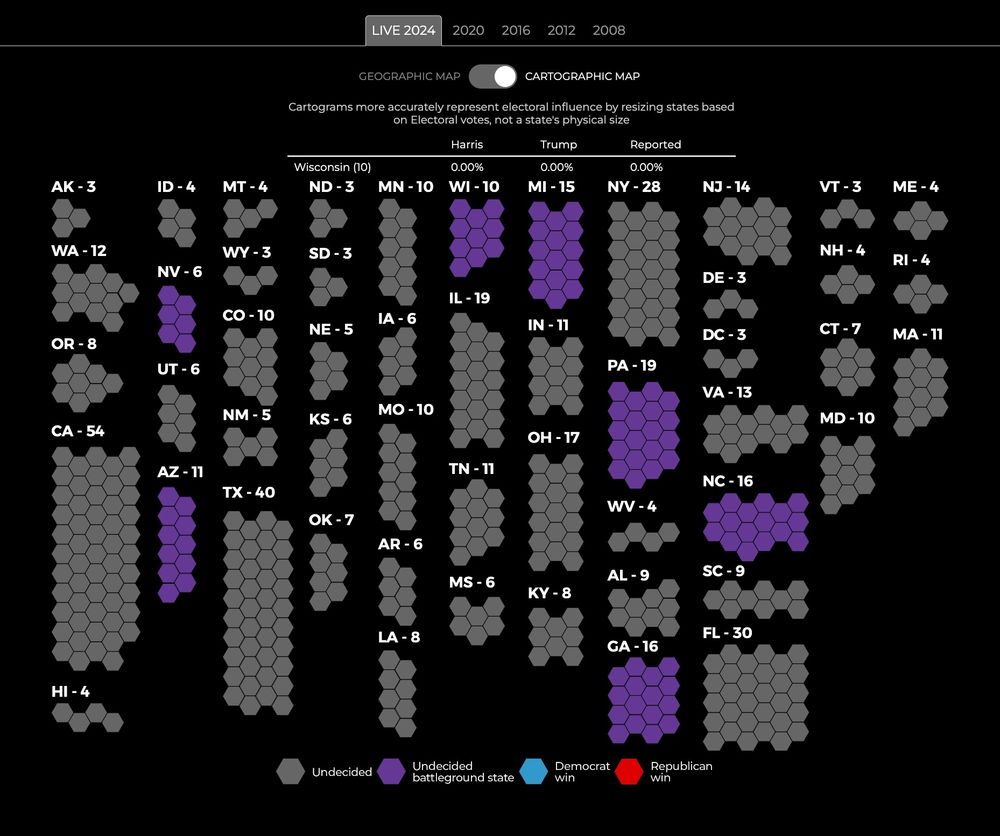
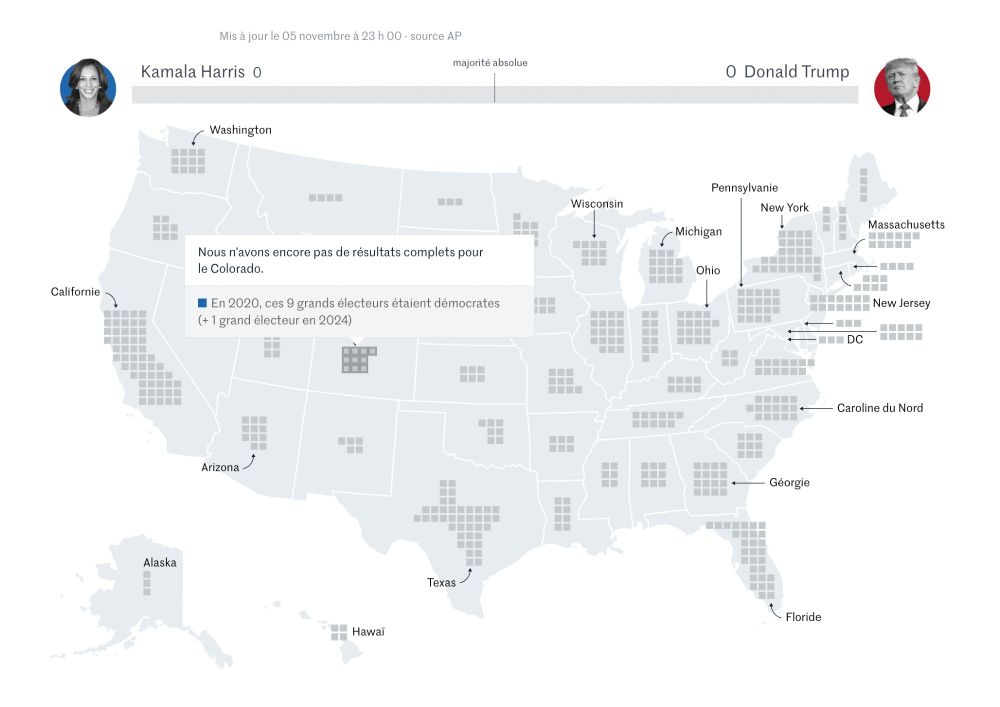
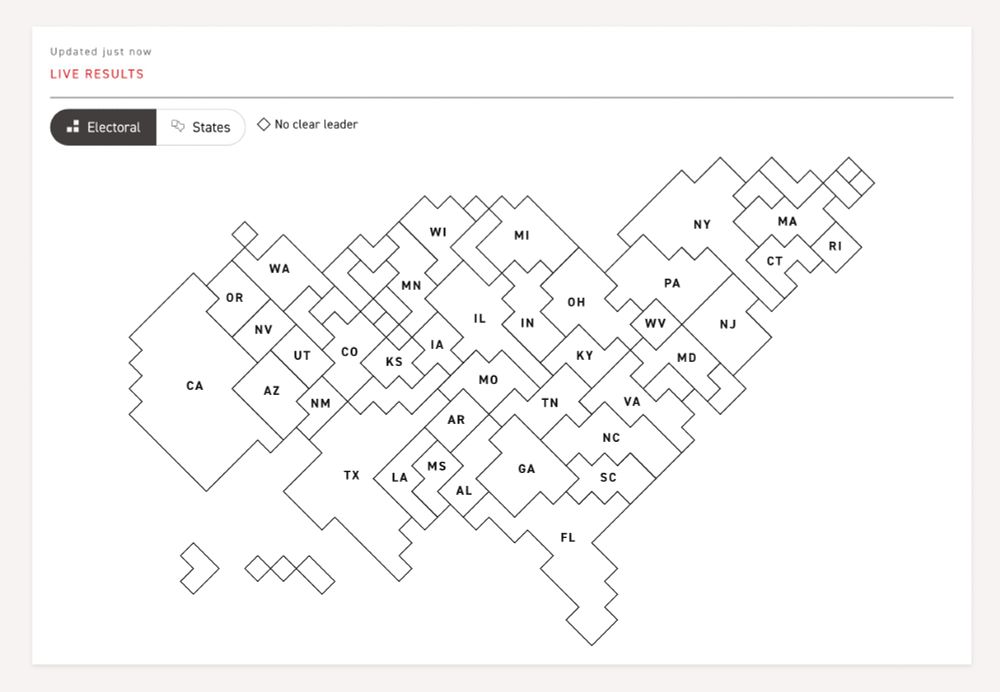
Curious how different news sites visualize U.S. election results? Here are 25+ links — let me know in the comments which ones I missed!
U.S. news sites
===============
→ The New York Times: www.nytimes.com/interactive/...
→ The Washington Post: www.washingtonpost.com/elections/re...
U.S. news sites
===============
→ The New York Times: www.nytimes.com/interactive/...
→ The Washington Post: www.washingtonpost.com/elections/re...
November 5, 2024 at 10:30 PM
Curious how different news sites visualize U.S. election results? Here are 25+ links — let me know in the comments which ones I missed!
U.S. news sites
===============
→ The New York Times: www.nytimes.com/interactive/...
→ The Washington Post: www.washingtonpost.com/elections/re...
U.S. news sites
===============
→ The New York Times: www.nytimes.com/interactive/...
→ The Washington Post: www.washingtonpost.com/elections/re...
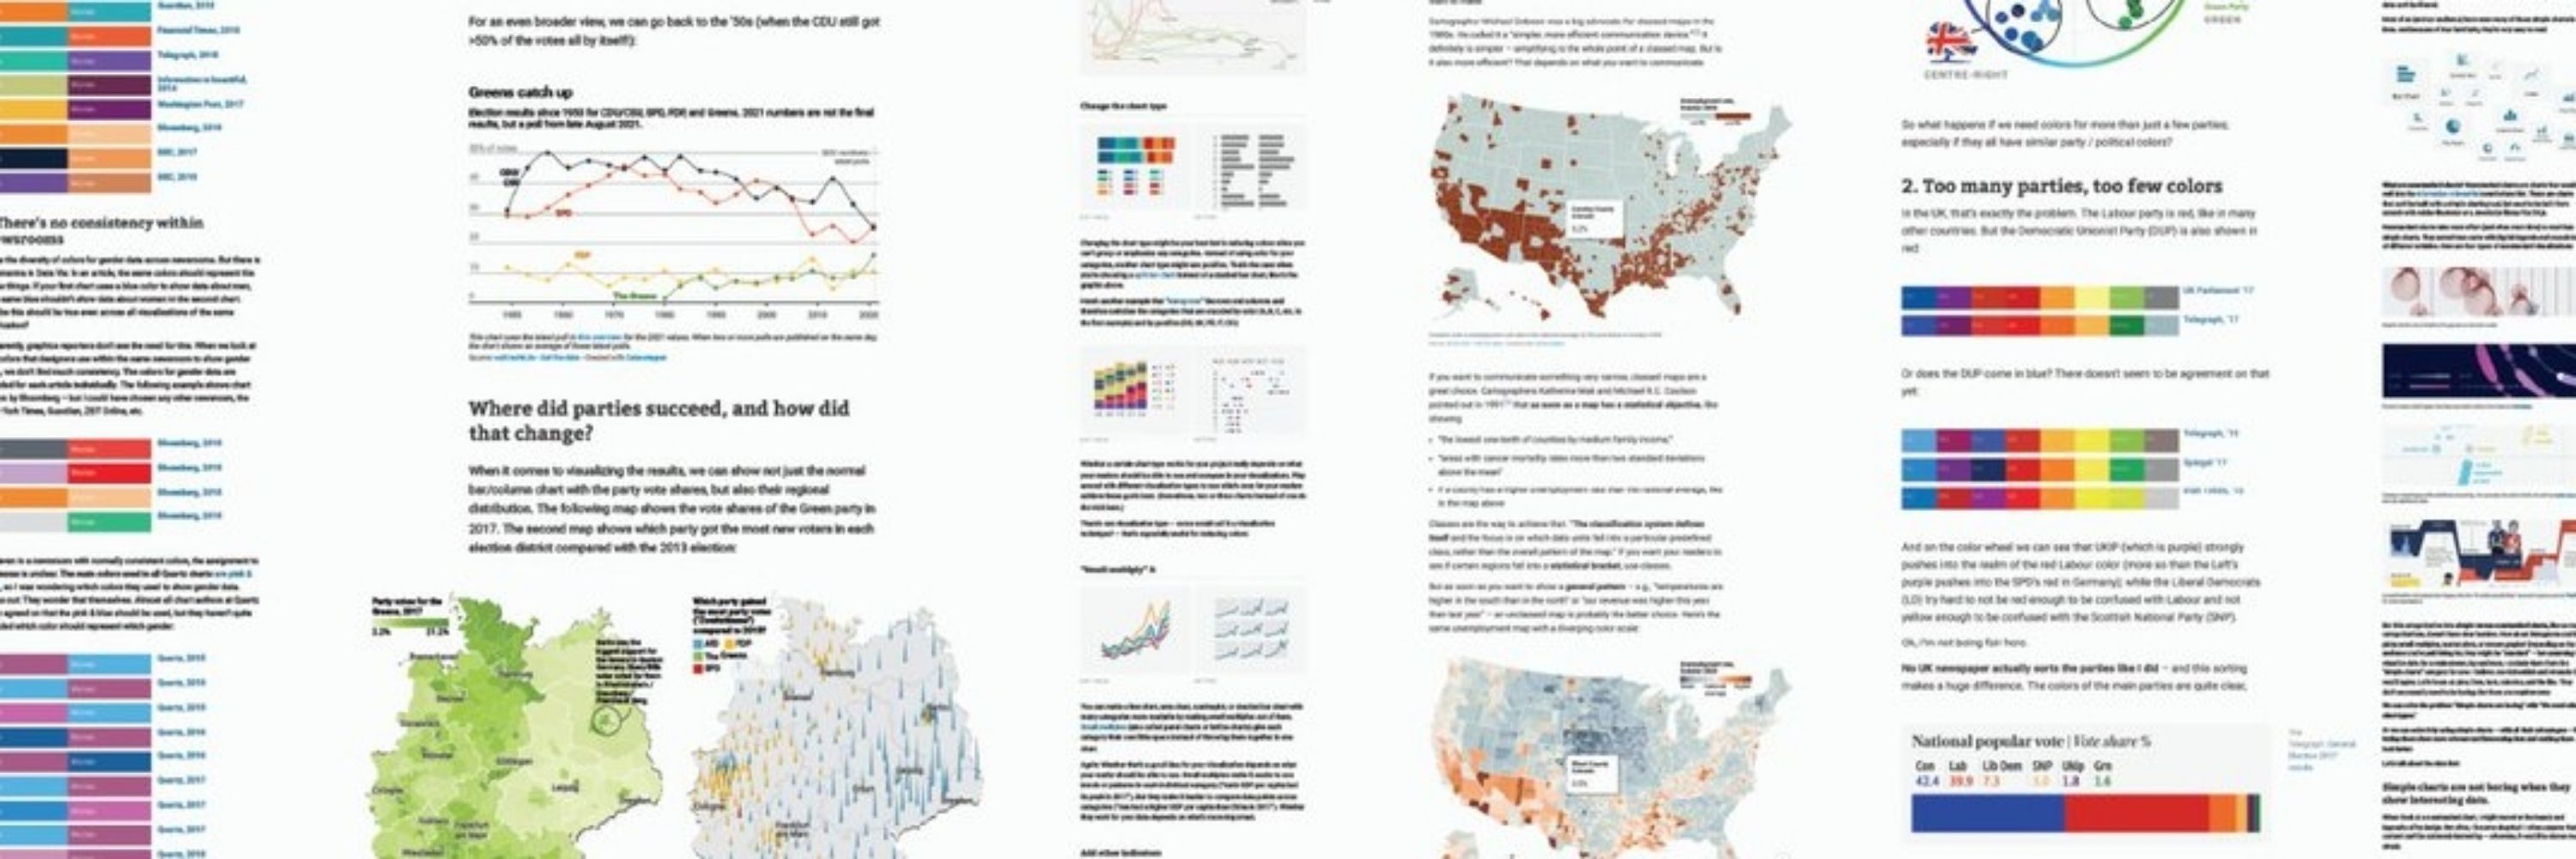
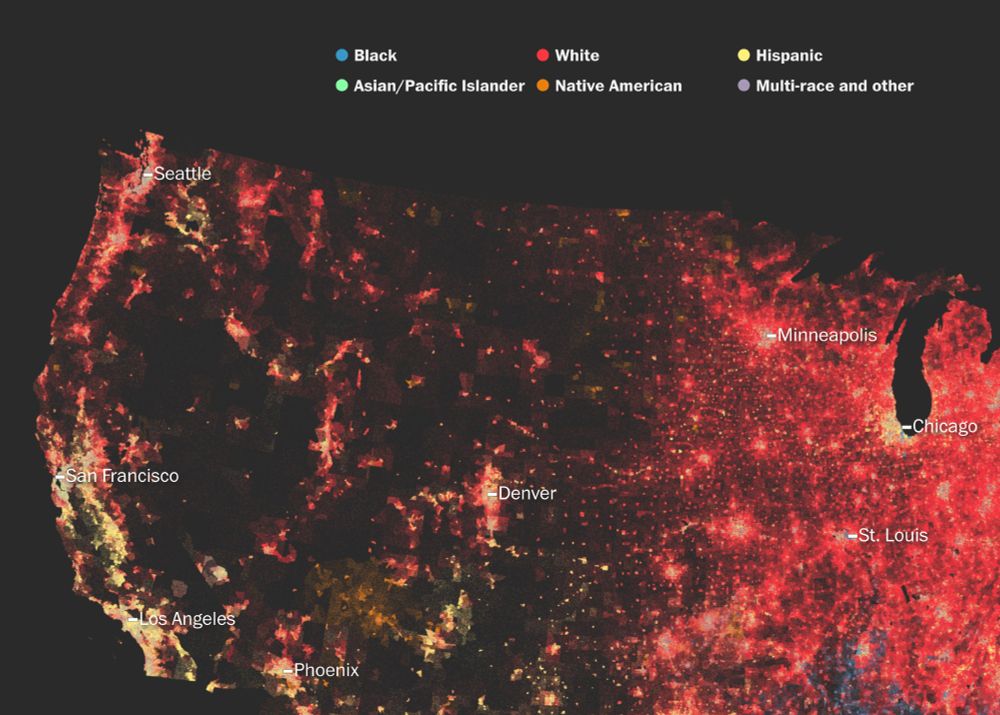
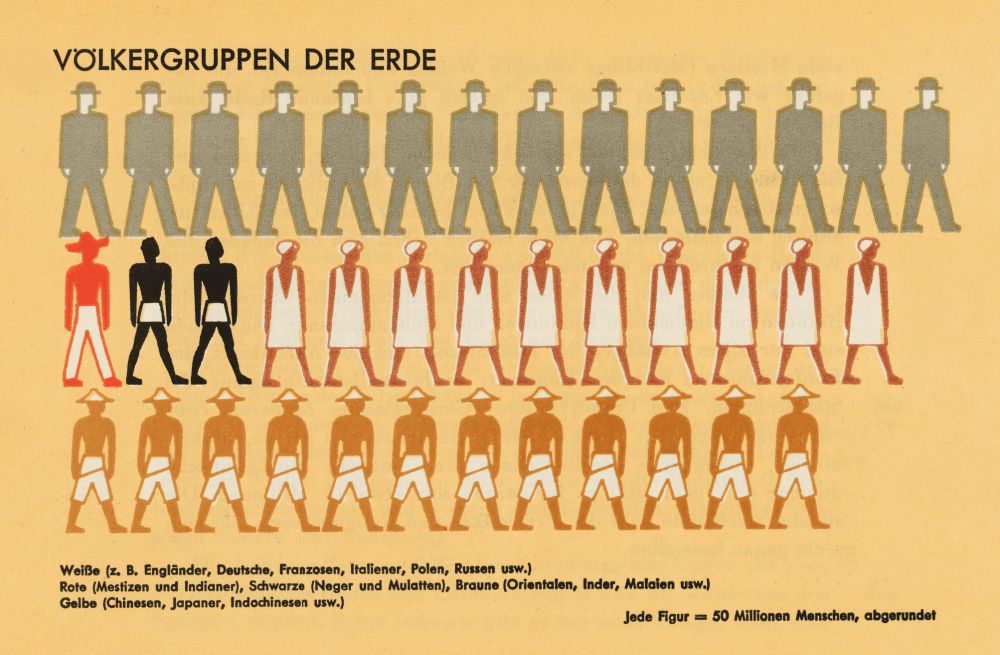
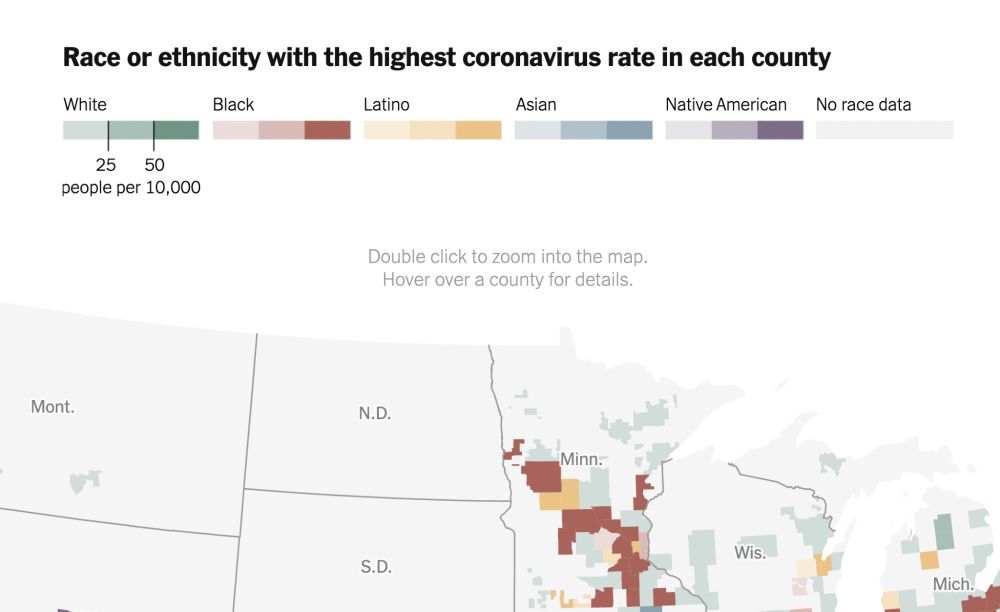
🎉 New blog post! Choosing colors for a #dataviz on race, ethnicity or continents can be tricky. I collected lots of examples and wrote down 6 guidelines to help ensure all your readers feel respected by your color choices: blog.datawrapper.de/colors-for-r...
October 10, 2024 at 10:30 AM
🎉 New blog post! Choosing colors for a #dataviz on race, ethnicity or continents can be tricky. I collected lots of examples and wrote down 6 guidelines to help ensure all your readers feel respected by your color choices: blog.datawrapper.de/colors-for-r...
I'm really looking forward to Rose's findings here!
Might be interesting for others who like #dataviz 📊, too:
Might be interesting for others who like #dataviz 📊, too:
What’s happening in the world of visual and data journalism? What formats, techniques, and topics are having a moment and which ones have proven their staying power?
Join Data Vis Dispatch editor Rose to find out, this Thursday: blog.datawrapper.de/rose-mintzer...
Join Data Vis Dispatch editor Rose to find out, this Thursday: blog.datawrapper.de/rose-mintzer...

Rose Mintzer-Sweeney, Datawrapper, will speak about three years of trends in news visualizations - Datawrapper Blog
We’re excited to announce that our data vis writer Rose Mintzer-Sweeney will speak at the Unwrapped conference about “Three years of trends in news
blog.datawrapper.de
March 12, 2024 at 12:00 PM
I'm really looking forward to Rose's findings here!
Might be interesting for others who like #dataviz 📊, too:
Might be interesting for others who like #dataviz 📊, too:
Reposted by Lisa Charlotte Muth

I'm excited to be on the list of speakers for the upcoming Datawrapper conference. I'll get to talk about what data journalists love most: hacking tools until you find crazy, but useful workarounds. #dataviz 📊
New Unwrapped speaker! @patrickstotz.bsky.social, co-lead of the data & visualization department at the German newsroom Der Spiegel, will share their 7 most satisfying Datawrapper workarounds.
Learn more about Patrick and sign up for his talk here: blog.datawrapper.de/der-spiegel-...
Learn more about Patrick and sign up for his talk here: blog.datawrapper.de/der-spiegel-...


February 29, 2024 at 5:22 PM
I'm excited to be on the list of speakers for the upcoming Datawrapper conference. I'll get to talk about what data journalists love most: hacking tools until you find crazy, but useful workarounds. #dataviz 📊
📊 I'm much looking forward to this talk at the Unwrapped conference (www.datawrapper.de/unwrapped):
New Unwrapped speaker (the 2nd one today!): @juruwolfe.bsky.social will talk about bringing Datawrapper to a newsroom, first at FiveThirtyEight and now at Reuters.
Learn more about her and the Datawrapper chart she's most proud of:
Learn more about her and the Datawrapper chart she's most proud of:

Julia Wolfe, Reuters, will speak about onboarding a newsroom to Datawrapper - Datawrapper Blog
We're excited to announce that Julia Wolfe from Reuters will speak at our Unwrapped conference about "Bringing Datawrapper to your newsroom." From a small
blog.datawrapper.de
February 26, 2024 at 2:40 PM
📊 I'm much looking forward to this talk at the Unwrapped conference (www.datawrapper.de/unwrapped):
Reposted by Lisa Charlotte Muth

This week's Effect+Affect: What can dinner parties teach us about dataviz 📊? Thanks to ensemble perception, your brain is weirdly good at parallel processing faces, grass, and zillions of lines on charts.
effaff.com/read-the-room-ensemble-effect/
effaff.com/read-the-room-ensemble-effect/

Read the room
What can dinner parties teach us about dataviz? Thanks to ensemble perception, your brain is weirdly good at parallel processing faces, grass, and zillions of lines on charts.
effaff.com
February 23, 2024 at 5:42 PM
This week's Effect+Affect: What can dinner parties teach us about dataviz 📊? Thanks to ensemble perception, your brain is weirdly good at parallel processing faces, grass, and zillions of lines on charts.
effaff.com/read-the-room-ensemble-effect/
effaff.com/read-the-room-ensemble-effect/
Reposted by Lisa Charlotte Muth

📣📊 The next data vis book club is happening Friday, March 15th at 7pm UTC during our Unwrapped conference!
We'll be discussing "The Art of Insight" by @albertocairo.bsky.social.
Find all the information for this special session here: blog.datawrapper.de/art-of-insig...
We'll be discussing "The Art of Insight" by @albertocairo.bsky.social.
Find all the information for this special session here: blog.datawrapper.de/art-of-insig...

Read “The Art of Insight” by Alberto Cairo with us! - Datawrapper Blog
“...visualization designers who build meaning as a tribute to themselves or as an aid to others.”
blog.datawrapper.de
February 19, 2024 at 4:52 PM
📣📊 The next data vis book club is happening Friday, March 15th at 7pm UTC during our Unwrapped conference!
We'll be discussing "The Art of Insight" by @albertocairo.bsky.social.
Find all the information for this special session here: blog.datawrapper.de/art-of-insig...
We'll be discussing "The Art of Insight" by @albertocairo.bsky.social.
Find all the information for this special session here: blog.datawrapper.de/art-of-insig...
If you want to find and follow people posting great 📊 data viz content, I can recommend following everyone Andy's following.

Wow the last 36 hrs influx of new Bluesky accounts has been a real shot in the arm for this place in terms of the data viz community 📊.
Getting the band back together is step 1.
Getting that band to resume playing some of the old hits is step 2.
Adding new members, writing new tunes is step 3.
Getting the band back together is step 1.
Getting that band to resume playing some of the old hits is step 2.
Adding new members, writing new tunes is step 3.
February 10, 2024 at 6:08 PM
If you want to find and follow people posting great 📊 data viz content, I can recommend following everyone Andy's following.
Reposted by Lisa Charlotte Muth
🎉📊 New blog post! And — you guessed it — it's about small multiple line charts. When to use them instead of line charts? And how to make them easier to read and more beautiful to look at?
Our writer @lisacmuth.bsky.social covers the do's and don'ts: blog.datawrapper.de/what-to-cons...
Our writer @lisacmuth.bsky.social covers the do's and don'ts: blog.datawrapper.de/what-to-cons...

What to consider when creating small multiple line charts - Datawrapper Blog
When to use small multiple line charts (vs. normal line charts) and how to create better ones. We'll cover the benefits of repeated lines, independent scales, sorting, colors, and more.
blog.datawrapper.de
February 7, 2024 at 2:04 PM
🎉📊 New blog post! And — you guessed it — it's about small multiple line charts. When to use them instead of line charts? And how to make them easier to read and more beautiful to look at?
Our writer @lisacmuth.bsky.social covers the do's and don'ts: blog.datawrapper.de/what-to-cons...
Our writer @lisacmuth.bsky.social covers the do's and don'ts: blog.datawrapper.de/what-to-cons...
There's a new chart type in Datawrapper 🎉
And it's one of my favorites: Small multiple line charts.
I'm excited to see what you all (and we) will build with it!
And it's one of my favorites: Small multiple line charts.
I'm excited to see what you all (and we) will build with it!
🎉🎉🎉 Big news: You can now create small multiple line charts with our new chart type “Multiple Lines”! Give each line its own panel, then sort, style, annotate, show lines on independent scales, and more.
📊 See what’s possible in our announcement post: blog.datawrapper.de/small-multip...
📊 See what’s possible in our announcement post: blog.datawrapper.de/small-multip...

New: Small multiple line charts in Datawrapper - Datawrapper Blog
You can now create small multiple line charts with our new chart type “Multiple Lines”! Give each line its own panel, add annotations and range highlights, show the lines on independent scales, an...
blog.datawrapper.de
February 5, 2024 at 2:52 PM
There's a new chart type in Datawrapper 🎉
And it's one of my favorites: Small multiple line charts.
I'm excited to see what you all (and we) will build with it!
And it's one of my favorites: Small multiple line charts.
I'm excited to see what you all (and we) will build with it!
📊 Connected scatterplots: Good or bad? Fun or frustrating? My colleague Luc Guillemot has opinions about them:
Connected scatterplots are controversial. They're weird. They look like line charts but they definitely are not line charts. But — and! — our visualization developer Luc is a loyal fan.
Read his thoughts on why the connected scatterplot deserves your attention: blog.datawrapper.de/connected-sc...
Read his thoughts on why the connected scatterplot deserves your attention: blog.datawrapper.de/connected-sc...

Are connected scatterplots so bad? - Datawrapper Blog
Connected scatterplots have critics galore — but I still like them, and I tried to figure out why.
blog.datawrapper.de
February 1, 2024 at 7:38 AM
📊 Connected scatterplots: Good or bad? Fun or frustrating? My colleague Luc Guillemot has opinions about them:
It's happening! I'm thrilled to announce the first three speakers (of more than 20!) who will give a talk at the Datawrapper conference Unwrapped:
📣📊 We’re excited to announce the first speakers for our Datawrapper conference on March 13-15!
👉 Amanda Cox, on making better simple charts
👉 @juliustroeger.bsky.social, on animations & scroll formats
👉 C.J. Sinner, on creating scatterplot awesomeness
Register here: www.datawrapper.de/unwrapped
👉 Amanda Cox, on making better simple charts
👉 @juliustroeger.bsky.social, on animations & scroll formats
👉 C.J. Sinner, on creating scatterplot awesomeness
Register here: www.datawrapper.de/unwrapped

Join us for Unwrapped, March 13-15
Learn how others are making the most of Datawrapper at our free, virtual conference.
www.datawrapper.de
January 29, 2024 at 4:41 PM
It's happening! I'm thrilled to announce the first three speakers (of more than 20!) who will give a talk at the Datawrapper conference Unwrapped:
Reposted by Lisa Charlotte Muth
📊 Yesterday was Data Vis Dispatch day! The lateste episode includes the Taiwan elections 🗳️, shipping routes 🚢, and a very hot 2023 🔥: blog.datawrapper.de/data-vis-dis...


January 17, 2024 at 7:09 AM
📊 Yesterday was Data Vis Dispatch day! The lateste episode includes the Taiwan elections 🗳️, shipping routes 🚢, and a very hot 2023 🔥: blog.datawrapper.de/data-vis-dis...
Reposted by Lisa Charlotte Muth

If you’re at all interested in talking about data viz, sign up for the feed so we can chat with you!

This new curated feed for the data visualisation community by @jacqueschrag.com is fantastic, highly recommended if you're interested in the field! 📊
bsky.app/profile/did:...
bsky.app/profile/did:...
January 14, 2024 at 12:52 PM
If you’re at all interested in talking about data viz, sign up for the feed so we can chat with you!
Reposted by Lisa Charlotte Muth

I think small multiples may be my favorite visualization technique. I love how these maps from the @nytimes.com give a sense of the polar vortex dissolving from a concentrated mass of bitter cold air to a much larger area of merely very cold air. www.nytimes.com/interactive/...

January 12, 2024 at 3:43 PM
I think small multiples may be my favorite visualization technique. I love how these maps from the @nytimes.com give a sense of the polar vortex dissolving from a concentrated mass of bitter cold air to a much larger area of merely very cold air. www.nytimes.com/interactive/...
YES YOU SHOULD! Let me know if you have any questions about it, here or via [email protected].
Are you a data wrapper user who want to share tips, tricks, and lessons learned? You should submit a talk! 📊
"Speaking at a conference" is your New Year's resolution? Lucky you: There's ONE day left to tell us about your talk ideas for Unwrapped, our conference for Datawrapper users like you. Here's what we're looking for: blog.datawrapper.de/call-for-spe...
January 12, 2024 at 7:08 AM
YES YOU SHOULD! Let me know if you have any questions about it, here or via [email protected].
Reposted by Lisa Charlotte Muth
"Speaking at a conference" is your New Year's resolution? Lucky you: There's ONE day left to tell us about your talk ideas for Unwrapped, our conference for Datawrapper users like you. Here's what we're looking for: blog.datawrapper.de/call-for-spe...

Speak at Unwrapped, the Datawrapper conference! - Datawrapper Blog
Share your idea for a talk at Unwrapped, the virtual Datawrapper conference in March 2024.
blog.datawrapper.de
January 11, 2024 at 4:03 PM
"Speaking at a conference" is your New Year's resolution? Lucky you: There's ONE day left to tell us about your talk ideas for Unwrapped, our conference for Datawrapper users like you. Here's what we're looking for: blog.datawrapper.de/call-for-spe...
Reposted by Lisa Charlotte Muth

Join me on Jan 29th - I’m such a fan of the @datawrapper.bsky.social Data Vis Book Club which makes it all the more special an honour to be taking part as an author. Looking forward to chatting and answering questions!

Another book club by @datawrapper.bsky.social, this time on "Questions in Dataviz" by @theneilrichards.bsky.social, on January 29th.
It's virtual, everyone can attend. Neil will be there to answer questions. 📊
blog.datawrapper.de/questions-in...
It's virtual, everyone can attend. Neil will be there to answer questions. 📊
blog.datawrapper.de/questions-in...
Read “Questions in Dataviz” by Neil Richards with us! - Datawrapper Blog
“...a journey into data visualization.”
blog.datawrapper.de
January 5, 2024 at 10:41 PM
Join me on Jan 29th - I’m such a fan of the @datawrapper.bsky.social Data Vis Book Club which makes it all the more special an honour to be taking part as an author. Looking forward to chatting and answering questions!