


RJ Andrews
@infowetrust.com
Obsessed with data graphics. Stumbling toward the light. New book INFO WE TRUST https://linktr.ee/infowetrust
Pinned
RJ Andrews
@infowetrust.com
· Feb 27
My best client work develops singular powerful images that attract and inform minds. To do good work we need to engage and collaborate in a way that has creative energy, iteration, and momentum. I need to learn lots from you to get you where you need to go.
Learn more at infoWeTrust.com
Learn more at infoWeTrust.com
Reposted by RJ Andrews

Objects in mirror are closer than they appear… Ruby Bridges is only 71 (from my 2024 election comic spinweaveandcut.com/election-202...)

November 15, 2025 at 4:15 PM
Objects in mirror are closer than they appear… Ruby Bridges is only 71 (from my 2024 election comic spinweaveandcut.com/election-202...)
Micrography is a promising avenue for making more meaningful charts. In fact, there are some examples of shaped- or micro- text already enhancing visualization: www.chartography.net/p/data-micro...

November 15, 2025 at 4:34 PM
Micrography is a promising avenue for making more meaningful charts. In fact, there are some examples of shaped- or micro- text already enhancing visualization: www.chartography.net/p/data-micro...
Reposted by RJ Andrews

This 3D cholera map now comes with an anatomically correct handle that can be reattached, although this is not advisable
3dartmaps.etsy.com/listing/4300...
3dartmaps.etsy.com/listing/4300...


November 15, 2025 at 2:59 PM
This 3D cholera map now comes with an anatomically correct handle that can be reattached, although this is not advisable
3dartmaps.etsy.com/listing/4300...
3dartmaps.etsy.com/listing/4300...
Reposted by RJ Andrews

During the 1906 San Francisco earthquake, a marble statue of Louis Agassiz fell from 2nd floor of Stanford's Zoology building into main quad.
Professor Frank Angell reportedly quipped:
"Agassiz was great in the abstract but not in the concrete."
The statue was unharmed, returned to its perch...
Professor Frank Angell reportedly quipped:
"Agassiz was great in the abstract but not in the concrete."
The statue was unharmed, returned to its perch...

April 1, 2025 at 12:59 AM
During the 1906 San Francisco earthquake, a marble statue of Louis Agassiz fell from 2nd floor of Stanford's Zoology building into main quad.
Professor Frank Angell reportedly quipped:
"Agassiz was great in the abstract but not in the concrete."
The statue was unharmed, returned to its perch...
Professor Frank Angell reportedly quipped:
"Agassiz was great in the abstract but not in the concrete."
The statue was unharmed, returned to its perch...
unrolling the Zheng He nautical atlas

November 14, 2025 at 11:18 PM
unrolling the Zheng He nautical atlas
Reposted by RJ Andrews
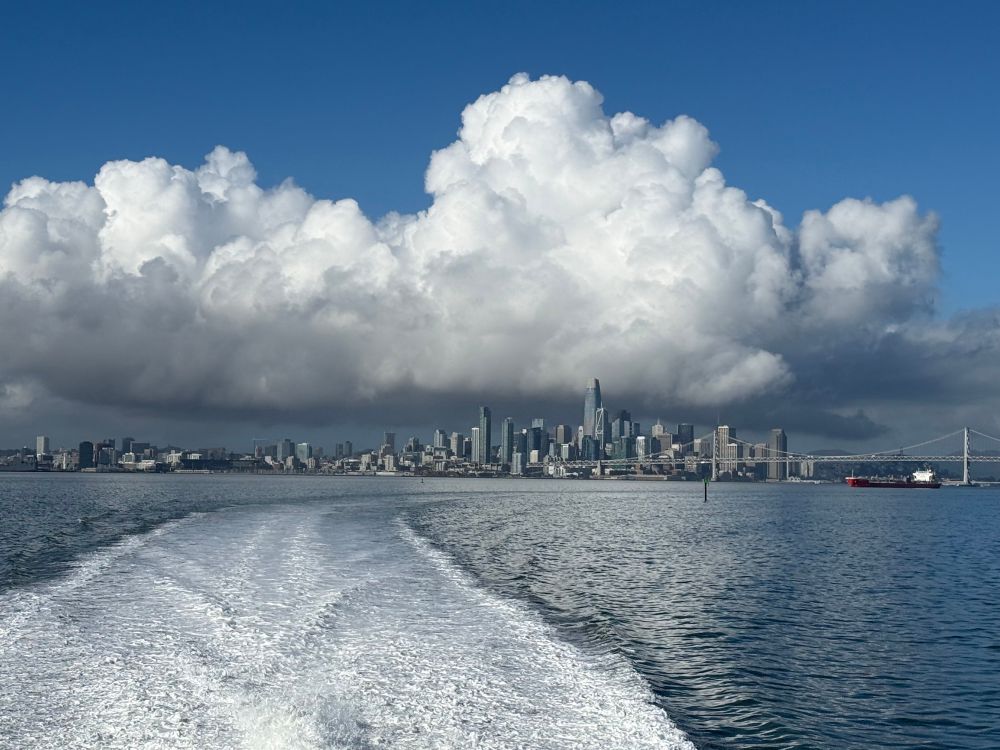


It's going to be an awesome day.

November 14, 2025 at 3:30 PM
It's going to be an awesome day.
The per sign ⅌ is a rare symbol used to indicate a ratio. In English, it can replace the word "per" in phrases such as miles per hour ("miles ⅌ hour"). en.wikipedia.org/wiki/Per_sign

Per sign - Wikipedia
en.wikipedia.org
November 14, 2025 at 3:15 PM
The per sign ⅌ is a rare symbol used to indicate a ratio. In English, it can replace the word "per" in phrases such as miles per hour ("miles ⅌ hour"). en.wikipedia.org/wiki/Per_sign
Reposted by RJ Andrews
Chartography mentioned!
“Brilliant article from RJ, might even be the best thing I read this month, articulating something that is hard to pin down, but he nails it with aplomb: Our world feels awash in information windows but devoid of information diamonds."
“Brilliant article from RJ, might even be the best thing I read this month, articulating something that is hard to pin down, but he nails it with aplomb: Our world feels awash in information windows but devoid of information diamonds."

My October newsletter, issued to subscribers at the end of the month, is now opened for all to view. Check out the latest 50 best things I've encountered in the #dataviz field.
visualisingdata.com/2025/11/the-...
visualisingdata.com/2025/11/the-...
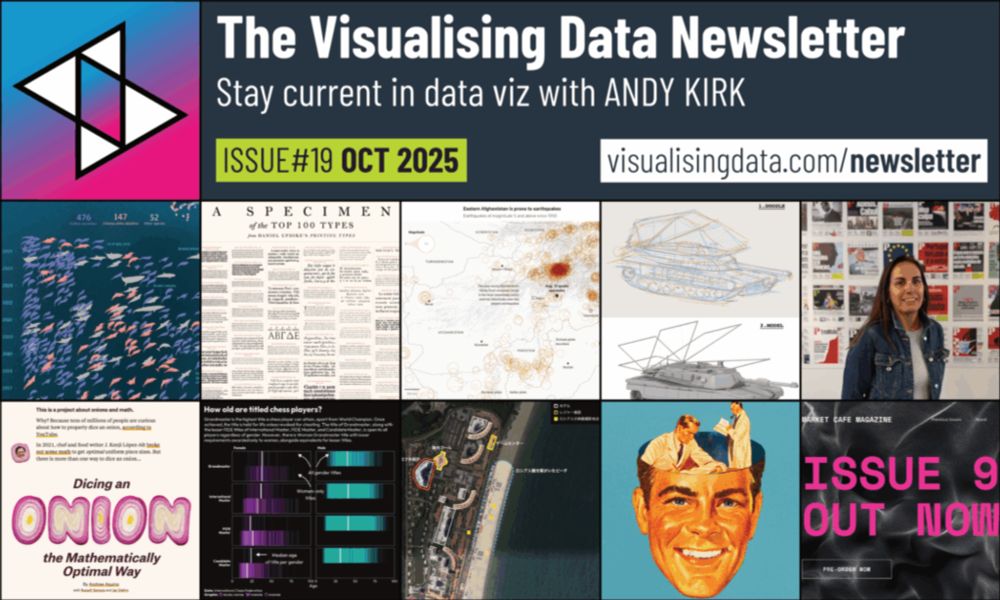
The October 2025 newsletter is now open to all - Data Viz Excellence, Everywhere
My October newsletter, sent out to subscribers at the end of last month, is now open for all to read. You can access this issue, as well as visit the growing catalogue of previous issues, on the Newsl...
visualisingdata.com
November 14, 2025 at 7:43 AM
Chartography mentioned!
“Brilliant article from RJ, might even be the best thing I read this month, articulating something that is hard to pin down, but he nails it with aplomb: Our world feels awash in information windows but devoid of information diamonds."
“Brilliant article from RJ, might even be the best thing I read this month, articulating something that is hard to pin down, but he nails it with aplomb: Our world feels awash in information windows but devoid of information diamonds."
My October newsletter, issued to subscribers at the end of the month, is now opened for all to view. Check out the latest 50 best things I've encountered in the #dataviz field.
visualisingdata.com/2025/11/the-...
visualisingdata.com/2025/11/the-...
The October 2025 newsletter is now open to all - Data Viz Excellence, Everywhere
My October newsletter, sent out to subscribers at the end of last month, is now open for all to read. You can access this issue, as well as visit the growing catalogue of previous issues, on the Newsl...
visualisingdata.com
November 14, 2025 at 7:43 AM
Chartography mentioned!
“Brilliant article from RJ, might even be the best thing I read this month, articulating something that is hard to pin down, but he nails it with aplomb: Our world feels awash in information windows but devoid of information diamonds."
“Brilliant article from RJ, might even be the best thing I read this month, articulating something that is hard to pin down, but he nails it with aplomb: Our world feels awash in information windows but devoid of information diamonds."

November 14, 2025 at 12:15 AM
awesome book haul!
2025 Storytelling with data anniversary ed.
2014 Raw Data
2000 Digital Diagrams
1934 Nationalsozialistischer Wirtschaftsaufbau
1923 Manual of Charting
1885 History of Prices since the Year 1850
2025 Storytelling with data anniversary ed.
2014 Raw Data
2000 Digital Diagrams
1934 Nationalsozialistischer Wirtschaftsaufbau
1923 Manual of Charting
1885 History of Prices since the Year 1850

November 13, 2025 at 9:34 PM
awesome book haul!
2025 Storytelling with data anniversary ed.
2014 Raw Data
2000 Digital Diagrams
1934 Nationalsozialistischer Wirtschaftsaufbau
1923 Manual of Charting
1885 History of Prices since the Year 1850
2025 Storytelling with data anniversary ed.
2014 Raw Data
2000 Digital Diagrams
1934 Nationalsozialistischer Wirtschaftsaufbau
1923 Manual of Charting
1885 History of Prices since the Year 1850
The most dreadful origin story for a chart type?:
Near Bellevue, a locomotive axle snapped on the descent to the city. The iron horse pitched over the rails, the boilers ruptured, and the front passenger cars jackknifed.
In moments the wreck became a furnace.
www.chartography.net/p/charts-fol...
Near Bellevue, a locomotive axle snapped on the descent to the city. The iron horse pitched over the rails, the boilers ruptured, and the front passenger cars jackknifed.
In moments the wreck became a furnace.
www.chartography.net/p/charts-fol...

Charts Follow Chaos
How information design rescued the railway from fiery catastrophe.
www.chartography.net
November 13, 2025 at 5:49 PM
The most dreadful origin story for a chart type?:
Near Bellevue, a locomotive axle snapped on the descent to the city. The iron horse pitched over the rails, the boilers ruptured, and the front passenger cars jackknifed.
In moments the wreck became a furnace.
www.chartography.net/p/charts-fol...
Near Bellevue, a locomotive axle snapped on the descent to the city. The iron horse pitched over the rails, the boilers ruptured, and the front passenger cars jackknifed.
In moments the wreck became a furnace.
www.chartography.net/p/charts-fol...
Liking DIGITAL DIAGRAMS (2000) by Diagram Group’s Trevor Bounford much more than expected—And not just because it showcases lots of @nigelblue.bsky.social but that’s always a plus!

November 13, 2025 at 3:51 PM
Liking DIGITAL DIAGRAMS (2000) by Diagram Group’s Trevor Bounford much more than expected—And not just because it showcases lots of @nigelblue.bsky.social but that’s always a plus!
Reposted by RJ Andrews

a “Space Force”, if you will


November 13, 2025 at 2:27 PM
a “Space Force”, if you will
Reposted by RJ Andrews

Why do I include poetry in a presentation about data visualization? Because cartography IS poetry.
The ocean is not literally blue. The land is not literally green.
Symbolism, metaphor, language, cultural context and history all inform map making.
Both exercise the same brain-parts.
The ocean is not literally blue. The land is not literally green.
Symbolism, metaphor, language, cultural context and history all inform map making.
Both exercise the same brain-parts.
Guess I'm a freelance corporate consultant now because I just led a really fun session walking a group of software developers through some mind bending relationship visualization problems.
Bibliography: Tufte, Margaret Atwood, Borges, Tobler, Cynthia Brewer, RJ Andrews and Madeline L'Engle
Bibliography: Tufte, Margaret Atwood, Borges, Tobler, Cynthia Brewer, RJ Andrews and Madeline L'Engle
November 12, 2025 at 10:26 PM
Why do I include poetry in a presentation about data visualization? Because cartography IS poetry.
The ocean is not literally blue. The land is not literally green.
Symbolism, metaphor, language, cultural context and history all inform map making.
Both exercise the same brain-parts.
The ocean is not literally blue. The land is not literally green.
Symbolism, metaphor, language, cultural context and history all inform map making.
Both exercise the same brain-parts.
Reposted by RJ Andrews

With in-depth research from sign painter Morgane Côme and dozens of rare alphabet plates, it’s an essential reference and delightful guide to the fashionable letterforms that defined the classic French streetscape.

November 12, 2025 at 9:17 PM
With in-depth research from sign painter Morgane Côme and dozens of rare alphabet plates, it’s an essential reference and delightful guide to the fashionable letterforms that defined the classic French streetscape.
Reposted by RJ Andrews

The ninth annual Pudding Cup is live! Submit your non-commercial data/visual stories. Winners receive $1,500.
pudding.cool/pudding-cup/
pudding.cool/pudding-cup/

The Pudding Cup
The Pudding's annual picks for the best visual and data-driven stories
pudding.cool
November 12, 2025 at 6:37 PM
The ninth annual Pudding Cup is live! Submit your non-commercial data/visual stories. Winners receive $1,500.
pudding.cool/pudding-cup/
pudding.cool/pudding-cup/
Reposted by RJ Andrews


November 12, 2025 at 3:57 PM
The catastrophe was not just the deadliest railway accident ever. It was an early reckoning with the speed of industrial life. It revealed how thin the line was between harnessing energy and being consumed by it.
Could the speed of progress be tamed? My latest:
www.chartography.net/p/charts-fol...
Could the speed of progress be tamed? My latest:
www.chartography.net/p/charts-fol...
Charts Follow Chaos
How information design rescued the railway from fiery catastrophe.
www.chartography.net
November 12, 2025 at 4:03 PM
The catastrophe was not just the deadliest railway accident ever. It was an early reckoning with the speed of industrial life. It revealed how thin the line was between harnessing energy and being consumed by it.
Could the speed of progress be tamed? My latest:
www.chartography.net/p/charts-fol...
Could the speed of progress be tamed? My latest:
www.chartography.net/p/charts-fol...
Reposted by RJ Andrews

#TodayinHistory #dataviz #OTD 📊
Bertillon introduced the first standardized system of causes of death, and made many statistical charts and maps.
This lovely one shows movement of travelers through Paris in 1889, using flow lines overlaid on the city map, bar charts and a pie chart legend.
Bertillon introduced the first standardized system of causes of death, and made many statistical charts and maps.
This lovely one shows movement of travelers through Paris in 1889, using flow lines overlaid on the city map, bar charts and a pie chart legend.

November 12, 2025 at 1:09 AM
#TodayinHistory #dataviz #OTD 📊
Bertillon introduced the first standardized system of causes of death, and made many statistical charts and maps.
This lovely one shows movement of travelers through Paris in 1889, using flow lines overlaid on the city map, bar charts and a pie chart legend.
Bertillon introduced the first standardized system of causes of death, and made many statistical charts and maps.
This lovely one shows movement of travelers through Paris in 1889, using flow lines overlaid on the city map, bar charts and a pie chart legend.
Reposted by RJ Andrews

In the century leading up to 1975, nearly 6000 freighters went down in the Great Lakes.
The Edmund Fitzgerald was the last.
The last. In 50 years, not a single commercial freighter has been lost in the Great Lakes.
Why?
It's NOAA. Of course it's NOAA.
The Edmund Fitzgerald was the last.
The last. In 50 years, not a single commercial freighter has been lost in the Great Lakes.
Why?
It's NOAA. Of course it's NOAA.
November 11, 2025 at 1:50 AM
In the century leading up to 1975, nearly 6000 freighters went down in the Great Lakes.
The Edmund Fitzgerald was the last.
The last. In 50 years, not a single commercial freighter has been lost in the Great Lakes.
Why?
It's NOAA. Of course it's NOAA.
The Edmund Fitzgerald was the last.
The last. In 50 years, not a single commercial freighter has been lost in the Great Lakes.
Why?
It's NOAA. Of course it's NOAA.
Reposted by RJ Andrews

Don’t worry, the enormous Smoke Room on this deck isn’t the only one
November 11, 2025 at 2:26 AM
Don’t worry, the enormous Smoke Room on this deck isn’t the only one
Started writing a newsletter about collecting rare books. That evolved to writing about an 1842 train disaster. (Which is a good metaphor for how I collect rare books.)
Coming soon to chartography.net !
Coming soon to chartography.net !

Chartography | RJ Andrews | Substack
Information-design insights and inspiration. Featuring charts and more, from yesteryear to today. Click to read Chartography, by RJ Andrews, a Substack publication with thousands of subscribers.
chartography.net
November 10, 2025 at 10:58 PM
Started writing a newsletter about collecting rare books. That evolved to writing about an 1842 train disaster. (Which is a good metaphor for how I collect rare books.)
Coming soon to chartography.net !
Coming soon to chartography.net !
"It's not magic, it's work."

A rare interview with the creators of the always-funny, always-brilliant, and *usually*-sexy—or occasionally anti-sexy—OGLAF!
Cooper has kept a low profile over the years, but is legitimately one of the very best artists in comics today. Read OGLAF if you're old enough to drive!
Cooper has kept a low profile over the years, but is legitimately one of the very best artists in comics today. Read OGLAF if you're old enough to drive!

Talking Oglaf with Trudy Cooper and Doug Bayne: 'We'd stay up all night drawing stuff to make each other laugh' - The Comics Journal
Other than some time off every year for Christmas, Trudy Cooper and Doug Bayne have delivered a new Oglaf comic, skewering fantasy tropes with absolutely not safe for work humor, every week since 2008...
www.tcj.com
November 10, 2025 at 8:44 PM
"It's not magic, it's work."