


Jamon M - MLS and footy analysis
@jamonm.bsky.social
American Soccer Analysis: Co-creator g+ GameFlows and the Where Goals Come From project. he/him
Pinned

With the dismissal of Peter Vermes today from Sporting Kansas City, I wanted to share a bit of analysis that shows a pervasive problem in simple terms. A short 🧵:
Since 2022, no team in MLS has had a worse xG per Shot Differential, and it's really not even close.
1/
Since 2022, no team in MLS has had a worse xG per Shot Differential, and it's really not even close.
1/
Miami and Vancouver are not only worthy MLS Cup opponents, they were 1st and 2nd respectively in total goals and total xG (ASA's model).
This should make for an attacking final instead of the typical "cagey" type of game we usually get until that opening goal is scored.
Should be lots of fun.
This should make for an attacking final instead of the typical "cagey" type of game we usually get until that opening goal is scored.
Should be lots of fun.

This is the MLS Cup matchup you wanted if you wanted the highest likelihood of an incredible game. I'm pumped.
November 30, 2025 at 4:17 AM
Miami and Vancouver are not only worthy MLS Cup opponents, they were 1st and 2nd respectively in total goals and total xG (ASA's model).
This should make for an attacking final instead of the typical "cagey" type of game we usually get until that opening goal is scored.
Should be lots of fun.
This should make for an attacking final instead of the typical "cagey" type of game we usually get until that opening goal is scored.
Should be lots of fun.
What a move by Ahmed. Getting free-and-clear into the cutback zone gave him a chance to just pick out the best run.
3-0 at the half and just could not have gone better for Vancouver.
3-0 at the half and just could not have gone better for Vancouver.
November 30, 2025 at 3:05 AM
What a move by Ahmed. Getting free-and-clear into the cutback zone gave him a chance to just pick out the best run.
3-0 at the half and just could not have gone better for Vancouver.
3-0 at the half and just could not have gone better for Vancouver.
Obviously no Friday Stat Dump this weekend due to time with family, but I’ll be watching these MLS semi as much as possible.
I’ll do a special look at the two teams that remain next week.
I’ll do a special look at the two teams that remain next week.
November 29, 2025 at 11:08 PM
Obviously no Friday Stat Dump this weekend due to time with family, but I’ll be watching these MLS semi as much as possible.
I’ll do a special look at the two teams that remain next week.
I’ll do a special look at the two teams that remain next week.
That was a lot of fun. Vancouver has been a lot of fun this season.
Happy for their fans, and the 53K that showed up tonight.
Weird season for LAFC, but it’s nice that Son is working out. Can’t wait to see a full season of him with this group.
Happy for their fans, and the 53K that showed up tonight.
Weird season for LAFC, but it’s nice that Son is working out. Can’t wait to see a full season of him with this group.
November 23, 2025 at 5:44 AM
That was a lot of fun. Vancouver has been a lot of fun this season.
Happy for their fans, and the 53K that showed up tonight.
Weird season for LAFC, but it’s nice that Son is working out. Can’t wait to see a full season of him with this group.
Happy for their fans, and the 53K that showed up tonight.
Weird season for LAFC, but it’s nice that Son is working out. Can’t wait to see a full season of him with this group.
That second yellow to Blackmon has changed everything. Son goal, LAFC momentum, now an extra time advantage.
And even if Vancouver somehow advances, they won’t have a very key player for the Western finals.
And even if Vancouver somehow advances, they won’t have a very key player for the Western finals.
November 23, 2025 at 4:47 AM
That second yellow to Blackmon has changed everything. Son goal, LAFC momentum, now an extra time advantage.
And even if Vancouver somehow advances, they won’t have a very key player for the Western finals.
And even if Vancouver somehow advances, they won’t have a very key player for the Western finals.
Regular FSD readers (thank you!) might note something new: I've added grouping bars to my analysis toolkit.
Not just another chart, it's extremely configurable across the 2,000 metrics/stats I can track.
What group of metrics/stats would you like to see next? Here's xG Tier goals:
Not just another chart, it's extremely configurable across the 2,000 metrics/stats I can track.
What group of metrics/stats would you like to see next? Here's xG Tier goals:

November 22, 2025 at 1:22 AM
Regular FSD readers (thank you!) might note something new: I've added grouping bars to my analysis toolkit.
Not just another chart, it's extremely configurable across the 2,000 metrics/stats I can track.
What group of metrics/stats would you like to see next? Here's xG Tier goals:
Not just another chart, it's extremely configurable across the 2,000 metrics/stats I can track.
What group of metrics/stats would you like to see next? Here's xG Tier goals:
Friday Stat Dump: MLS 2025 Ball-winning Action leaders.
Back in June, I wrote about the value of recovery actions in a FSD thread and for Backheeled.
In short, I demonstrated a solid positive correlation between recovery differential and goal differential.
1/
www.backheeled.com/winning-duel...
Back in June, I wrote about the value of recovery actions in a FSD thread and for Backheeled.
In short, I demonstrated a solid positive correlation between recovery differential and goal differential.
1/
www.backheeled.com/winning-duel...

Does winning duels lead to winning MLS games? Finding a defensive stat that really matters
We found the real “50-50 balls”, the ones every soccer player on the planet was told to win growing up.
www.backheeled.com
November 22, 2025 at 12:29 AM
Friday Stat Dump: MLS 2025 Ball-winning Action leaders.
Back in June, I wrote about the value of recovery actions in a FSD thread and for Backheeled.
In short, I demonstrated a solid positive correlation between recovery differential and goal differential.
1/
www.backheeled.com/winning-duel...
Back in June, I wrote about the value of recovery actions in a FSD thread and for Backheeled.
In short, I demonstrated a solid positive correlation between recovery differential and goal differential.
1/
www.backheeled.com/winning-duel...
Reposted by Jamon M - MLS and footy analysis

Alex Freeman’s story I feel like is almost underrated. Became a full time starter this season and not only was MLS Best XI but is also contributing to the national team. His ascendence in 2025 is remarkable
November 19, 2025 at 12:31 AM
Alex Freeman’s story I feel like is almost underrated. Became a full time starter this season and not only was MLS Best XI but is also contributing to the national team. His ascendence in 2025 is remarkable
No Friday Stat Dump today due to family plans. I may produce one tomorrow.
Either way, enjoy the playoff games and finals across all the American leagues.
Either way, enjoy the playoff games and finals across all the American leagues.
November 14, 2025 at 4:24 PM
No Friday Stat Dump today due to family plans. I may produce one tomorrow.
Either way, enjoy the playoff games and finals across all the American leagues.
Either way, enjoy the playoff games and finals across all the American leagues.
Over in USL, Spokane Velocity lead Portland Hearts of Pine in the USL1 semi-final on — what else? — a long-throw set piece.
1-0 halftime in Spokane.
1-0 halftime in Spokane.
November 10, 2025 at 2:58 AM
Over in USL, Spokane Velocity lead Portland Hearts of Pine in the USL1 semi-final on — what else? — a long-throw set piece.
1-0 halftime in Spokane.
1-0 halftime in Spokane.
Amahl Pellegrino finding success with San Diego, particularly in the playoffs, warms my heart.
November 10, 2025 at 2:31 AM
Amahl Pellegrino finding success with San Diego, particularly in the playoffs, warms my heart.
That ball from Jordi Alba to Silvetti was a good example of a linebreaking pass from the outside. That’s what he does.
One more category for today: linebreaking passes. As I've previously shared on Friday Stat Dump, I use my own calculation based on event data which captures ~80% of them.
I'm putting this out because the retiring Jordi Alba and Sergio Busquets are at the top of the list. Happy retirement, guys.
6/
I'm putting this out because the retiring Jordi Alba and Sergio Busquets are at the top of the list. Happy retirement, guys.
6/

November 9, 2025 at 2:08 AM
That ball from Jordi Alba to Silvetti was a good example of a linebreaking pass from the outside. That’s what he does.
Everyone is aware we’ve got Cincinnati and Columbus Hell is Real Derby in the playoffs happening right now, correct?
My feed is all MNUFC/Seattle, Nashville/Miami, and the Next Pro final…
My feed is all MNUFC/Seattle, Nashville/Miami, and the Next Pro final…
November 9, 2025 at 12:12 AM
Everyone is aware we’ve got Cincinnati and Columbus Hell is Real Derby in the playoffs happening right now, correct?
My feed is all MNUFC/Seattle, Nashville/Miami, and the Next Pro final…
My feed is all MNUFC/Seattle, Nashville/Miami, and the Next Pro final…
Reposted by Jamon M - MLS and footy analysis

Would guess that was why MLS’s officials determined not to have Obed Vargas retake his attempt.

November 8, 2025 at 11:58 PM
Would guess that was why MLS’s officials determined not to have Obed Vargas retake his attempt.
The Sounders use of third-man runs and off-ball movement led directly to the first goal and to the corner that led to the second.
It’s completely baffled the Minnesota United back line and given the Sounders an early 2-0 lead.
It’s completely baffled the Minnesota United back line and given the Sounders an early 2-0 lead.
November 8, 2025 at 9:25 PM
The Sounders use of third-man runs and off-ball movement led directly to the first goal and to the corner that led to the second.
It’s completely baffled the Minnesota United back line and given the Sounders an early 2-0 lead.
It’s completely baffled the Minnesota United back line and given the Sounders an early 2-0 lead.
Questions come up when I use linebreaking passes. I'm not ready to share the methodology publicly yet, but I have validated the method visually with dozens of passes.
What I can share: the methodology takes ASA's definition of progressive passes (25% closer to the goal) and adds more logic.
1/
What I can share: the methodology takes ASA's definition of progressive passes (25% closer to the goal) and adds more logic.
1/
One more category for today: linebreaking passes. As I've previously shared on Friday Stat Dump, I use my own calculation based on event data which captures ~80% of them.
I'm putting this out because the retiring Jordi Alba and Sergio Busquets are at the top of the list. Happy retirement, guys.
6/
I'm putting this out because the retiring Jordi Alba and Sergio Busquets are at the top of the list. Happy retirement, guys.
6/
November 8, 2025 at 7:24 PM
Questions come up when I use linebreaking passes. I'm not ready to share the methodology publicly yet, but I have validated the method visually with dozens of passes.
What I can share: the methodology takes ASA's definition of progressive passes (25% closer to the goal) and adds more logic.
1/
What I can share: the methodology takes ASA's definition of progressive passes (25% closer to the goal) and adds more logic.
1/
Reposted by Jamon M - MLS and footy analysis

Now that everybody is caught up on long throws it's time to start talking about Dyche Zone free kicks
November 8, 2025 at 6:29 PM
Now that everybody is caught up on long throws it's time to start talking about Dyche Zone free kicks
Reposted by Jamon M - MLS and footy analysis

Reminder, Minoungou played 726 minutes. Everyone with at least four completed cutbacks had at least twice as many minutes. Rothrock and Kent both making the top 12 sorta illustrates what the Sounders try to do.
But I digress (it was worth a digression). My favorite pass in the right situations is the end-line cutback. Using the area beside the 6 yd box extended to the side of the 18 as a guideline, shots from cutbacks produce nearly the xG of shots from throughballs.
And we have a new Cutbacks King!
3/
And we have a new Cutbacks King!
3/

November 8, 2025 at 5:10 PM
Reminder, Minoungou played 726 minutes. Everyone with at least four completed cutbacks had at least twice as many minutes. Rothrock and Kent both making the top 12 sorta illustrates what the Sounders try to do.
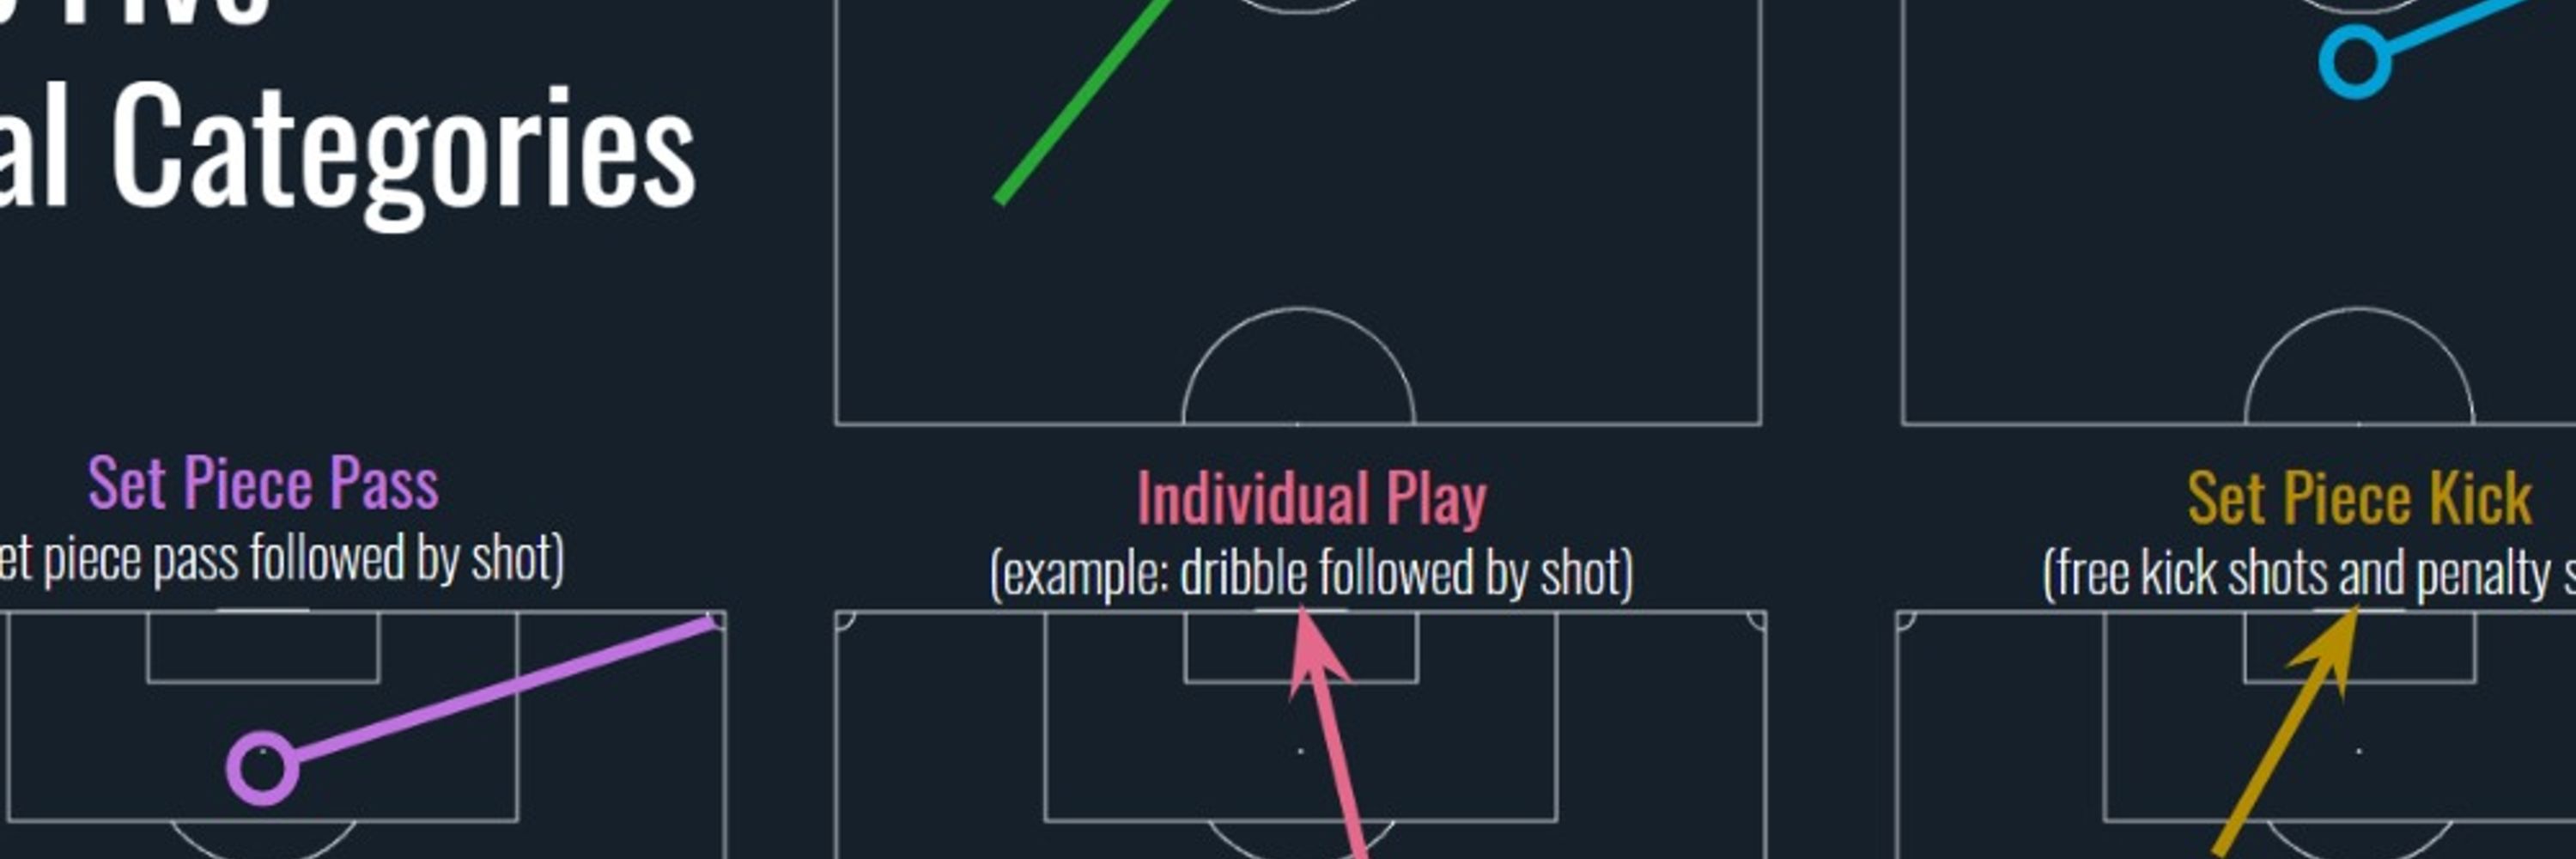
Friday Stat Dump on Saturday: MLS leaders of various pass types.
(New: I've enhanced my chart generation with players!)
I put no stock in pass completion % which includes passes with no pressure. So let's look at chance-creating pass types.
First, the top 25(+ ties) with throughballs!
1/
(lol)
(New: I've enhanced my chart generation with players!)
I put no stock in pass completion % which includes passes with no pressure. So let's look at chance-creating pass types.
First, the top 25(+ ties) with throughballs!
1/
(lol)

November 8, 2025 at 4:44 PM
Friday Stat Dump on Saturday: MLS leaders of various pass types.
(New: I've enhanced my chart generation with players!)
I put no stock in pass completion % which includes passes with no pressure. So let's look at chance-creating pass types.
First, the top 25(+ ties) with throughballs!
1/
(lol)
(New: I've enhanced my chart generation with players!)
I put no stock in pass completion % which includes passes with no pressure. So let's look at chance-creating pass types.
First, the top 25(+ ties) with throughballs!
1/
(lol)
Tomorrow: Something new comes to Friday Stat Dump 👀
(on Saturday, again, yes)
(on Saturday, again, yes)

November 8, 2025 at 3:38 AM
Tomorrow: Something new comes to Friday Stat Dump 👀
(on Saturday, again, yes)
(on Saturday, again, yes)
0.01 xG. lol.
Columbus Crew: 4 (3.33 xG)
vs
FC Cincinnati: 0 (0.01 xG)
#CLBvCIN | #Crew96 | #AllforCincy | #MLS | 🤖⚽
vs
FC Cincinnati: 0 (0.01 xG)
#CLBvCIN | #Crew96 | #AllforCincy | #MLS | 🤖⚽


November 3, 2025 at 2:59 AM
0.01 xG. lol.
Can’t recall an MLS team just handing a playoffs game they had won to an opponent as much as San Diego did tonight to the Timbers.
November 2, 2025 at 4:12 AM
Can’t recall an MLS team just handing a playoffs game they had won to an opponent as much as San Diego did tonight to the Timbers.
Friday Stat Dump: Big Chances
I've been told big chances are subjective. Meaning, the analyst coding the game identifies a "big scoring chance" from their perspective. Two analysts could disagree.
Here are the big chances by MLS team in the 2025 season:
1/
I've been told big chances are subjective. Meaning, the analyst coding the game identifies a "big scoring chance" from their perspective. Two analysts could disagree.
Here are the big chances by MLS team in the 2025 season:
1/

November 1, 2025 at 3:28 PM
Friday Stat Dump: Big Chances
I've been told big chances are subjective. Meaning, the analyst coding the game identifies a "big scoring chance" from their perspective. Two analysts could disagree.
Here are the big chances by MLS team in the 2025 season:
1/
I've been told big chances are subjective. Meaning, the analyst coding the game identifies a "big scoring chance" from their perspective. Two analysts could disagree.
Here are the big chances by MLS team in the 2025 season:
1/
I'm finishing up some code changes for this week's Friday Stat Dump, so rather than hope you read this on Halloween, I'll put it out tomorrow morning.
See you then.
See you then.
November 1, 2025 at 12:31 AM
I'm finishing up some code changes for this week's Friday Stat Dump, so rather than hope you read this on Halloween, I'll put it out tomorrow morning.
See you then.
See you then.