


T. from Data Rocks
@datarocksnz.bsky.social
Dataviz | Information Design
The person behind The Dataviz Bookshelf, The Data Design Manifesto & The Design Matters newsletter series.
I don't use autocorrect. I own all of my typos.
https://www.datarocks.co.nz
The person behind The Dataviz Bookshelf, The Data Design Manifesto & The Design Matters newsletter series.
I don't use autocorrect. I own all of my typos.
https://www.datarocks.co.nz
Reposted by T. from Data Rocks

Here's a little round up of my 2025 year in #DataViz featuring
💜 Some of my favourite #RStats charts
💜 A look back at 5 years of #TidyTuesday
💜 Links to cool #QuartoPub and visualisation things I've seen this year
Link: nrennie.rbind.io/blog/year-in...
💜 Some of my favourite #RStats charts
💜 A look back at 5 years of #TidyTuesday
💜 Links to cool #QuartoPub and visualisation things I've seen this year
Link: nrennie.rbind.io/blog/year-in...

My year in data visualisation – Nicola Rennie
A round up of my projects this year, highlighting some of my favourite charts from 2025, and looking back on five years of TidyTuesday contributions.
nrennie.rbind.io
December 10, 2025 at 1:41 PM
Here's a little round up of my 2025 year in #DataViz featuring
💜 Some of my favourite #RStats charts
💜 A look back at 5 years of #TidyTuesday
💜 Links to cool #QuartoPub and visualisation things I've seen this year
Link: nrennie.rbind.io/blog/year-in...
💜 Some of my favourite #RStats charts
💜 A look back at 5 years of #TidyTuesday
💜 Links to cool #QuartoPub and visualisation things I've seen this year
Link: nrennie.rbind.io/blog/year-in...
Reposted by T. from Data Rocks

Come join me, @abmakulec.bsky.social, @acotgreave.bsky.social, and Jeffrey Shaffer as we explore some of the highlights (and lowlights) of data visualization in 2025.
Like the BBC News, our goal is to inform, educate, and entertain.
(But without any scandals).
buytickets.at/datarevelati...
Like the BBC News, our goal is to inform, educate, and entertain.
(But without any scandals).
buytickets.at/datarevelati...

December 4, 2025 at 6:25 PM
Come join me, @abmakulec.bsky.social, @acotgreave.bsky.social, and Jeffrey Shaffer as we explore some of the highlights (and lowlights) of data visualization in 2025.
Like the BBC News, our goal is to inform, educate, and entertain.
(But without any scandals).
buytickets.at/datarevelati...
Like the BBC News, our goal is to inform, educate, and entertain.
(But without any scandals).
buytickets.at/datarevelati...
Reposted by T. from Data Rocks
You can now get LIFETIME access to my *updated* Visualizing Survey Data Using Tableau On-Demand course.
Learn more at bigpic.me/course
#surveydata
Learn more at bigpic.me/course
#surveydata
December 4, 2025 at 6:31 PM
You can now get LIFETIME access to my *updated* Visualizing Survey Data Using Tableau On-Demand course.
Learn more at bigpic.me/course
#surveydata
Learn more at bigpic.me/course
#surveydata
Good stuff

Some closing thoughts for my students this semester on LLMs and learning #rstats datavizf25.classes.andrewheiss.com/news/2025-12...


December 10, 2025 at 12:05 AM
Good stuff
🎄
December 3, 2025 at 11:06 PM
🎄
Reposted by T. from Data Rocks

This is an account that warrants more following: @tksajeev.bsky.social through the website Newspaper Design has been publishing some really nice interviews/articles with graphics professionals around the world
November 28, 2025 at 8:59 AM
This is an account that warrants more following: @tksajeev.bsky.social through the website Newspaper Design has been publishing some really nice interviews/articles with graphics professionals around the world
Reposted by T. from Data Rocks

Happy Thanksgiving! New pod episode: Launching the Trans News Initiative creators.spotify.com/pod/profile/... with @petrinkae.bsky.social & @puddingviz.bsky.social
The project: transnewsinitiative.org
#dataViz #dataJournalism #dataVisualization
The project: transnewsinitiative.org
#dataViz #dataJournalism #dataVisualization
Launching the Trans News Initiative by The Data Journalism Podcast
The Trans News Initiative is a new project that tracks and analyzes news coverage of trans communities in the U.S. Our very own Alberto Cairo helped create it, and this week we're joined by three othe...
creators.spotify.com
November 27, 2025 at 3:37 PM
Happy Thanksgiving! New pod episode: Launching the Trans News Initiative creators.spotify.com/pod/profile/... with @petrinkae.bsky.social & @puddingviz.bsky.social
The project: transnewsinitiative.org
#dataViz #dataJournalism #dataVisualization
The project: transnewsinitiative.org
#dataViz #dataJournalism #dataVisualization
Reposted by T. from Data Rocks

I think we could all use a little bit more data in our lives. So, I launched Not-Ship: a newsletter that uses data to understand our messy world.
If you agree, help me keep this going for as long as we can. 💙
First step: Sign up to get it in your inbox each week #dataviz
www.not-ship.com
If you agree, help me keep this going for as long as we can. 💙
First step: Sign up to get it in your inbox each week #dataviz
www.not-ship.com

Not-Ship
A newsletter charting the age of uncertainty
www.not-ship.com
November 26, 2025 at 11:59 AM
I think we could all use a little bit more data in our lives. So, I launched Not-Ship: a newsletter that uses data to understand our messy world.
If you agree, help me keep this going for as long as we can. 💙
First step: Sign up to get it in your inbox each week #dataviz
www.not-ship.com
If you agree, help me keep this going for as long as we can. 💙
First step: Sign up to get it in your inbox each week #dataviz
www.not-ship.com
Reposted by T. from Data Rocks
In the newsletter: Friends of the Open Visualization Academy, first episode of a new series, a conversation with Nina Krug: openvisualizationacademy.beehiiv.com/p/friends-of... #dataViz #dataJournalism #dataVisualization

Friends of the Open Visualization Academy: Nina Krug
A new series of video conversations with data designers, artists, and journalists
openvisualizationacademy.beehiiv.com
November 20, 2025 at 1:30 PM
In the newsletter: Friends of the Open Visualization Academy, first episode of a new series, a conversation with Nina Krug: openvisualizationacademy.beehiiv.com/p/friends-of... #dataViz #dataJournalism #dataVisualization
Reposted by T. from Data Rocks

If you use GMail, AI (Gemini) was turned on yesterday by default and now scans all of your content for machine learning. To turn off, go to Settings>General and scroll down. Uncheck the box for "Smart features."
There's other "Smart" add-ons as well, but that's the one that reads your content.
There's other "Smart" add-ons as well, but that's the one that reads your content.
November 20, 2025 at 5:32 PM
If you use GMail, AI (Gemini) was turned on yesterday by default and now scans all of your content for machine learning. To turn off, go to Settings>General and scroll down. Uncheck the box for "Smart features."
There's other "Smart" add-ons as well, but that's the one that reads your content.
There's other "Smart" add-ons as well, but that's the one that reads your content.
Painfully accurate
November 20, 2025 at 9:09 PM
Painfully accurate
Reposted by T. from Data Rocks

I just want to tell you that a good pie is better than a... less good Sankey. #datavis
www.wisevis.eu/uma-pergunta...
www.wisevis.eu/uma-pergunta...

Uma pergunta com barbas
A pergunta "qual o gráfico mais adequado para representar x?" é a pergunta que mais me fazem nos cursos de visualização de dados, e aquela de mais fácil e de mais difícil resposta.
www.wisevis.eu
November 17, 2025 at 4:55 PM
I just want to tell you that a good pie is better than a... less good Sankey. #datavis
www.wisevis.eu/uma-pergunta...
www.wisevis.eu/uma-pergunta...
One of the most beautiful pieces of work I have ever seen!


November 5, 2025 at 6:44 AM
One of the most beautiful pieces of work I have ever seen!
Silly thing, but I'm very happy with my new socks.

November 4, 2025 at 7:50 PM
Silly thing, but I'm very happy with my new socks.
Linux is pretty good, actually.
Also, big opportunity for companies to start making their official Linux versions of popular software, if they don't have it already.
Also, big opportunity for companies to start making their official Linux versions of popular software, if they don't have it already.
October 16, 2025 at 5:34 PM
Linux is pretty good, actually.
Also, big opportunity for companies to start making their official Linux versions of popular software, if they don't have it already.
Also, big opportunity for companies to start making their official Linux versions of popular software, if they don't have it already.
Reposted by T. from Data Rocks
Refiz estas pirâmides etárias dando-lhes alguma interatividade e explorando outra paleta de cores. Experimentem brincar com os países e os anos, é giro. #datavis
www.wisevis.eu/piramides-et...
www.wisevis.eu/piramides-et...

Pirâmides etárias 1950-2100
Pirâmides etárias interativas onde pode observar a evolução demográfica dos países numa forma eficaz e esteticamente apelativa.
www.wisevis.eu
October 15, 2025 at 1:25 PM
Refiz estas pirâmides etárias dando-lhes alguma interatividade e explorando outra paleta de cores. Experimentem brincar com os países e os anos, é giro. #datavis
www.wisevis.eu/piramides-et...
www.wisevis.eu/piramides-et...
Reposted by T. from Data Rocks

The Australian Bureau of Statistics is to be commended for their bad statistic jokes. Well done!


October 14, 2025 at 1:19 AM
The Australian Bureau of Statistics is to be commended for their bad statistic jokes. Well done!
Reposted by T. from Data Rocks

Alright, here we go, this should hopefully capture what I'm looking to do and how I'm planning to go about it.
annaecook.com/writing/2025...
annaecook.com/writing/2025...
October 13, 2025 at 6:14 PM
Alright, here we go, this should hopefully capture what I'm looking to do and how I'm planning to go about it.
annaecook.com/writing/2025...
annaecook.com/writing/2025...
😍

This dataviz love letter by Giorgia Lupi and @pentagramdesign.bsky.social using open data from NY transport and "assigning behaviors, movements, and idiosyncrasies to each MTA train" has just brightened my day
www.pentagram.com/work/a-data-...
Animation
www.instagram.com/reel/DPkAziW...
www.pentagram.com/work/a-data-...
Animation
www.instagram.com/reel/DPkAziW...

‘A Data Love Letter to the Subway’
A data-driven animation for Fulton Center commissioned by MTA Arts & Design for its 40th anniversary.
www.pentagram.com
October 11, 2025 at 6:57 AM
😍

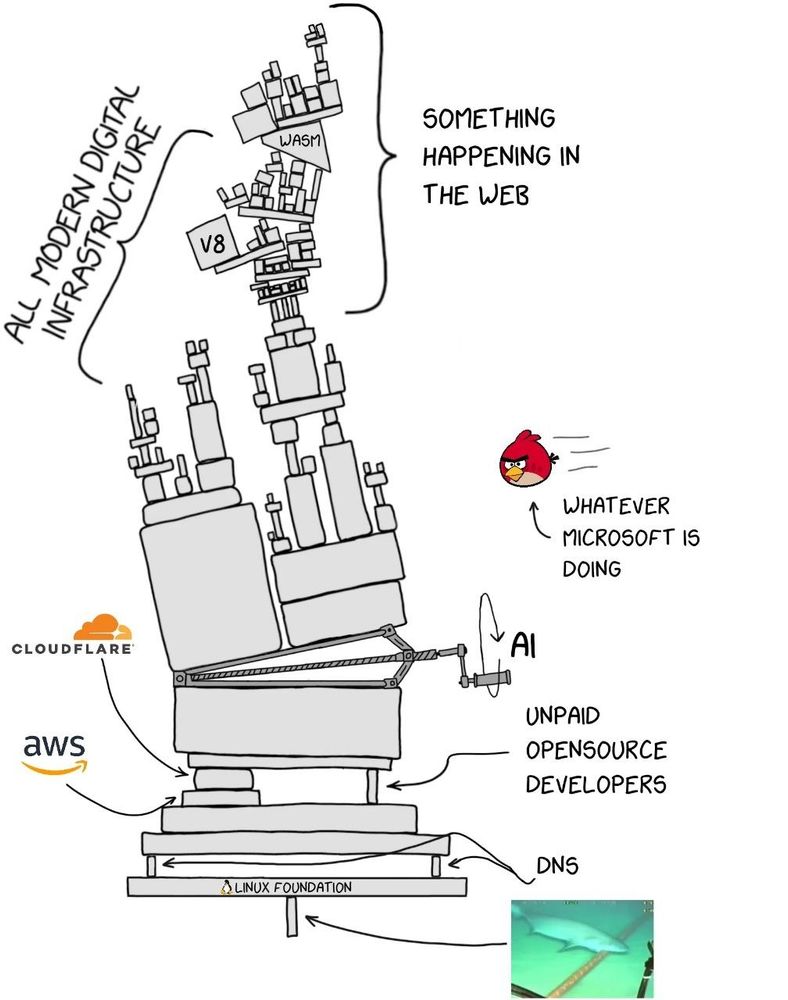
Brilliant.
This, alongside the webdesign one, will probably be my most forwarded Oatmeal links forever.
This, alongside the webdesign one, will probably be my most forwarded Oatmeal links forever.

October 7, 2025 at 7:00 PM
Brilliant.
This, alongside the webdesign one, will probably be my most forwarded Oatmeal links forever.
This, alongside the webdesign one, will probably be my most forwarded Oatmeal links forever.
6 years ago, I decided that I could probably make a living out of this #dataviz design thing. And it worked!
Thanks to everyone who's been part of this journey so far! 💜
Thanks to everyone who's been part of this journey so far! 💜

October 4, 2025 at 10:07 AM
6 years ago, I decided that I could probably make a living out of this #dataviz design thing. And it worked!
Thanks to everyone who's been part of this journey so far! 💜
Thanks to everyone who's been part of this journey so far! 💜
Reposted by T. from Data Rocks

Week in Review:
Comment from Auckland University: Students starting to learn with AI is the difference between using a calculator after understanding math versus never learning math because calculators exist.
Comment from Auckland University: Students starting to learn with AI is the difference between using a calculator after understanding math versus never learning math because calculators exist.

When students' brains go quiet
newsroom.co.nz
October 4, 2025 at 4:02 AM
Week in Review:
Comment from Auckland University: Students starting to learn with AI is the difference between using a calculator after understanding math versus never learning math because calculators exist.
Comment from Auckland University: Students starting to learn with AI is the difference between using a calculator after understanding math versus never learning math because calculators exist.
Reposted by T. from Data Rocks
PT: Novo artigo: sobre a criatividade em visualização de dados para, hum... não criativos.
EN: New post (in Portuguese): on creativity in #datavis for, hum... non-creative people.
www.wisevis.eu/criatividade...
EN: New post (in Portuguese): on creativity in #datavis for, hum... non-creative people.
www.wisevis.eu/criatividade...

Sobre a criatividade em visualização de dados
Onde se argumenta que a criatividade em visualização de dados não se resume a um resultado estético.
www.wisevis.eu
September 29, 2025 at 9:30 AM
PT: Novo artigo: sobre a criatividade em visualização de dados para, hum... não criativos.
EN: New post (in Portuguese): on creativity in #datavis for, hum... non-creative people.
www.wisevis.eu/criatividade...
EN: New post (in Portuguese): on creativity in #datavis for, hum... non-creative people.
www.wisevis.eu/criatividade...
I pre-launched a #datavis course in Portuguese (pt-pt), covering from curiosity to how-bad-bar-charts-are, and beyond. I'm not aware of more online #datavis courses here, not sure if there is no offer or no demand. If you understand Portuguese, please take a look.
www.wisevis.eu/curso-visual...
www.wisevis.eu/curso-visual...

[Curso] Visualização de Dados
Curso de Visualização de Dados
Bem vindo ao curso de Visualização de Dados da Wisevis. Este curso é destinado a todos os que querem explorar, analisar, e comunicar com dados de forma visual.
Ao...
www.wisevis.eu
September 26, 2025 at 7:03 PM