


Zack Labe
@zacklabe.com
Climate Scientist at @climatecentral.org | PhD | Passionate about improving science communication through data-driven stories | Harrisburg, PA | https://zacklabe.com/
Views, thoughts, and opinions expressed here are only my own.
Views, thoughts, and opinions expressed here are only my own.
Greenhouse gas data is finally rolling in again, and my dashboard is back up-to-date. Unfortunately, the story hasn’t changed... 📈
More climate change indicator graphics at zacklabe.com/climate-chan...
More climate change indicator graphics at zacklabe.com/climate-chan...

November 16, 2025 at 2:10 AM
Greenhouse gas data is finally rolling in again, and my dashboard is back up-to-date. Unfortunately, the story hasn’t changed... 📈
More climate change indicator graphics at zacklabe.com/climate-chan...
More climate change indicator graphics at zacklabe.com/climate-chan...
Temperatures have warmed across the contiguous United States over the last five decades or so during the months of December through February (a rapidly warming season)...
Check out @climatecentral.org's winter package for more information and graphics: www.climatecentral.org/climate-matt... ❄️🥵
Check out @climatecentral.org's winter package for more information and graphics: www.climatecentral.org/climate-matt... ❄️🥵

November 15, 2025 at 5:41 PM
Temperatures have warmed across the contiguous United States over the last five decades or so during the months of December through February (a rapidly warming season)...
Check out @climatecentral.org's winter package for more information and graphics: www.climatecentral.org/climate-matt... ❄️🥵
Check out @climatecentral.org's winter package for more information and graphics: www.climatecentral.org/climate-matt... ❄️🥵
Another dataset confirms that last month was the warmest October on record in the #Arctic. The previous record was 2024. This is already a month with a very large increasing temperature trend (i.e., Arctic amplification). Not good.
Data from NASA/GISS GISTEMPv4 (data.giss.nasa.gov/gistemp/).
Data from NASA/GISS GISTEMPv4 (data.giss.nasa.gov/gistemp/).
November 15, 2025 at 4:15 PM
Another dataset confirms that last month was the warmest October on record in the #Arctic. The previous record was 2024. This is already a month with a very large increasing temperature trend (i.e., Arctic amplification). Not good.
Data from NASA/GISS GISTEMPv4 (data.giss.nasa.gov/gistemp/).
Data from NASA/GISS GISTEMPv4 (data.giss.nasa.gov/gistemp/).
Trends in November #Arctic sea ice thickness over the last four decades. Unsurprisingly, ice is thinning across the entire Arctic Ocean.
Simulated data from PIOMAS. For more information: doi.org/10.1175/JCLI...
Simulated data from PIOMAS. For more information: doi.org/10.1175/JCLI...

November 15, 2025 at 2:31 PM
Trends in November #Arctic sea ice thickness over the last four decades. Unsurprisingly, ice is thinning across the entire Arctic Ocean.
Simulated data from PIOMAS. For more information: doi.org/10.1175/JCLI...
Simulated data from PIOMAS. For more information: doi.org/10.1175/JCLI...
And now average temperature departures by month in the #Arctic since the year 1940.
Data from @copernicusecmwf.bsky.social ERA5 reanalysis. More views at zacklabe.com/arctic-tempe....
Data from @copernicusecmwf.bsky.social ERA5 reanalysis. More views at zacklabe.com/arctic-tempe....

November 15, 2025 at 1:41 AM
And now average temperature departures by month in the #Arctic since the year 1940.
Data from @copernicusecmwf.bsky.social ERA5 reanalysis. More views at zacklabe.com/arctic-tempe....
Data from @copernicusecmwf.bsky.social ERA5 reanalysis. More views at zacklabe.com/arctic-tempe....
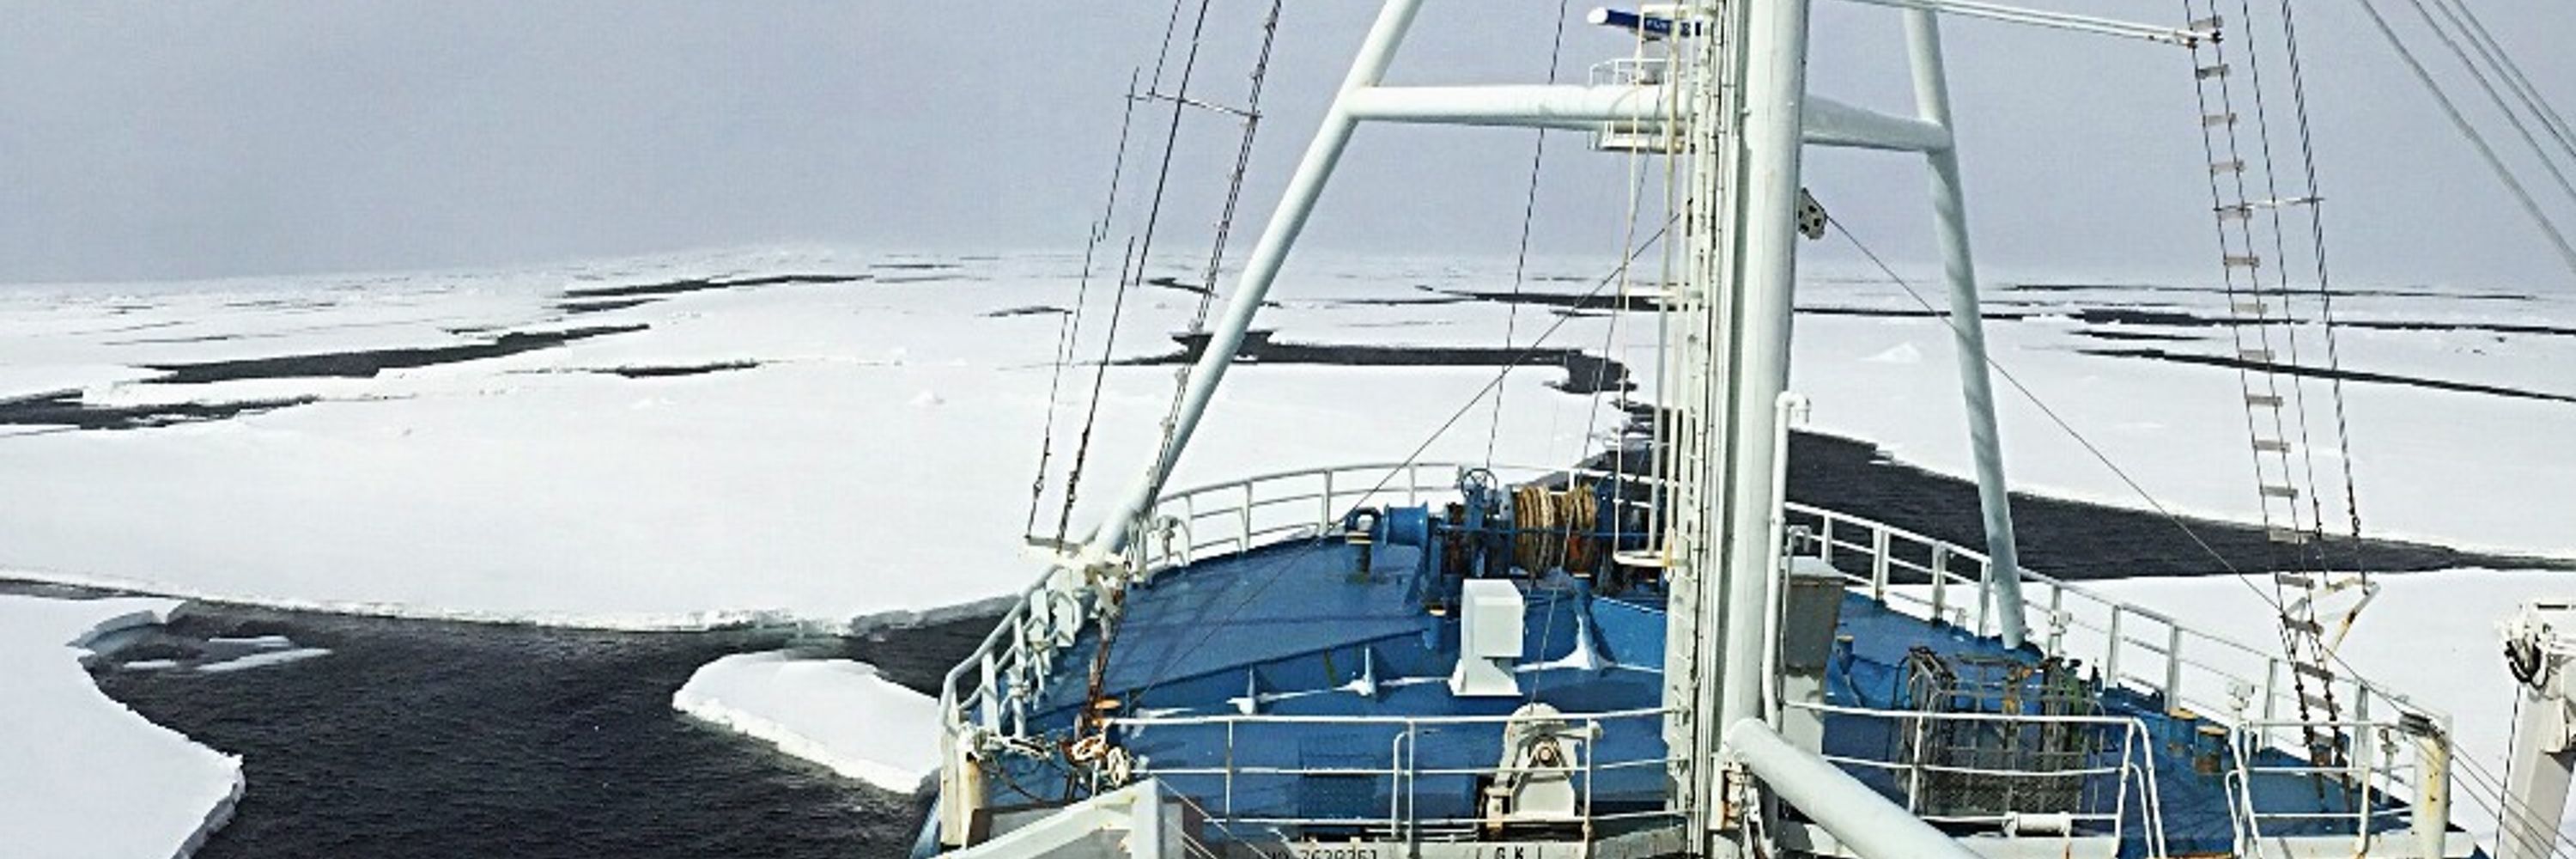
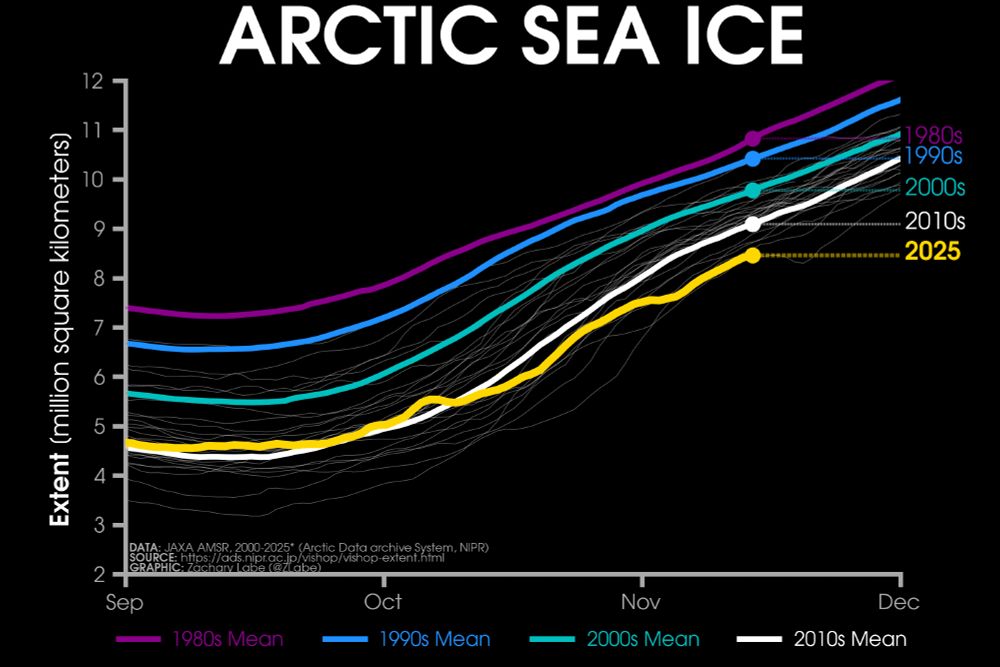
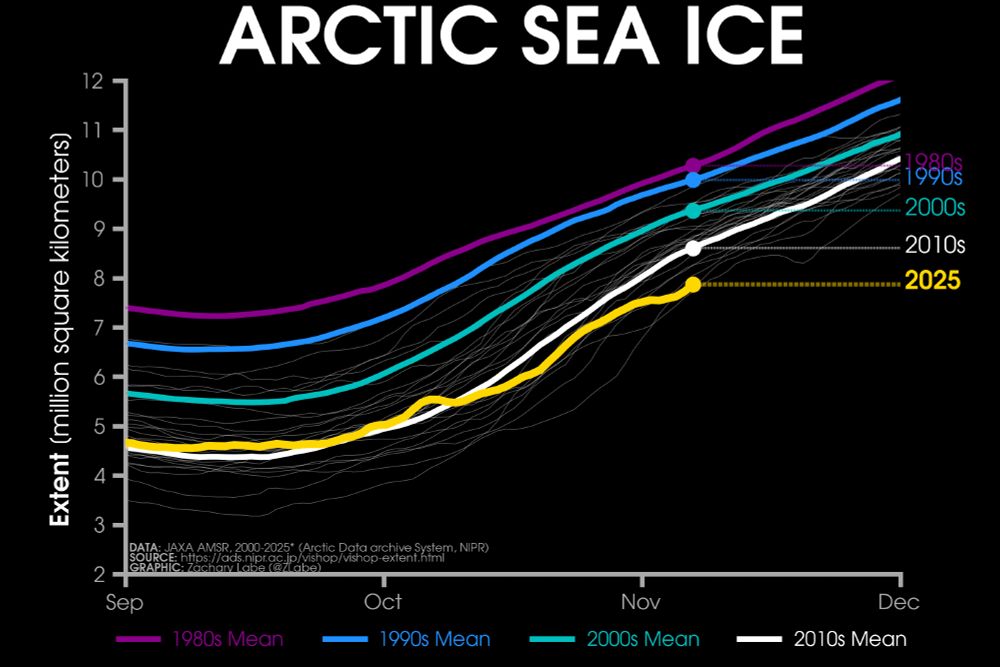
Friday ice update - #Arctic sea ice extent is currently the *2nd* lowest on record (JAXA data)
• about 630,000 km² below the 2010s mean
• about 1,320,000 km² below the 2000s mean
• about 1,960,000 km² below the 1990s mean
• about 2,370,000 km² below the 1980s mean
More zacklabe.com/arctic-sea-i...
• about 630,000 km² below the 2010s mean
• about 1,320,000 km² below the 2000s mean
• about 1,960,000 km² below the 1990s mean
• about 2,370,000 km² below the 1980s mean
More zacklabe.com/arctic-sea-i...
November 14, 2025 at 1:06 PM
Friday ice update - #Arctic sea ice extent is currently the *2nd* lowest on record (JAXA data)
• about 630,000 km² below the 2010s mean
• about 1,320,000 km² below the 2000s mean
• about 1,960,000 km² below the 1990s mean
• about 2,370,000 km² below the 1980s mean
More zacklabe.com/arctic-sea-i...
• about 630,000 km² below the 2010s mean
• about 1,320,000 km² below the 2000s mean
• about 1,960,000 km² below the 1990s mean
• about 2,370,000 km² below the 1980s mean
More zacklabe.com/arctic-sea-i...
The disappearance of thicker #Arctic sea ice by decade in November...
More info on this data: climatedataguide.ucar.edu/climate-data...
More info on this data: climatedataguide.ucar.edu/climate-data...

November 14, 2025 at 12:14 PM
The disappearance of thicker #Arctic sea ice by decade in November...
More info on this data: climatedataguide.ucar.edu/climate-data...
More info on this data: climatedataguide.ucar.edu/climate-data...
Temperature anomalies over the last month (left), 3 months (center), and 12 months (right) across the Southern Hemisphere. Red areas denote warmer than average temperatures and blue areas colder than average.
Data from @copernicusecmwf.bsky.social ERA5 reanalysis.
Data from @copernicusecmwf.bsky.social ERA5 reanalysis.

November 13, 2025 at 10:35 PM
Temperature anomalies over the last month (left), 3 months (center), and 12 months (right) across the Southern Hemisphere. Red areas denote warmer than average temperatures and blue areas colder than average.
Data from @copernicusecmwf.bsky.social ERA5 reanalysis.
Data from @copernicusecmwf.bsky.social ERA5 reanalysis.
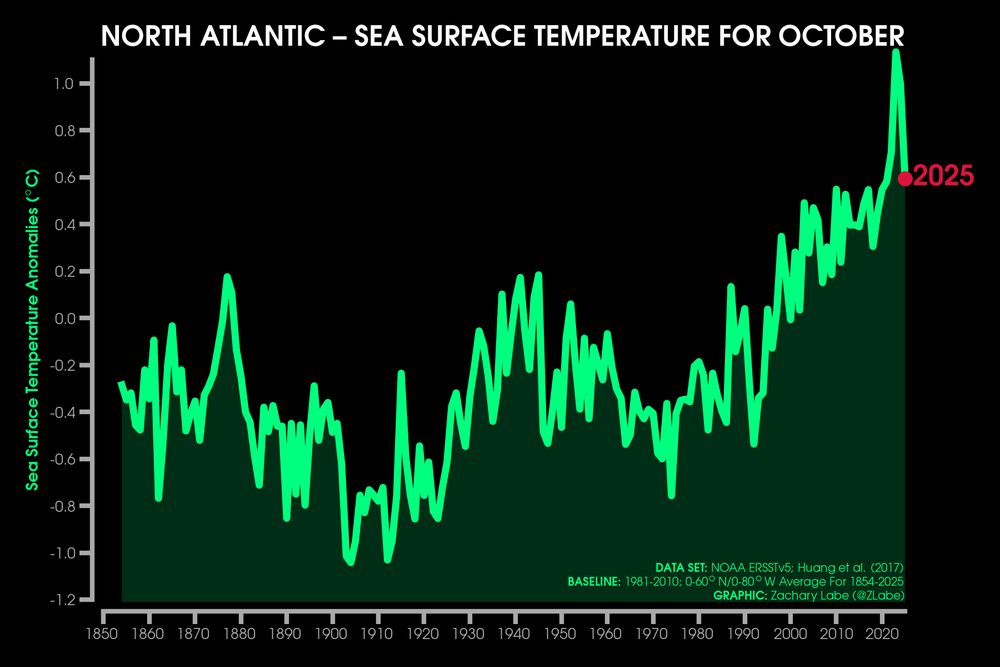
While still warmer than any other years since the mid-1800s, sea surface temperatures in the northern half of the Atlantic Ocean remain well below their recent peak (i.e., climate change and climate variability).
Graphic using NOAA ERSSTv5 data (www.ncei.noaa.gov/products/ext...).
Graphic using NOAA ERSSTv5 data (www.ncei.noaa.gov/products/ext...).
November 12, 2025 at 12:57 PM
While still warmer than any other years since the mid-1800s, sea surface temperatures in the northern half of the Atlantic Ocean remain well below their recent peak (i.e., climate change and climate variability).
Graphic using NOAA ERSSTv5 data (www.ncei.noaa.gov/products/ext...).
Graphic using NOAA ERSSTv5 data (www.ncei.noaa.gov/products/ext...).
Average temperature departures by month in the #Antarctic since the year 1940.
Data from @copernicusecmwf.bsky.social ERA5 reanalysis.
Data from @copernicusecmwf.bsky.social ERA5 reanalysis.

November 11, 2025 at 11:57 PM
Average temperature departures by month in the #Antarctic since the year 1940.
Data from @copernicusecmwf.bsky.social ERA5 reanalysis.
Data from @copernicusecmwf.bsky.social ERA5 reanalysis.
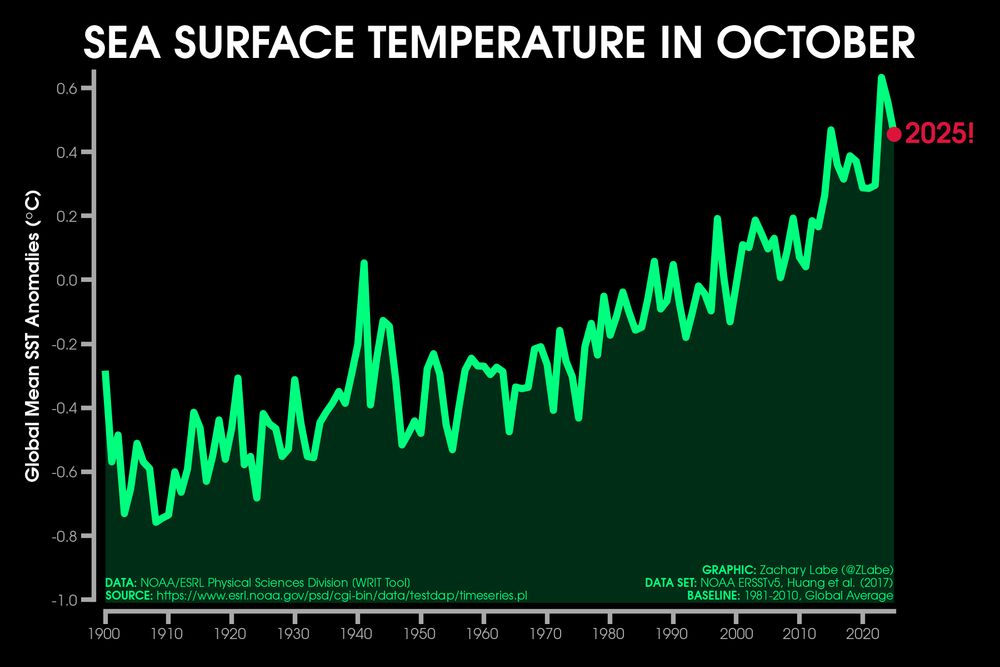
Last month was the 4th warmest October on record for the average global sea surface temperature... 🌊
Graphic using NOAA ERSSTv5 data. Methods described in doi.org/10.1175/JCLI....
Graphic using NOAA ERSSTv5 data. Methods described in doi.org/10.1175/JCLI....
November 11, 2025 at 2:31 PM
Last month was the 4th warmest October on record for the average global sea surface temperature... 🌊
Graphic using NOAA ERSSTv5 data. Methods described in doi.org/10.1175/JCLI....
Graphic using NOAA ERSSTv5 data. Methods described in doi.org/10.1175/JCLI....
Impossible to ignore what’s happening to #Arctic temperatures in the month of November...
Data from @copernicusecmwf.bsky.social ERA5 reanalysis.
Data from @copernicusecmwf.bsky.social ERA5 reanalysis.

November 11, 2025 at 12:10 AM
Impossible to ignore what’s happening to #Arctic temperatures in the month of November...
Data from @copernicusecmwf.bsky.social ERA5 reanalysis.
Data from @copernicusecmwf.bsky.social ERA5 reanalysis.
Here is a map view of the record high temperatures in October 2025 across the #Antarctic. Compare this blob of anomalies greater than 5°C with the Arctic from my earlier post. Yikes!
Data from doi.org/10.24381/cds... using a 1981-2010 reference period.
Data from doi.org/10.24381/cds... using a 1981-2010 reference period.

November 10, 2025 at 5:56 PM
Here is a map view of the record high temperatures in October 2025 across the #Antarctic. Compare this blob of anomalies greater than 5°C with the Arctic from my earlier post. Yikes!
Data from doi.org/10.24381/cds... using a 1981-2010 reference period.
Data from doi.org/10.24381/cds... using a 1981-2010 reference period.
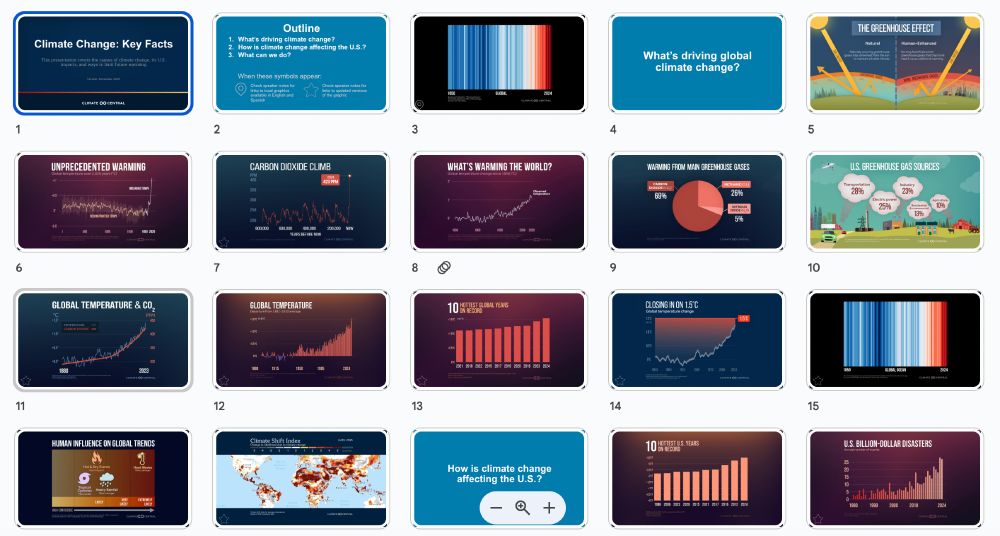
📣 We just released a new free resource at @climatecentral.org - a 72-slide deck introducing key facts about climate change, including its causes, impacts, and solutions. It also comes with speaker notes and links for local storytelling.
➡️ www.climatecentral.org/climate-matt... (English & Spanish)
➡️ www.climatecentral.org/climate-matt... (English & Spanish)
November 10, 2025 at 12:52 PM
📣 We just released a new free resource at @climatecentral.org - a 72-slide deck introducing key facts about climate change, including its causes, impacts, and solutions. It also comes with speaker notes and links for local storytelling.
➡️ www.climatecentral.org/climate-matt... (English & Spanish)
➡️ www.climatecentral.org/climate-matt... (English & Spanish)
Record high ocean temperatures continued across the North Pacific in October 2025, with recent warming really amplifying since the early 2000s.
This graph shows the average for a band across the midlatitudes for every October from 1854-2025 using
NOAA ERSSTv5 data (psl.noaa.gov/data/gridded...).
This graph shows the average for a band across the midlatitudes for every October from 1854-2025 using
NOAA ERSSTv5 data (psl.noaa.gov/data/gridded...).

November 9, 2025 at 5:43 PM
Record high ocean temperatures continued across the North Pacific in October 2025, with recent warming really amplifying since the early 2000s.
This graph shows the average for a band across the midlatitudes for every October from 1854-2025 using
NOAA ERSSTv5 data (psl.noaa.gov/data/gridded...).
This graph shows the average for a band across the midlatitudes for every October from 1854-2025 using
NOAA ERSSTv5 data (psl.noaa.gov/data/gridded...).
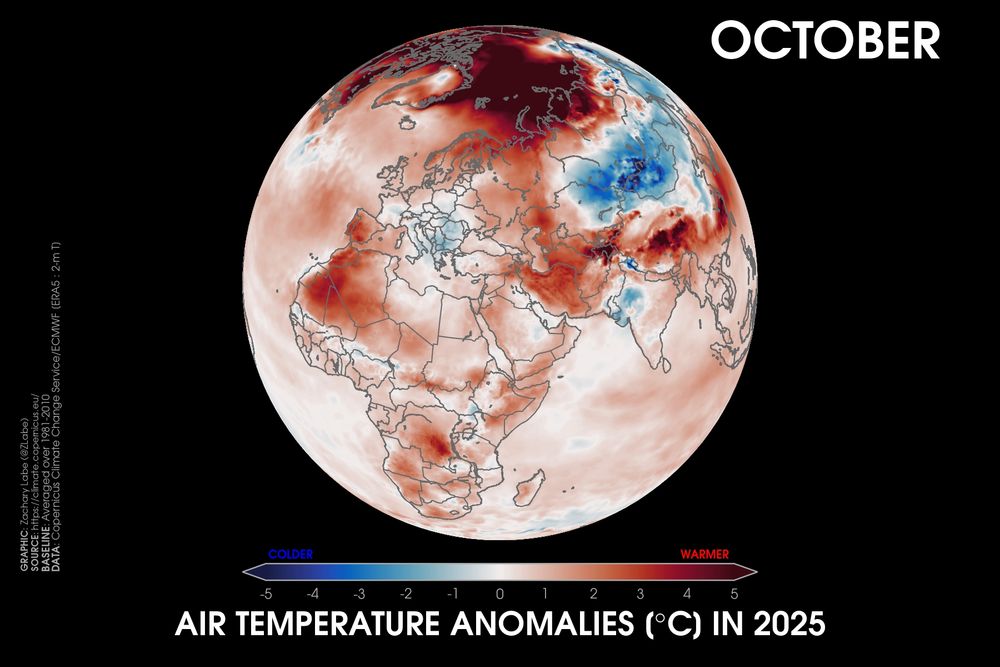
Here's a look at the extent of the "warmth" across the #Arctic in October. This map uses my normal anomaly scaling for each month, but it clearly doesn't work for something this extreme.
Data from doi.org/10.24381/cds...
Data from doi.org/10.24381/cds...

November 9, 2025 at 2:04 PM
Here's a look at the extent of the "warmth" across the #Arctic in October. This map uses my normal anomaly scaling for each month, but it clearly doesn't work for something this extreme.
Data from doi.org/10.24381/cds...
Data from doi.org/10.24381/cds...
October 2025 was the 3rd warmest October on record for our planet, following 2023 (1st place) and 2024 (2nd place). This month was about 1.55°C above the 1850-1900 pre-industrial average. The last 12-months have been about 1.50°C above it.
Summary of month: climate.copernicus.eu/surface-air-... 🛠️🧪🌊
Summary of month: climate.copernicus.eu/surface-air-... 🛠️🧪🌊


November 8, 2025 at 10:31 PM
October 2025 was the 3rd warmest October on record for our planet, following 2023 (1st place) and 2024 (2nd place). This month was about 1.55°C above the 1850-1900 pre-industrial average. The last 12-months have been about 1.50°C above it.
Summary of month: climate.copernicus.eu/surface-air-... 🛠️🧪🌊
Summary of month: climate.copernicus.eu/surface-air-... 🛠️🧪🌊
It's not every day that both poles set new monthly temperature records (see my earlier post). Last month also observed the warmest October on record for the #Arctic Circle. Not great!!
Data provided by doi.org/10.24381/cds....
Data provided by doi.org/10.24381/cds....

November 8, 2025 at 2:07 PM
It's not every day that both poles set new monthly temperature records (see my earlier post). Last month also observed the warmest October on record for the #Arctic Circle. Not great!!
Data provided by doi.org/10.24381/cds....
Data provided by doi.org/10.24381/cds....
The @wmo-global.bsky.social provisional report on the State of the Global Climate in 2025 was released: wmo.int/publication-...
"Other climate indicators continue to sound alarm
bells, and more extreme weather had major global impacts on
economies and all aspects of sustainable development." #COP30
"Other climate indicators continue to sound alarm
bells, and more extreme weather had major global impacts on
economies and all aspects of sustainable development." #COP30

November 7, 2025 at 8:13 PM
The @wmo-global.bsky.social provisional report on the State of the Global Climate in 2025 was released: wmo.int/publication-...
"Other climate indicators continue to sound alarm
bells, and more extreme weather had major global impacts on
economies and all aspects of sustainable development." #COP30
"Other climate indicators continue to sound alarm
bells, and more extreme weather had major global impacts on
economies and all aspects of sustainable development." #COP30
🚨 Last month observed the highest average temperature for the month of October across the #Antarctic Circle, with clearly 2025 well above any prior year in the satellite era.
Data from doi.org/10.24381/cds...
Data from doi.org/10.24381/cds...

November 7, 2025 at 5:40 PM
🚨 Last month observed the highest average temperature for the month of October across the #Antarctic Circle, with clearly 2025 well above any prior year in the satellite era.
Data from doi.org/10.24381/cds...
Data from doi.org/10.24381/cds...
Friday ice update - #Arctic sea ice extent is currently the 3rd lowest on record (JAXA data)
• about 740,000 km² below the 2010s mean
• about 1,500,000 km² below the 2000s mean
• about 2,120,000 km² below the 1990s mean
• about 2,400,000 km² below the 1980s mean
More: zacklabe.com/arctic-sea-i...
• about 740,000 km² below the 2010s mean
• about 1,500,000 km² below the 2000s mean
• about 2,120,000 km² below the 1990s mean
• about 2,400,000 km² below the 1980s mean
More: zacklabe.com/arctic-sea-i...
November 7, 2025 at 1:55 PM
Friday ice update - #Arctic sea ice extent is currently the 3rd lowest on record (JAXA data)
• about 740,000 km² below the 2010s mean
• about 1,500,000 km² below the 2000s mean
• about 2,120,000 km² below the 1990s mean
• about 2,400,000 km² below the 1980s mean
More: zacklabe.com/arctic-sea-i...
• about 740,000 km² below the 2010s mean
• about 1,500,000 km² below the 2000s mean
• about 2,120,000 km² below the 1990s mean
• about 2,400,000 km² below the 1980s mean
More: zacklabe.com/arctic-sea-i...
Patterns of November temperatures in the #Antarctic when averaged by decade... There is a warming trend.
Data from @copernicusecmwf.bsky.social ERA5 reanalysis.
Data from @copernicusecmwf.bsky.social ERA5 reanalysis.

November 7, 2025 at 12:28 PM
Patterns of November temperatures in the #Antarctic when averaged by decade... There is a warming trend.
Data from @copernicusecmwf.bsky.social ERA5 reanalysis.
Data from @copernicusecmwf.bsky.social ERA5 reanalysis.
Not every month will set a new record, but the warming trend is obvious. This graphic shows #Arctic air temperature rank by month over the satellite era - now updated through October 2025... 🧪
+ Ranks: 1=warmest (red), 46/47=coldest (blue)
+ Download higher resolution: zacklabe.com/arctic-tempe...
+ Ranks: 1=warmest (red), 46/47=coldest (blue)
+ Download higher resolution: zacklabe.com/arctic-tempe...

November 6, 2025 at 8:59 PM
Not every month will set a new record, but the warming trend is obvious. This graphic shows #Arctic air temperature rank by month over the satellite era - now updated through October 2025... 🧪
+ Ranks: 1=warmest (red), 46/47=coldest (blue)
+ Download higher resolution: zacklabe.com/arctic-tempe...
+ Ranks: 1=warmest (red), 46/47=coldest (blue)
+ Download higher resolution: zacklabe.com/arctic-tempe...
Reconstructing October #Arctic sea ice extent since 1850...
Data from @nsidc.bsky.social at doi.org/10.7265/jj4s...
Data from @nsidc.bsky.social at doi.org/10.7265/jj4s...

November 6, 2025 at 12:20 PM
Reconstructing October #Arctic sea ice extent since 1850...
Data from @nsidc.bsky.social at doi.org/10.7265/jj4s...
Data from @nsidc.bsky.social at doi.org/10.7265/jj4s...
Trends in November temperatures over land areas (where we live) for the last 50 years... 🔥
Data from NOAAGlobalTempv6.0.0. (www.ncei.noaa.gov/products/lan...)
Data from NOAAGlobalTempv6.0.0. (www.ncei.noaa.gov/products/lan...)

November 6, 2025 at 1:37 AM
Trends in November temperatures over land areas (where we live) for the last 50 years... 🔥
Data from NOAAGlobalTempv6.0.0. (www.ncei.noaa.gov/products/lan...)
Data from NOAAGlobalTempv6.0.0. (www.ncei.noaa.gov/products/lan...)