


Revisual Labs
@revisual.co
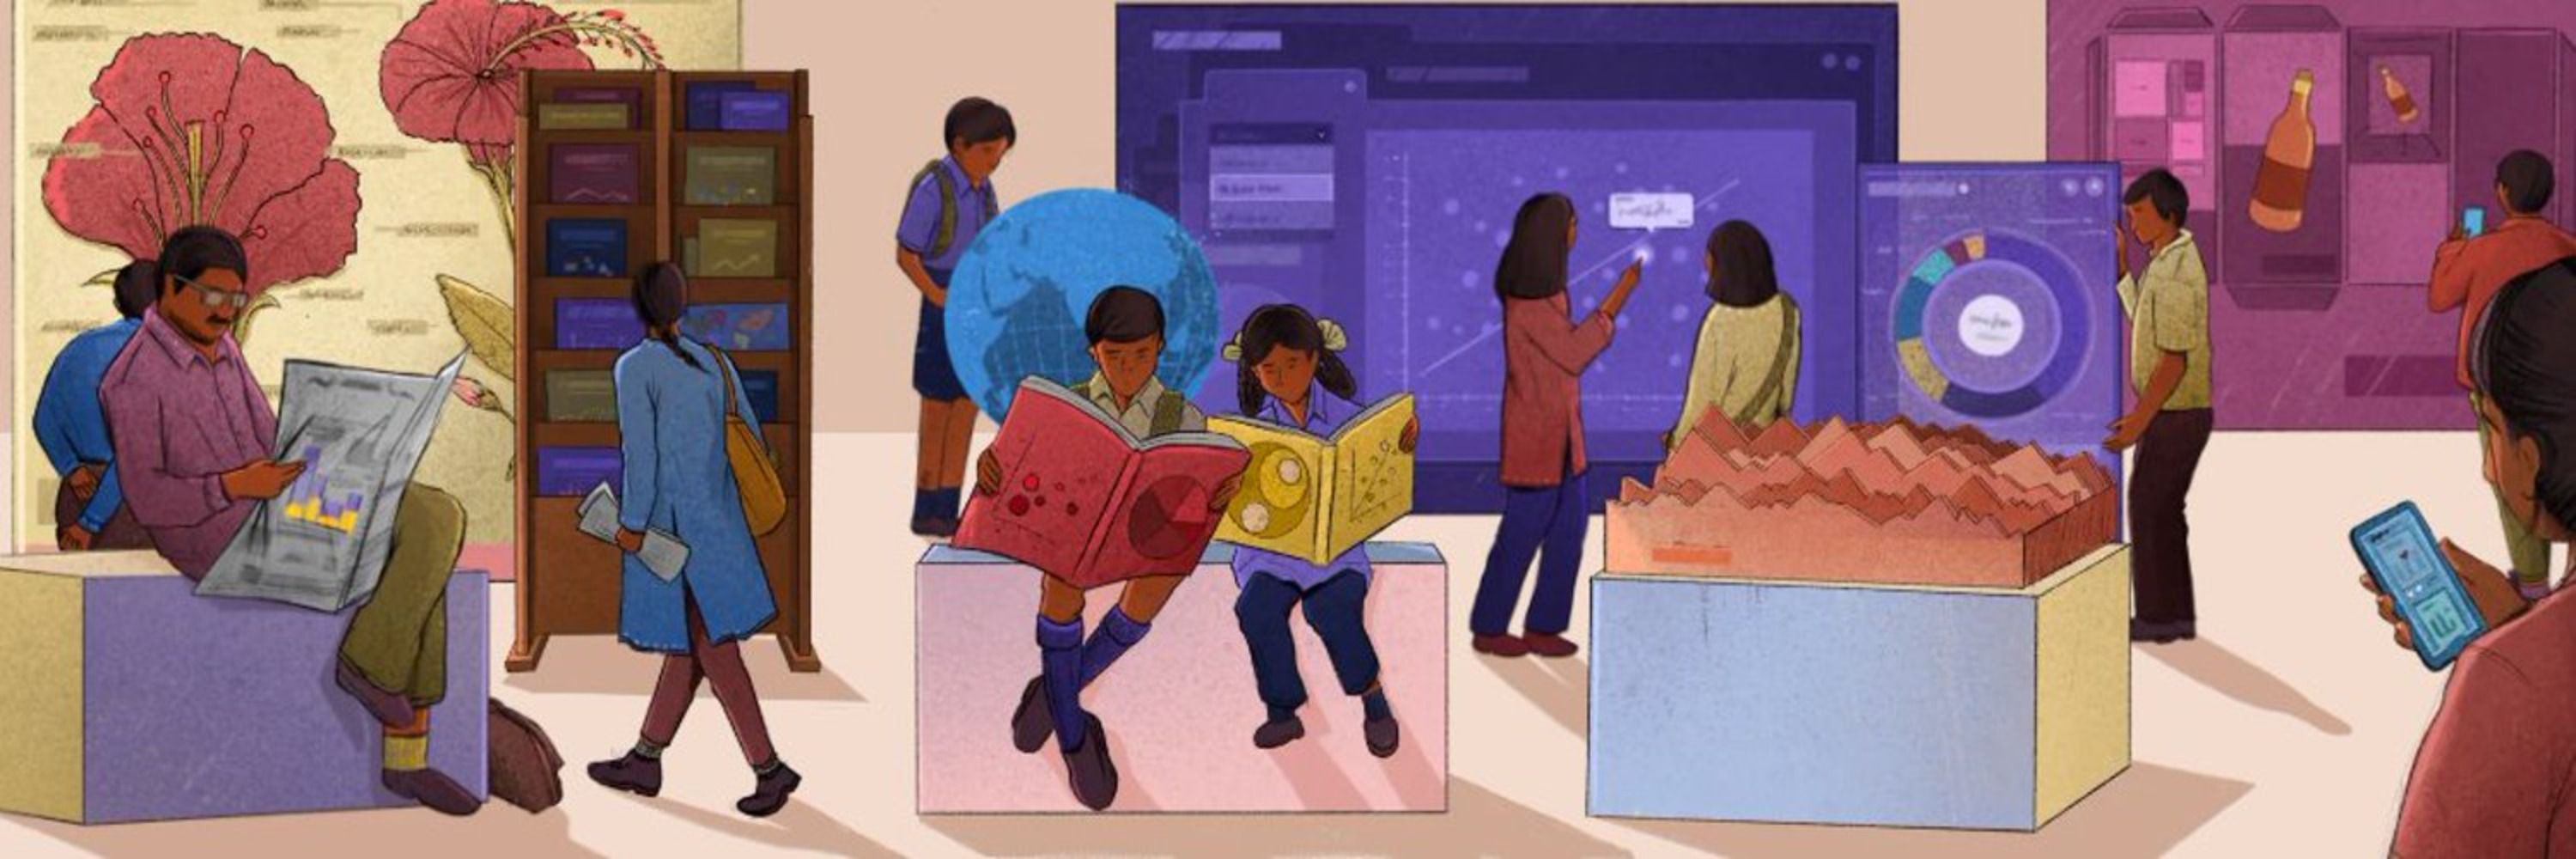
We’re an information design and development agency crafting memorable data stories. Rooted in India with a global outlook. 💻 https://revisual.co/ 💻
#dataviz #informationdesign
#dataviz #informationdesign
📊 Insight Out: Week 48 - Election graphics, Bihar 2025
Our team created 4 automated graphics for the elections, in collaboration with CVoter who provided the data behind the charts. These graphics were shown live on Mojo Story's YouTube channel.
Our team created 4 automated graphics for the elections, in collaboration with CVoter who provided the data behind the charts. These graphics were shown live on Mojo Story's YouTube channel.
November 14, 2025 at 1:28 PM
📊 Insight Out: Week 48 - Election graphics, Bihar 2025
Our team created 4 automated graphics for the elections, in collaboration with CVoter who provided the data behind the charts. These graphics were shown live on Mojo Story's YouTube channel.
Our team created 4 automated graphics for the elections, in collaboration with CVoter who provided the data behind the charts. These graphics were shown live on Mojo Story's YouTube channel.
Team:
Project manager: @chartwaali.bsky.social
Design lead: Tulika Patel
Motion graphics editor: Rameshwar Jaiswal
Project manager: @chartwaali.bsky.social
Design lead: Tulika Patel
Motion graphics editor: Rameshwar Jaiswal
October 22, 2025 at 1:37 PM
Team:
Project manager: @chartwaali.bsky.social
Design lead: Tulika Patel
Motion graphics editor: Rameshwar Jaiswal
Project manager: @chartwaali.bsky.social
Design lead: Tulika Patel
Motion graphics editor: Rameshwar Jaiswal
This set consisted of a series of shorter videos breaking down key concepts from the report and a long-form video summary.
October 22, 2025 at 1:37 PM
This set consisted of a series of shorter videos breaking down key concepts from the report and a long-form video summary.
🔗 Take a closer look at the map here: dtm.iom.int/data-stories...
🔗 Visit our website revisual.co/work
#dataviz #maps
🔗 Visit our website revisual.co/work
#dataviz #maps
October 10, 2025 at 1:13 PM
🔗 Take a closer look at the map here: dtm.iom.int/data-stories...
🔗 Visit our website revisual.co/work
#dataviz #maps
🔗 Visit our website revisual.co/work
#dataviz #maps