


Revisual Labs
@revisual.co
We’re an information design and development agency crafting memorable data stories. Rooted in India with a global outlook. 💻 https://revisual.co/ 💻
#dataviz #informationdesign
#dataviz #informationdesign
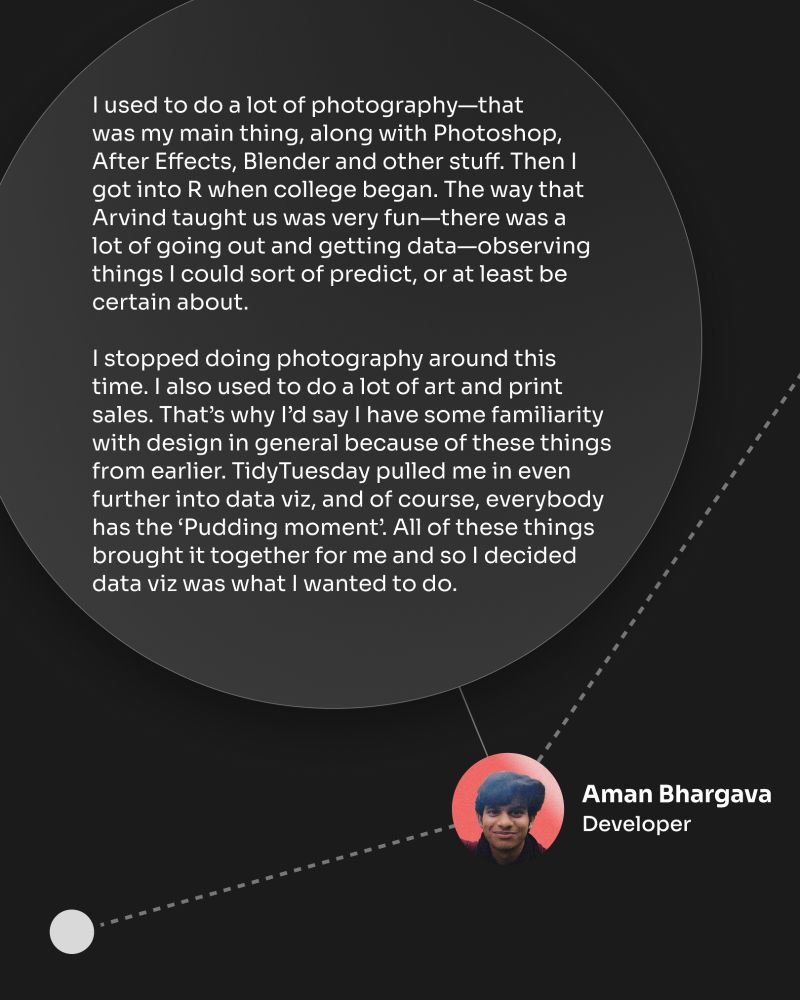
Others had established careers in entirely different domains, where a crucial 'aha' moment led them to pivot into data visualisation.
Every past role, every detour, and every skill and viewpoint contributed to the unique perspective and process each person has today.
Every past role, every detour, and every skill and viewpoint contributed to the unique perspective and process each person has today.


November 17, 2025 at 12:16 PM
Others had established careers in entirely different domains, where a crucial 'aha' moment led them to pivot into data visualisation.
Every past role, every detour, and every skill and viewpoint contributed to the unique perspective and process each person has today.
Every past role, every detour, and every skill and viewpoint contributed to the unique perspective and process each person has today.
And as you'll see from the answers, each member has a distinctly different story.
Some were exploring various design disciplines and found out about this field right in college.
Some were exploring various design disciplines and found out about this field right in college.


November 17, 2025 at 12:16 PM
And as you'll see from the answers, each member has a distinctly different story.
Some were exploring various design disciplines and found out about this field right in college.
Some were exploring various design disciplines and found out about this field right in college.
Last week, we explored how they stumbled into this field. This week, we're diving deeper to answer the question: What were they doing before getting into data visualisation?

November 17, 2025 at 12:16 PM
Last week, we explored how they stumbled into this field. This week, we're diving deeper to answer the question: What were they doing before getting into data visualisation?
To solve for this, we kept the numbers big and bold, used simple visualisations that didn't require a legend or annotation beyond basic labels and clean design with high contrast for maximum visibility.

November 14, 2025 at 1:28 PM
To solve for this, we kept the numbers big and bold, used simple visualisations that didn't require a legend or annotation beyond basic labels and clean design with high contrast for maximum visibility.
The first graphic, shown below, is a half donut chart, updating live showing wins and leads in the state by major alliances. Scale was the greatest challenge in creating these graphics since it was to be viewed on one window of a screen share which would appear tinier on mobile.

November 14, 2025 at 1:28 PM
The first graphic, shown below, is a half donut chart, updating live showing wins and leads in the state by major alliances. Scale was the greatest challenge in creating these graphics since it was to be viewed on one window of a screen share which would appear tinier on mobile.
📊 Insight Out: Week 48 - Election graphics, Bihar 2025
Our team created 4 automated graphics for the elections, in collaboration with CVoter who provided the data behind the charts. These graphics were shown live on Mojo Story's YouTube channel.
Our team created 4 automated graphics for the elections, in collaboration with CVoter who provided the data behind the charts. These graphics were shown live on Mojo Story's YouTube channel.
November 14, 2025 at 1:28 PM
📊 Insight Out: Week 48 - Election graphics, Bihar 2025
Our team created 4 automated graphics for the elections, in collaboration with CVoter who provided the data behind the charts. These graphics were shown live on Mojo Story's YouTube channel.
Our team created 4 automated graphics for the elections, in collaboration with CVoter who provided the data behind the charts. These graphics were shown live on Mojo Story's YouTube channel.
If you haven't spotted it already, our chart gallery is up on our website. 🔍 Swipe to read about how it could be useful and click the link below to start browsing.
revisual.co/chart-gallery/
revisual.co/chart-gallery/


November 13, 2025 at 10:22 AM
If you haven't spotted it already, our chart gallery is up on our website. 🔍 Swipe to read about how it could be useful and click the link below to start browsing.
revisual.co/chart-gallery/
revisual.co/chart-gallery/
"I always thought it would be amazing if we could get a closer look at the journeys of people in this field to help clear this out a bit, and hopefully provide some sort of a starting point that people could build upon as they begin walking on their own paths” - Ipshita

November 10, 2025 at 12:57 PM
"I always thought it would be amazing if we could get a closer look at the journeys of people in this field to help clear this out a bit, and hopefully provide some sort of a starting point that people could build upon as they begin walking on their own paths” - Ipshita
“There are so many areas one can focus on in this field — from different kinds of visualisations, to software, amongst seemingly countless other possibilities — that it can seem quite overwhelming and confusing to someone who is just starting out. " - Ipshita


November 10, 2025 at 12:57 PM
“There are so many areas one can focus on in this field — from different kinds of visualisations, to software, amongst seemingly countless other possibilities — that it can seem quite overwhelming and confusing to someone who is just starting out. " - Ipshita
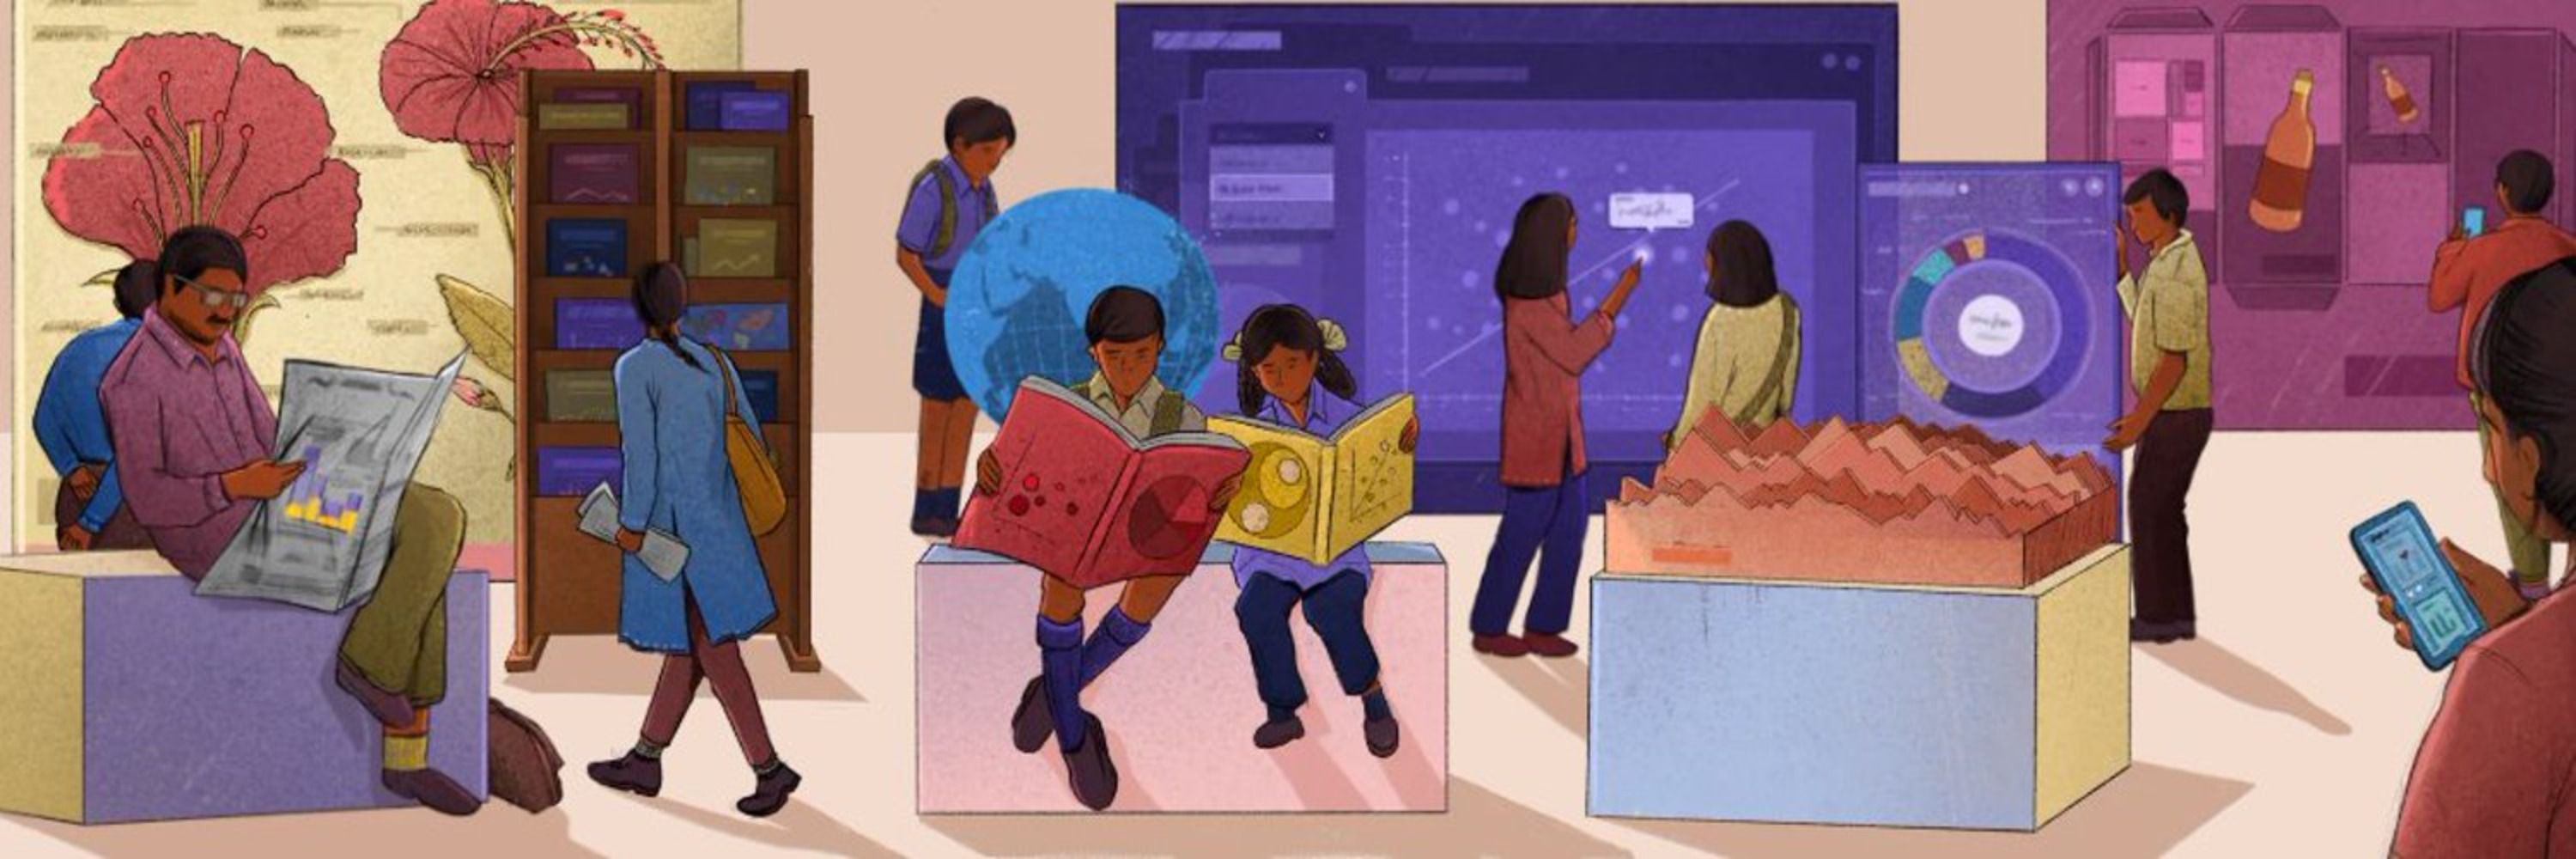
The intent of this series is to open up discussions around how each team member of RVL stumbled into the field of data visualisation. We want to emphasise that the journey into a new career looks different for each person, especially in the field of data viz.


November 10, 2025 at 12:57 PM
The intent of this series is to open up discussions around how each team member of RVL stumbled into the field of data visualisation. We want to emphasise that the journey into a new career looks different for each person, especially in the field of data viz.
We’re kicking off a new series called ‘Journeys of Discovery,’ the idea for which came from Ipshita Raj, our youngest team member.


November 10, 2025 at 12:57 PM
We’re kicking off a new series called ‘Journeys of Discovery,’ the idea for which came from Ipshita Raj, our youngest team member.
And that's a wrap on October! ✨
With 13 members on board, we had a highly productive month at the studio. We launched 1 new project while keeping 6 others steadily humming along. All that work resulted in 321 code commits and required 6,858 Slack message exchanges.
With 13 members on board, we had a highly productive month at the studio. We launched 1 new project while keeping 6 others steadily humming along. All that work resulted in 321 code commits and required 6,858 Slack message exchanges.


November 5, 2025 at 10:26 AM
And that's a wrap on October! ✨
With 13 members on board, we had a highly productive month at the studio. We launched 1 new project while keeping 6 others steadily humming along. All that work resulted in 321 code commits and required 6,858 Slack message exchanges.
With 13 members on board, we had a highly productive month at the studio. We launched 1 new project while keeping 6 others steadily humming along. All that work resulted in 321 code commits and required 6,858 Slack message exchanges.
📊 Insight Out: Week 47 - Redesigning a waterfall chart
Today we’re spotlighting a chart we made for ICRIER’s State of India’s Digital Economy Report (SIDE), 2024.
Today we’re spotlighting a chart we made for ICRIER’s State of India’s Digital Economy Report (SIDE), 2024.


October 24, 2025 at 7:24 AM
📊 Insight Out: Week 47 - Redesigning a waterfall chart
Today we’re spotlighting a chart we made for ICRIER’s State of India’s Digital Economy Report (SIDE), 2024.
Today we’re spotlighting a chart we made for ICRIER’s State of India’s Digital Economy Report (SIDE), 2024.
Team:
Project manager: @chartwaali.bsky.social
Design lead: Tulika Patel
Motion graphics editor: Rameshwar Jaiswal
Project manager: @chartwaali.bsky.social
Design lead: Tulika Patel
Motion graphics editor: Rameshwar Jaiswal
October 22, 2025 at 1:37 PM
Team:
Project manager: @chartwaali.bsky.social
Design lead: Tulika Patel
Motion graphics editor: Rameshwar Jaiswal
Project manager: @chartwaali.bsky.social
Design lead: Tulika Patel
Motion graphics editor: Rameshwar Jaiswal
Today, we’re taking you through our thought process and approach for the long-form video explainer so swipe through to read about how we transformed a static web report into an engaging motion piece!


October 22, 2025 at 1:37 PM
Today, we’re taking you through our thought process and approach for the long-form video explainer so swipe through to read about how we transformed a static web report into an engaging motion piece!
This set consisted of a series of shorter videos breaking down key concepts from the report and a long-form video summary.
October 22, 2025 at 1:37 PM
This set consisted of a series of shorter videos breaking down key concepts from the report and a long-form video summary.
In July, we published a set of video explainers in collaboration with Godrej Design Lab, the goal of which was to share key insights from their ‘Building A Climate Conscious India’ report focusing on low-carbon solutions for the buildings sector in India.


October 22, 2025 at 1:37 PM
In July, we published a set of video explainers in collaboration with Godrej Design Lab, the goal of which was to share key insights from their ‘Building A Climate Conscious India’ report focusing on low-carbon solutions for the buildings sector in India.
We wish you and your loved ones a very happy, prosperous and bright Diwali. 🪔 With a curious spark and clarity of thought, we hope to continue to enlighten one another in the pursuit to tell meaningful stories with data. ✨

October 20, 2025 at 6:41 AM
We wish you and your loved ones a very happy, prosperous and bright Diwali. 🪔 With a curious spark and clarity of thought, we hope to continue to enlighten one another in the pursuit to tell meaningful stories with data. ✨
Visit the links below to view the project!
🔗 Link to the project: 3ieimpact.org/impact/impac...
🔗 Our website: revisual.co
#dashboard #dataviz #impactstories
🔗 Link to the project: 3ieimpact.org/impact/impac...
🔗 Our website: revisual.co
#dashboard #dataviz #impactstories

October 16, 2025 at 8:23 AM
Visit the links below to view the project!
🔗 Link to the project: 3ieimpact.org/impact/impac...
🔗 Our website: revisual.co
#dashboard #dataviz #impactstories
🔗 Link to the project: 3ieimpact.org/impact/impac...
🔗 Our website: revisual.co
#dashboard #dataviz #impactstories
In this dashboard, users can filter through impact stories by sector, project type or location. Swipe to read about the unique phases and milestones of the 3ie Impact Stories Dashboard.


October 16, 2025 at 8:23 AM
In this dashboard, users can filter through impact stories by sector, project type or location. Swipe to read about the unique phases and milestones of the 3ie Impact Stories Dashboard.
We're finally back with another project post! Each of our projects have their own milestones and processes depending on the nature of the work, scope and more. In the first half of this year, we designed and developed an interactive dashboard of 100 impact stories by 3ie.


October 16, 2025 at 8:23 AM
We're finally back with another project post! Each of our projects have their own milestones and processes depending on the nature of the work, scope and more. In the first half of this year, we designed and developed an interactive dashboard of 100 impact stories by 3ie.
🔗 Take a closer look at the map here: dtm.iom.int/data-stories...
🔗 Visit our website revisual.co/work
#dataviz #maps
🔗 Visit our website revisual.co/work
#dataviz #maps
October 10, 2025 at 1:13 PM
🔗 Take a closer look at the map here: dtm.iom.int/data-stories...
🔗 Visit our website revisual.co/work
#dataviz #maps
🔗 Visit our website revisual.co/work
#dataviz #maps
From the initial concept sketch inspired by train transit maps, to finding the right tools, trials and errors, followed by a bit of jugaad, view the final product and read about how our developer Aman, met his match.


October 10, 2025 at 1:13 PM
From the initial concept sketch inspired by train transit maps, to finding the right tools, trials and errors, followed by a bit of jugaad, view the final product and read about how our developer Aman, met his match.
📊 Insight Out: Week 46 - An animated map showing the journeys of refugees from Ukraine to neighbouring countries.
This week, we're sharing a map created for IOM’s 'Journeys of Resilience', an interactive story about the lives of refugees from Ukraine, amidst the ongoing war.
This week, we're sharing a map created for IOM’s 'Journeys of Resilience', an interactive story about the lives of refugees from Ukraine, amidst the ongoing war.

October 10, 2025 at 1:13 PM
📊 Insight Out: Week 46 - An animated map showing the journeys of refugees from Ukraine to neighbouring countries.
This week, we're sharing a map created for IOM’s 'Journeys of Resilience', an interactive story about the lives of refugees from Ukraine, amidst the ongoing war.
This week, we're sharing a map created for IOM’s 'Journeys of Resilience', an interactive story about the lives of refugees from Ukraine, amidst the ongoing war.
Our team is growing–and how! Nearly a year after she completed her 2 month internship with us, @rashitries.bsky.social has officially joined the RVL team as a designer.


October 9, 2025 at 8:30 AM
Our team is growing–and how! Nearly a year after she completed her 2 month internship with us, @rashitries.bsky.social has officially joined the RVL team as a designer.