


Elmera Azadpour
@eazadpour.bsky.social
#DataViz #rstats | she/her | elmeraa-usgs.github.io
Reposted by Elmera Azadpour

I really liked this idea of using a histogram as a legend in a choropleth map (since land isn't unemployed; people are), so I made a little guide to doing it with #rstats, {ggplot2}, and {patchwork}
www.andrewheiss.com/blog/2025/02...
www.andrewheiss.com/blog/2025/02...
February 19, 2025 at 5:58 PM
I really liked this idea of using a histogram as a legend in a choropleth map (since land isn't unemployed; people are), so I made a little guide to doing it with #rstats, {ggplot2}, and {patchwork}
www.andrewheiss.com/blog/2025/02...
www.andrewheiss.com/blog/2025/02...
Reposted by Elmera Azadpour

My latest piece for @puddingviz.bsky.social: 30 minutes with a stranger
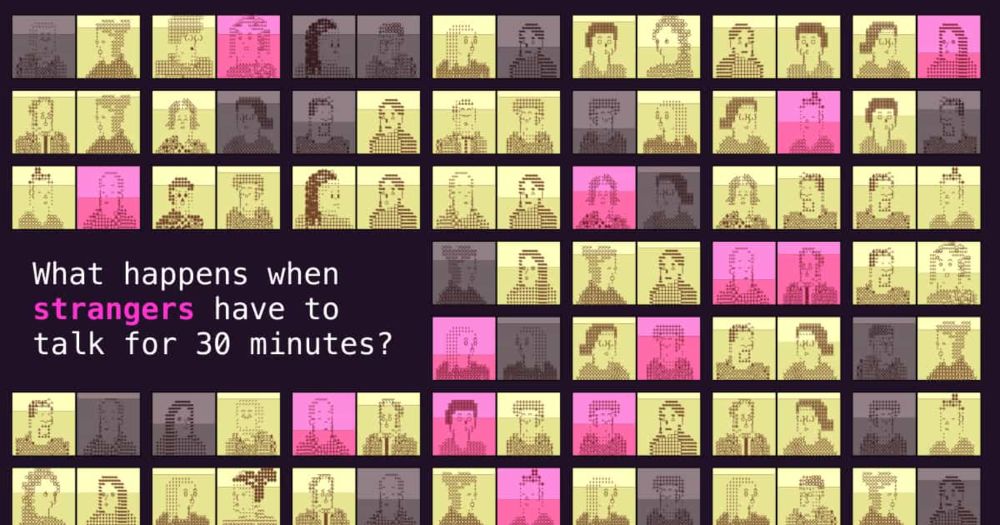
30 minutes with a stranger
Watch hundreds of strangers talk for 30 minutes, and track how their moods change
pudding.cool
June 13, 2025 at 11:22 AM
My latest piece for @puddingviz.bsky.social: 30 minutes with a stranger
Reposted by Elmera Azadpour

Jazz up your ggplots!
‘Useful tricks to elevate your data viz via `ggplot` extension packages in R”
Custom themes, fonts, annotations, arrows & more
By the USGS
waterdata.usgs.gov/blog/ggplot-...
#RStats #ggplot2 #ggplot #Dataviz
‘Useful tricks to elevate your data viz via `ggplot` extension packages in R”
Custom themes, fonts, annotations, arrows & more
By the USGS
waterdata.usgs.gov/blog/ggplot-...
#RStats #ggplot2 #ggplot #Dataviz
Jazz up your ggplots!
Useful tricks to elevate your data viz via `ggplot` extension packages in R
waterdata.usgs.gov
April 9, 2025 at 10:53 AM
Jazz up your ggplots!
‘Useful tricks to elevate your data viz via `ggplot` extension packages in R”
Custom themes, fonts, annotations, arrows & more
By the USGS
waterdata.usgs.gov/blog/ggplot-...
#RStats #ggplot2 #ggplot #Dataviz
‘Useful tricks to elevate your data viz via `ggplot` extension packages in R”
Custom themes, fonts, annotations, arrows & more
By the USGS
waterdata.usgs.gov/blog/ggplot-...
#RStats #ggplot2 #ggplot #Dataviz
#30DayChartChallenge | Day 30 - National Geographic Theme | Great Salt Lake 🛰️
#dataviz #remotesensing #GEE
#dataviz #remotesensing #GEE
April 30, 2025 at 4:43 PM
#30DayChartChallenge | Day 30 - National Geographic Theme | Great Salt Lake 🛰️
#dataviz #remotesensing #GEE
#dataviz #remotesensing #GEE


Reposted by Elmera Azadpour

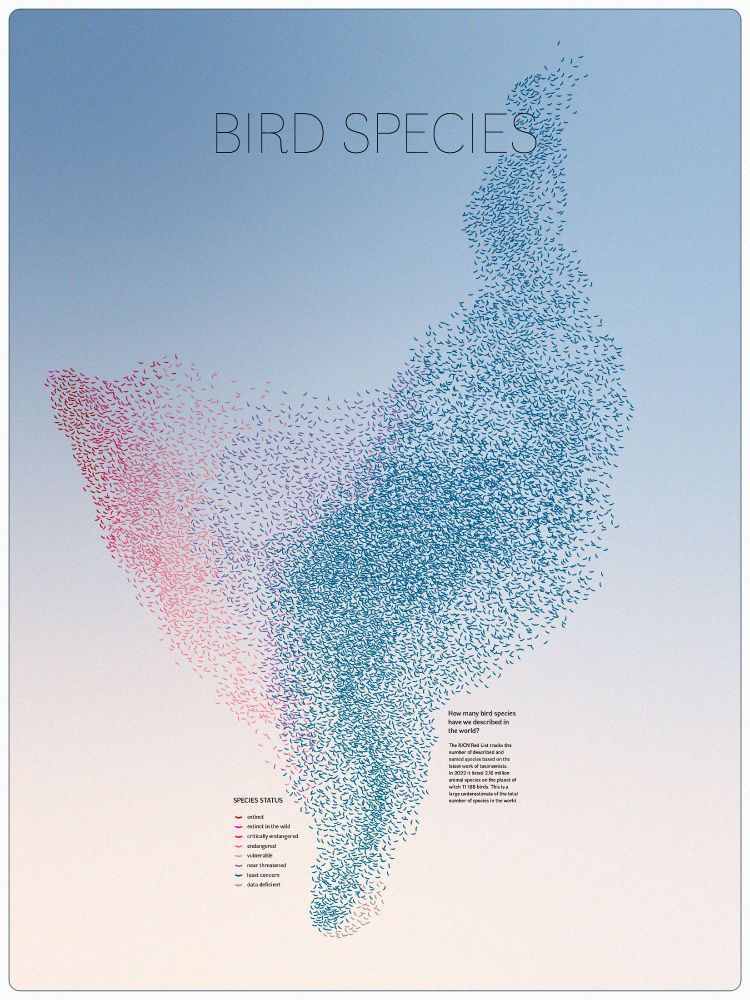
This dataviz is absolutely amazing 😍 Global bird species' conservation status displayed as a massive flock!
By Andrea Garrec, longlisted for the 2024 Information Is Beautiful Awards
www.informationisbeautifulawards.com/showcase/731...
#dataviz 📊🌏🧪🐦🦉🦆🦅
By Andrea Garrec, longlisted for the 2024 Information Is Beautiful Awards
www.informationisbeautifulawards.com/showcase/731...
#dataviz 📊🌏🧪🐦🦉🦆🦅
March 19, 2025 at 2:40 AM
This dataviz is absolutely amazing 😍 Global bird species' conservation status displayed as a massive flock!
By Andrea Garrec, longlisted for the 2024 Information Is Beautiful Awards
www.informationisbeautifulawards.com/showcase/731...
#dataviz 📊🌏🧪🐦🦉🦆🦅
By Andrea Garrec, longlisted for the 2024 Information Is Beautiful Awards
www.informationisbeautifulawards.com/showcase/731...
#dataviz 📊🌏🧪🐦🦉🦆🦅
Week 10 | #TidyTuesday | Pixar Film Ratings
🔗 github.com/elmeraa-usgs...
#rstats #dataviz #r4ds #ggplot
🔗 github.com/elmeraa-usgs...
#rstats #dataviz #r4ds #ggplot

March 14, 2025 at 10:35 PM
Week 10 | #TidyTuesday | Pixar Film Ratings
🔗 github.com/elmeraa-usgs...
#rstats #dataviz #r4ds #ggplot
🔗 github.com/elmeraa-usgs...
#rstats #dataviz #r4ds #ggplot
Grateful to have my work highlighted on the 2024 Information is Beautiful Longlist!
#DataViz #OpenSource #IIB @datavizsociety.bsky.social
www.informationisbeautifulawards.com/showcase/737...
#DataViz #OpenSource #IIB @datavizsociety.bsky.social
www.informationisbeautifulawards.com/showcase/737...

Unequal Access to Water
Water is essential for life, yet many communities in the Western United States face challenges in accessing sufficient, clean water. Water insecurity arises ...
www.informationisbeautifulawards.com
March 11, 2025 at 3:42 PM
Grateful to have my work highlighted on the 2024 Information is Beautiful Longlist!
#DataViz #OpenSource #IIB @datavizsociety.bsky.social
www.informationisbeautifulawards.com/showcase/737...
#DataViz #OpenSource #IIB @datavizsociety.bsky.social
www.informationisbeautifulawards.com/showcase/737...
Thanks for the shoutout of "Mapping water insecurity in R with #tidycensus"
waterdata.usgs.gov/blog/acs-maps/
waterdata.usgs.gov/blog/acs-maps/
March 4, 2025 at 6:15 PM
Thanks for the shoutout of "Mapping water insecurity in R with #tidycensus"
waterdata.usgs.gov/blog/acs-maps/
waterdata.usgs.gov/blog/acs-maps/
Reposted by Elmera Azadpour
My latest for @puddingviz.bsky.social: The Middle Ages
Read: pudding.cool/2025/02/midd...
Watch: www.youtube.com/watch?v=b4zL...
Read: pudding.cool/2025/02/midd...
Watch: www.youtube.com/watch?v=b4zL...

The Middle Ages
Follow hundreds of kids as they navigate their treacherous middle school years.
pudding.cool
March 3, 2025 at 7:02 PM
My latest for @puddingviz.bsky.social: The Middle Ages
Read: pudding.cool/2025/02/midd...
Watch: www.youtube.com/watch?v=b4zL...
Read: pudding.cool/2025/02/midd...
Watch: www.youtube.com/watch?v=b4zL...
Reposted by Elmera Azadpour

🎨✨ colorblindr: Ensuring Accessible #DataViz ✨🎨
Want to make your figs more accessible? colorblindr by Claire D. McWhite & Claus O. Wilke lets you simulate colorblindness in production-ready figures.
🔗 Repo: buff.ly/2UTiByV
🎨 Simulator: buff.ly/4khr0IS
More #Rstats resources, buff.ly/41cFyjY
Want to make your figs more accessible? colorblindr by Claire D. McWhite & Claus O. Wilke lets you simulate colorblindness in production-ready figures.
🔗 Repo: buff.ly/2UTiByV
🎨 Simulator: buff.ly/4khr0IS
More #Rstats resources, buff.ly/41cFyjY

GitHub - clauswilke/colorblindr: An R package to simulate colorblindness on R figures.
An R package to simulate colorblindness on R figures. - clauswilke/colorblindr
buff.ly
February 25, 2025 at 11:39 PM
🎨✨ colorblindr: Ensuring Accessible #DataViz ✨🎨
Want to make your figs more accessible? colorblindr by Claire D. McWhite & Claus O. Wilke lets you simulate colorblindness in production-ready figures.
🔗 Repo: buff.ly/2UTiByV
🎨 Simulator: buff.ly/4khr0IS
More #Rstats resources, buff.ly/41cFyjY
Want to make your figs more accessible? colorblindr by Claire D. McWhite & Claus O. Wilke lets you simulate colorblindness in production-ready figures.
🔗 Repo: buff.ly/2UTiByV
🎨 Simulator: buff.ly/4khr0IS
More #Rstats resources, buff.ly/41cFyjY


February 10, 2025 at 11:19 PM
Reposted by Elmera Azadpour

The shapefiles are gone! 🎉
The {spData} package has officially dropped all datasets in the shapefile format, moving toward modern and efficient geospatial data standards. 🚀🌍
Upgrade your workflows with {spData}: https://buff.ly/4htZ5D3
#rspatial #rstats #gis #geocompx
The {spData} package has officially dropped all datasets in the shapefile format, moving toward modern and efficient geospatial data standards. 🚀🌍
Upgrade your workflows with {spData}: https://buff.ly/4htZ5D3
#rspatial #rstats #gis #geocompx

February 2, 2025 at 3:00 PM
The shapefiles are gone! 🎉
The {spData} package has officially dropped all datasets in the shapefile format, moving toward modern and efficient geospatial data standards. 🚀🌍
Upgrade your workflows with {spData}: https://buff.ly/4htZ5D3
#rspatial #rstats #gis #geocompx
The {spData} package has officially dropped all datasets in the shapefile format, moving toward modern and efficient geospatial data standards. 🚀🌍
Upgrade your workflows with {spData}: https://buff.ly/4htZ5D3
#rspatial #rstats #gis #geocompx
Reposted by Elmera Azadpour

The US workforce can be divided into “sitters” (like programmers and lawyers) and “standers” (like servers and construction workers). In our newest piece, @alv9n.com looks at what we can learn from this labor split.
💻: pudding.cool/2024/11/sitt...
📺: www.youtube.com/watch?v=sE_E...
💻: pudding.cool/2024/11/sitt...
📺: www.youtube.com/watch?v=sE_E...
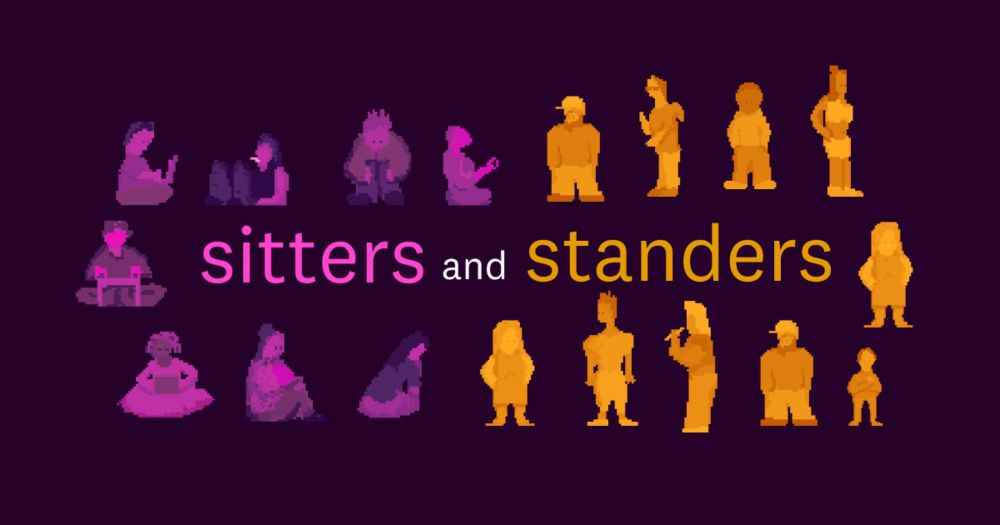
Sitters and Standers
The American worker divide: Those who sit, and those who stand
pudding.cool
November 21, 2024 at 3:58 PM
The US workforce can be divided into “sitters” (like programmers and lawyers) and “standers” (like servers and construction workers). In our newest piece, @alv9n.com looks at what we can learn from this labor split.
💻: pudding.cool/2024/11/sitt...
📺: www.youtube.com/watch?v=sE_E...
💻: pudding.cool/2024/11/sitt...
📺: www.youtube.com/watch?v=sE_E...
Reposted by Elmera Azadpour

#TidyTuesday week 4: Water Insecurity 💧
Plumbing facilities are improving in 22 states, and it is getting worse in 28.
#Rstats #dataviz
Plumbing facilities are improving in 22 states, and it is getting worse in 28.
#Rstats #dataviz

February 1, 2025 at 11:10 PM
#TidyTuesday week 4: Water Insecurity 💧
Plumbing facilities are improving in 22 states, and it is getting worse in 28.
#Rstats #dataviz
Plumbing facilities are improving in 22 states, and it is getting worse in 28.
#Rstats #dataviz
Reposted by Elmera Azadpour

#TidyTuesday - week 4 - Water Insecurity - and my first time sharing what I've made online. Plot was made using ggplot2, and I fine-tuned the graphics in Illustrator.
Might share my code on GitHub later (after I clean it up a bit) :D
#rstats #ggplot2
Might share my code on GitHub later (after I clean it up a bit) :D
#rstats #ggplot2

January 31, 2025 at 10:17 AM
#TidyTuesday - week 4 - Water Insecurity - and my first time sharing what I've made online. Plot was made using ggplot2, and I fine-tuned the graphics in Illustrator.
Might share my code on GitHub later (after I clean it up a bit) :D
#rstats #ggplot2
Might share my code on GitHub later (after I clean it up a bit) :D
#rstats #ggplot2
Reposted by Elmera Azadpour

#TidyTuesday week 3 - Water Insecurity.
Created this tile map using #Tableau. Thanks to @nnpereira.bsky.social for this week's dataset.
#dataviz
Created this tile map using #Tableau. Thanks to @nnpereira.bsky.social for this week's dataset.
#dataviz

January 29, 2025 at 1:57 PM
#TidyTuesday week 3 - Water Insecurity.
Created this tile map using #Tableau. Thanks to @nnpereira.bsky.social for this week's dataset.
#dataviz
Created this tile map using #Tableau. Thanks to @nnpereira.bsky.social for this week's dataset.
#dataviz
Reposted by Elmera Azadpour

#TidyTuesday week 4 ✅
This week’s data is from the U.S. Census Bureau’s American Community Survey.
I took a look at how the data on lack of indoor plumbing among U.S Counties compares to other census provided geographies, specifically American Indian/Alaska Native/Native Hawaiian Areas.
#rstats
This week’s data is from the U.S. Census Bureau’s American Community Survey.
I took a look at how the data on lack of indoor plumbing among U.S Counties compares to other census provided geographies, specifically American Indian/Alaska Native/Native Hawaiian Areas.
#rstats

January 28, 2025 at 5:40 PM
#TidyTuesday week 4 ✅
This week’s data is from the U.S. Census Bureau’s American Community Survey.
I took a look at how the data on lack of indoor plumbing among U.S Counties compares to other census provided geographies, specifically American Indian/Alaska Native/Native Hawaiian Areas.
#rstats
This week’s data is from the U.S. Census Bureau’s American Community Survey.
I took a look at how the data on lack of indoor plumbing among U.S Counties compares to other census provided geographies, specifically American Indian/Alaska Native/Native Hawaiian Areas.
#rstats
Reposted by Elmera Azadpour

📊 #TidyTuesday – 2025 W04 | Water Insecurity
.
🔗: stevenponce.netlify.app/data_visuali...
.
#rstats | #r4ds | #dataviz | #ggplot2
.
🔗: stevenponce.netlify.app/data_visuali...
.
#rstats | #r4ds | #dataviz | #ggplot2

January 25, 2025 at 10:04 PM
📊 #TidyTuesday – 2025 W04 | Water Insecurity
.
🔗: stevenponce.netlify.app/data_visuali...
.
#rstats | #r4ds | #dataviz | #ggplot2
.
🔗: stevenponce.netlify.app/data_visuali...
.
#rstats | #r4ds | #dataviz | #ggplot2
Excited to check out all the #DataViz for this weeks #tidytuesday!
Check out our site to learn more about unequal access to water in the Western U.S: labs.waterdata.usgs.gov/visualizatio...
And our #tidycensus blog post: waterdata.usgs.gov/blog/acs-maps/
#DataViz #EJ #Water #rstats
Check out our site to learn more about unequal access to water in the Western U.S: labs.waterdata.usgs.gov/visualizatio...
And our #tidycensus blog post: waterdata.usgs.gov/blog/acs-maps/
#DataViz #EJ #Water #rstats
January 27, 2025 at 3:03 PM
Excited to check out all the #DataViz for this weeks #tidytuesday!
Check out our site to learn more about unequal access to water in the Western U.S: labs.waterdata.usgs.gov/visualizatio...
And our #tidycensus blog post: waterdata.usgs.gov/blog/acs-maps/
#DataViz #EJ #Water #rstats
Check out our site to learn more about unequal access to water in the Western U.S: labs.waterdata.usgs.gov/visualizatio...
And our #tidycensus blog post: waterdata.usgs.gov/blog/acs-maps/
#DataViz #EJ #Water #rstats
Reposted by Elmera Azadpour

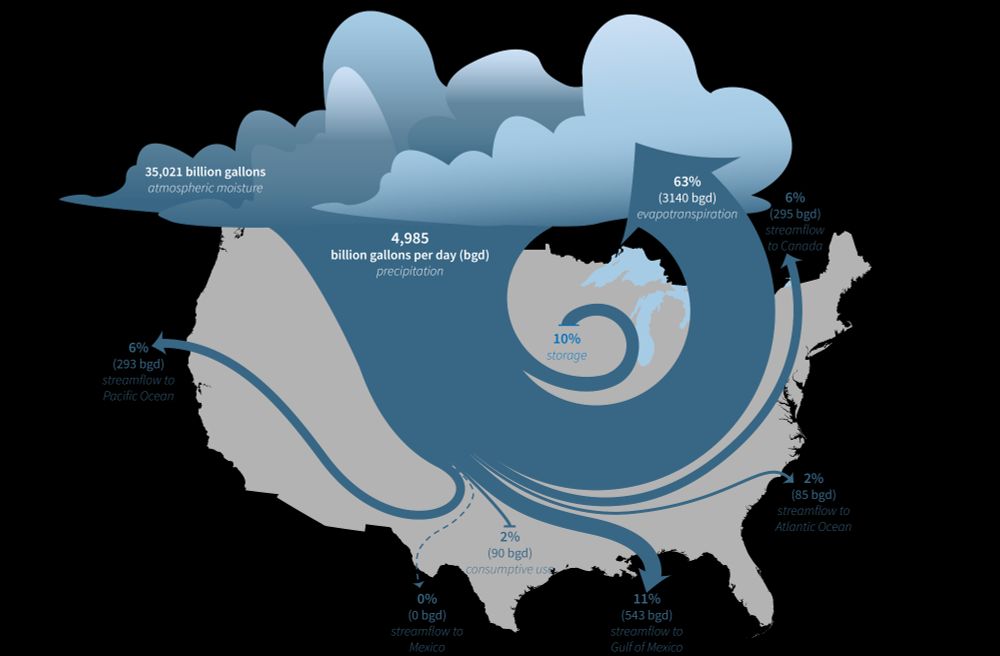
The U.S. Geological Survey (USGS) Vizlab has just released a new, interactive data visualization website about the USGS National Water Availability Assessment Report and Data Companion. Explore the data and the key findings of the assessment at water.usgs.gov/vizlab/water... #DataViz #rstats #USGS
January 16, 2025 at 6:20 PM
The U.S. Geological Survey (USGS) Vizlab has just released a new, interactive data visualization website about the USGS National Water Availability Assessment Report and Data Companion. Explore the data and the key findings of the assessment at water.usgs.gov/vizlab/water... #DataViz #rstats #USGS
Reposted by Elmera Azadpour
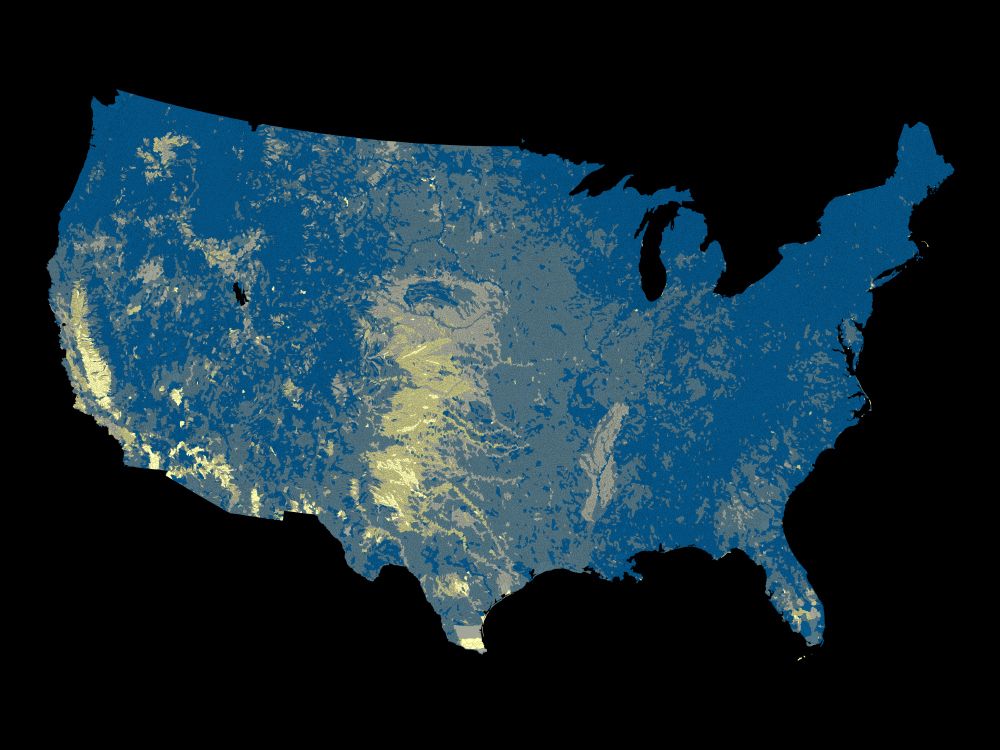
Earth is in flux…. see our latest #dataviz project coming from #USGSvizlab labs.waterdata.usgs.gov/visualizatio...

Earth is in flux
Chart gallery highlighting key findings of USGS land change science
labs.waterdata.usgs.gov
December 20, 2024 at 8:43 PM
Earth is in flux…. see our latest #dataviz project coming from #USGSvizlab labs.waterdata.usgs.gov/visualizatio...
Reposted by Elmera Azadpour
Reproducible Data Science in R: Flexible functions using tidy evaluation. Improve your functions with helpful dataframe evaluation patterns! waterdata.usgs.gov/blog/rds-fun... #rstats

December 17, 2024 at 4:38 PM
Reproducible Data Science in R: Flexible functions using tidy evaluation. Improve your functions with helpful dataframe evaluation patterns! waterdata.usgs.gov/blog/rds-fun... #rstats
Looking to fold @uscensusbureau data into your workflows? Our latest blog shows how to use #tidycensus to explore & visualize social vulnerability indicators in the Western U.S., with #reproducible code!
🔗: waterdata.usgs.gov/blog/acs-maps/
#rstats #DataViz #WaterInsecurity #OpenScience
🔗: waterdata.usgs.gov/blog/acs-maps/
#rstats #DataViz #WaterInsecurity #OpenScience

December 9, 2024 at 7:43 PM
Looking to fold @uscensusbureau data into your workflows? Our latest blog shows how to use #tidycensus to explore & visualize social vulnerability indicators in the Western U.S., with #reproducible code!
🔗: waterdata.usgs.gov/blog/acs-maps/
#rstats #DataViz #WaterInsecurity #OpenScience
🔗: waterdata.usgs.gov/blog/acs-maps/
#rstats #DataViz #WaterInsecurity #OpenScience
Reposted by Elmera Azadpour

Do you use trail cameras to monitor streams, rivers or other water bodies? Looking for a platform to turn those images into relative flow or stage information? Or even just to look back through all of your images? Check out Flow Photo Explorer! www.usgs.gov/apps/ecoshed...


December 5, 2024 at 6:49 PM
Do you use trail cameras to monitor streams, rivers or other water bodies? Looking for a platform to turn those images into relative flow or stage information? Or even just to look back through all of your images? Check out Flow Photo Explorer! www.usgs.gov/apps/ecoshed...