


Dax Kellie
@daxkellie.bsky.social
Data Analyst & Science Lead at the Atlas of Living Australia | Evolutionary biologist & social psychologist (PhD) 🧪 | #rstats 📊 | Music enthusiast 🎵
www.daxkellie.com
Opinions are my own, and they do not express those of my employer
www.daxkellie.com
Opinions are my own, and they do not express those of my employer
Pinned
Dax Kellie
@daxkellie.bsky.social
· Sep 2


Reposted by Dax Kellie

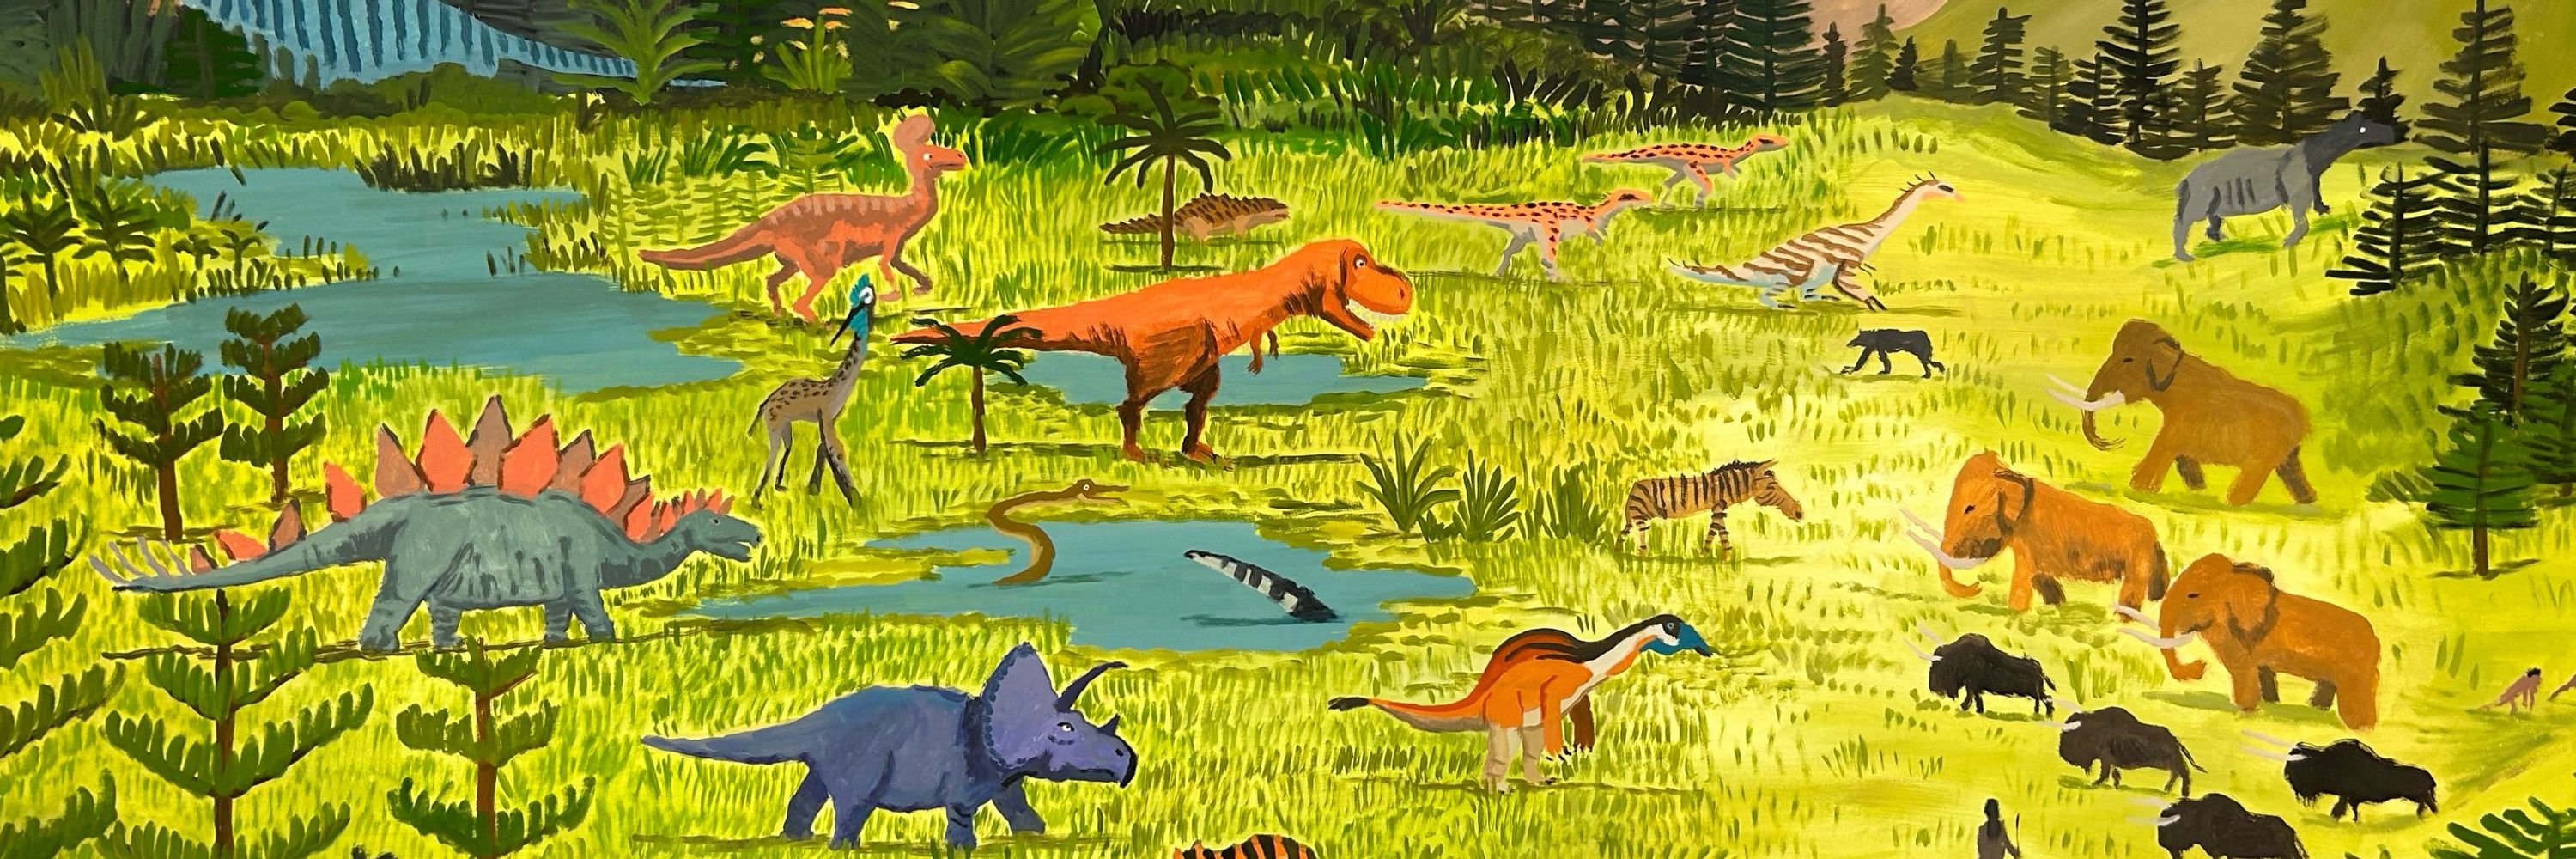
New in Science, Macaques tap to the beat.
Very cool study for its main result and its null one: consistent with nearly every other comparative study of music, monkeys don't differentiate beats by their relative strength—which even young children do innately. Monkeys have rhythm but not meter!
Very cool study for its main result and its null one: consistent with nearly every other comparative study of music, monkeys don't differentiate beats by their relative strength—which even young children do innately. Monkeys have rhythm but not meter!

Monkeys have rhythm
Synchronizing movements to music is a hallmark of human culture, but its evolutionary and neurobiological origins remain unknown. This ability requires (i) extracting a steady rhythmic pulse, or beat,...
www.science.org
November 28, 2025 at 11:45 PM
New in Science, Macaques tap to the beat.
Very cool study for its main result and its null one: consistent with nearly every other comparative study of music, monkeys don't differentiate beats by their relative strength—which even young children do innately. Monkeys have rhythm but not meter!
Very cool study for its main result and its null one: consistent with nearly every other comparative study of music, monkeys don't differentiate beats by their relative strength—which even young children do innately. Monkeys have rhythm but not meter!
If you missed my talk but still want some tips for writing good code for scientists, my slides are here:
daxkellie.quarto.pub/a-guide-to-w...
All the links and references are there too in case you want to see more! 😀🧪🌏
#ESA2025 #rstats #quartopub
daxkellie.quarto.pub/a-guide-to-w...
All the links and references are there too in case you want to see more! 😀🧪🌏
#ESA2025 #rstats #quartopub

November 26, 2025 at 6:12 AM
If you missed my talk but still want some tips for writing good code for scientists, my slides are here:
daxkellie.quarto.pub/a-guide-to-w...
All the links and references are there too in case you want to see more! 😀🧪🌏
#ESA2025 #rstats #quartopub
daxkellie.quarto.pub/a-guide-to-w...
All the links and references are there too in case you want to see more! 😀🧪🌏
#ESA2025 #rstats #quartopub
We all want to write good code…but…how?
In my talk later today, I’ll give all few tips I’ve learned about good scientific code writing that have really helped me & maybe they’ll help you!
Riverbank room 8, 2:50pm #ESA2025
In my talk later today, I’ll give all few tips I’ve learned about good scientific code writing that have really helped me & maybe they’ll help you!
Riverbank room 8, 2:50pm #ESA2025

November 26, 2025 at 12:11 AM
We all want to write good code…but…how?
In my talk later today, I’ll give all few tips I’ve learned about good scientific code writing that have really helped me & maybe they’ll help you!
Riverbank room 8, 2:50pm #ESA2025
In my talk later today, I’ll give all few tips I’ve learned about good scientific code writing that have really helped me & maybe they’ll help you!
Riverbank room 8, 2:50pm #ESA2025
We’re at #ESA2025!
Come to the Atlas of Living Australia booth, located conveniently by the coffee cart!
Come grab a hex sticker and say hi to me & @shandiya.bsky.social while you’re there 😀☕️
Come to the Atlas of Living Australia booth, located conveniently by the coffee cart!
Come grab a hex sticker and say hi to me & @shandiya.bsky.social while you’re there 😀☕️

November 24, 2025 at 4:03 AM
We’re at #ESA2025!
Come to the Atlas of Living Australia booth, located conveniently by the coffee cart!
Come grab a hex sticker and say hi to me & @shandiya.bsky.social while you’re there 😀☕️
Come to the Atlas of Living Australia booth, located conveniently by the coffee cart!
Come grab a hex sticker and say hi to me & @shandiya.bsky.social while you’re there 😀☕️
@shandiya.bsky.social shows how huge data infrastructures like the ALA also show what we *don’t* know about biodiversity, but how Data Mobilisation programs & our new {galaxias} package can help people provide data to fill the gaps 👇👀
www.ala.org.au/abdmp/
galaxias.ala.org.au
🧪🌏 #ESA2025 #rstats
www.ala.org.au/abdmp/
galaxias.ala.org.au
🧪🌏 #ESA2025 #rstats


November 24, 2025 at 3:55 AM
@shandiya.bsky.social shows how huge data infrastructures like the ALA also show what we *don’t* know about biodiversity, but how Data Mobilisation programs & our new {galaxias} package can help people provide data to fill the gaps 👇👀
www.ala.org.au/abdmp/
galaxias.ala.org.au
🧪🌏 #ESA2025 #rstats
www.ala.org.au/abdmp/
galaxias.ala.org.au
🧪🌏 #ESA2025 #rstats
Reposted by Dax Kellie

For the first time, scientists have documented an unusual defense: Some species of arachnids build giant doppelgängers on their webs, creating a frightening deception that scares off would-be killers. https://scim.ag/487Myn0

November 12, 2025 at 5:08 PM
For the first time, scientists have documented an unusual defense: Some species of arachnids build giant doppelgängers on their webs, creating a frightening deception that scares off would-be killers. https://scim.ag/487Myn0
Large-eyed animals like owls 🦉 have a trade-off between large eyes & short optic nerves, which lowers eye mobility (to compensate they evolved swivelly necks)
But chameleons 🦎 have long, coiled optic nerves with extra slack for eye mobility, allowing them to use their famous large swivelly eyes 👀🧪🌏
But chameleons 🦎 have long, coiled optic nerves with extra slack for eye mobility, allowing them to use their famous large swivelly eyes 👀🧪🌏

The twisted secret behind a chameleon’s oddball eyes | Science | AAAS www.science.org/content/arti... 🧪

The twisted secret behind a chameleon’s oddball eyes
Coiled nerves allow the reptiles to move their peepers in multiple directions at once without moving their heads
www.science.org
November 13, 2025 at 7:11 AM
Large-eyed animals like owls 🦉 have a trade-off between large eyes & short optic nerves, which lowers eye mobility (to compensate they evolved swivelly necks)
But chameleons 🦎 have long, coiled optic nerves with extra slack for eye mobility, allowing them to use their famous large swivelly eyes 👀🧪🌏
But chameleons 🦎 have long, coiled optic nerves with extra slack for eye mobility, allowing them to use their famous large swivelly eyes 👀🧪🌏
Reposted by Dax Kellie

New #dataviz on summer heat-stress anomalies in Europe, 1950–2025. 🥵
This map shows hours with WBGT > 29.5 °C—extreme stress where work should be limited. Since 2010, positive anomalies dominate. 300h = 12.5 days of danger. It’s important to focus on the sub-daily exposure.
#rstats #climatechange
This map shows hours with WBGT > 29.5 °C—extreme stress where work should be limited. Since 2010, positive anomalies dominate. 300h = 12.5 days of danger. It’s important to focus on the sub-daily exposure.
#rstats #climatechange

November 8, 2025 at 2:13 PM
New #dataviz on summer heat-stress anomalies in Europe, 1950–2025. 🥵
This map shows hours with WBGT > 29.5 °C—extreme stress where work should be limited. Since 2010, positive anomalies dominate. 300h = 12.5 days of danger. It’s important to focus on the sub-daily exposure.
#rstats #climatechange
This map shows hours with WBGT > 29.5 °C—extreme stress where work should be limited. Since 2010, positive anomalies dominate. 300h = 12.5 days of danger. It’s important to focus on the sub-daily exposure.
#rstats #climatechange
Reposted by Dax Kellie
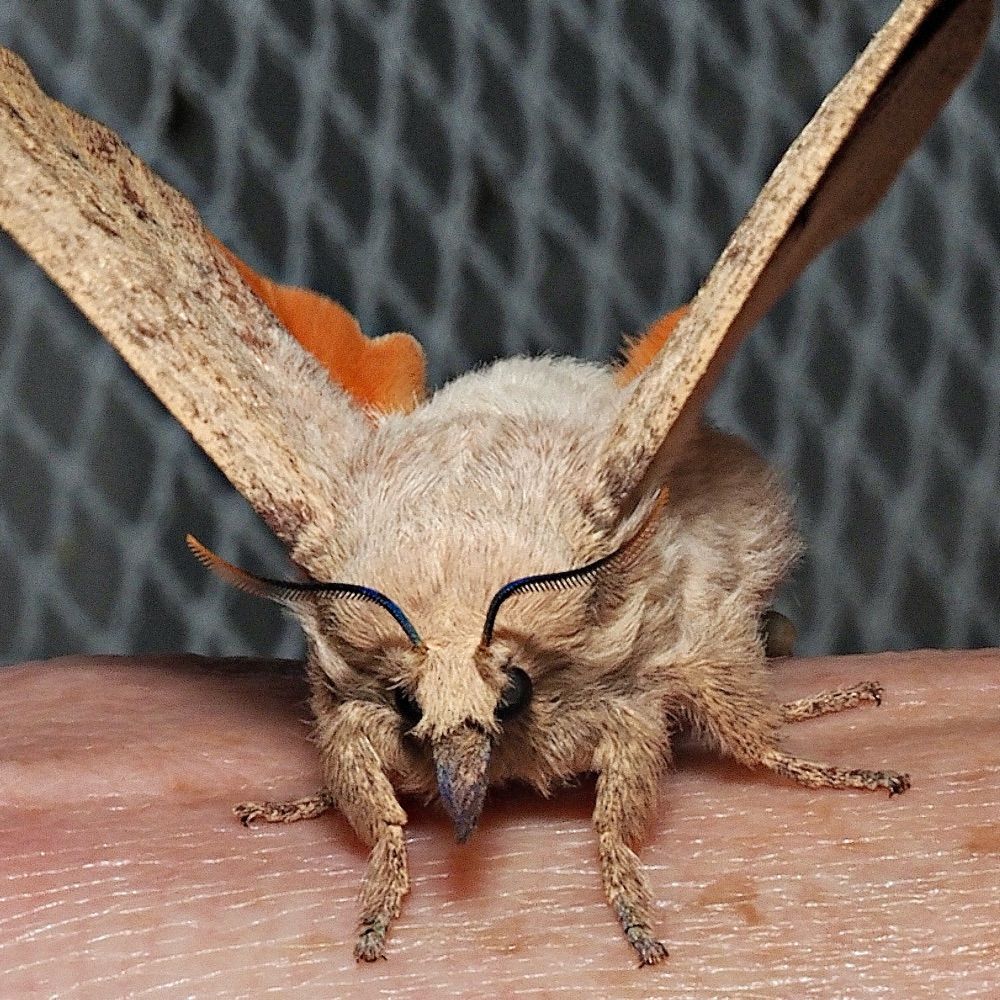
Spotted this beautifully hairy #owlfly (Acmonotus incusifer) this week.
One of the Split-eyed Owlflies, it seems this isn't a commonly observed species. There are only 5 observations in #inaturalist with all of those in Western Australia.
#ausinverts #Neuroptera #wildoz #insects #nature
One of the Split-eyed Owlflies, it seems this isn't a commonly observed species. There are only 5 observations in #inaturalist with all of those in Western Australia.
#ausinverts #Neuroptera #wildoz #insects #nature

November 4, 2025 at 3:54 AM
Spotted this beautifully hairy #owlfly (Acmonotus incusifer) this week.
One of the Split-eyed Owlflies, it seems this isn't a commonly observed species. There are only 5 observations in #inaturalist with all of those in Western Australia.
#ausinverts #Neuroptera #wildoz #insects #nature
One of the Split-eyed Owlflies, it seems this isn't a commonly observed species. There are only 5 observations in #inaturalist with all of those in Western Australia.
#ausinverts #Neuroptera #wildoz #insects #nature
Reposted by Dax Kellie

Heard about this at #LivingData2025, if you have biodiversity data you want to share but are not sure how, I think this will be really useful.
🚨Our new package {galaxias} is released in R & Python today! 🚨
📦 galaxias makes it easy to standardise data to Darwin Core, the accepted format for sharing ecological data with infrastructures like @gbif.org and the Atlas of Living Australia
galaxias.ala.org.au
#rstats #python 🧪🌏🐟
A thread 🧵👇
📦 galaxias makes it easy to standardise data to Darwin Core, the accepted format for sharing ecological data with infrastructures like @gbif.org and the Atlas of Living Australia
galaxias.ala.org.au
#rstats #python 🧪🌏🐟
A thread 🧵👇

October 27, 2025 at 10:32 PM
Heard about this at #LivingData2025, if you have biodiversity data you want to share but are not sure how, I think this will be really useful.
Reposted by Dax Kellie

www.theguardian.com/environment/...
Everyone deserves to see this beautiful piece of science communication.
🌏🧪🪶
There are many things I love about this, but I think number one is that it features the story a little known, but amazing seabird species, the Desertas Petrel.
Everyone deserves to see this beautiful piece of science communication.
🌏🧪🪶
There are many things I love about this, but I think number one is that it features the story a little known, but amazing seabird species, the Desertas Petrel.

Bird migration is changing. What does this reveal about our planet? – visualised
Bird migrations rank as one of nature’s greatest spectacles. Thanks to GPS tracking, scientists are uncovering extraordinary insights into ancient and mysterious journeys – and new threats that are re...
www.theguardian.com
October 24, 2025 at 1:57 AM
www.theguardian.com/environment/...
Everyone deserves to see this beautiful piece of science communication.
🌏🧪🪶
There are many things I love about this, but I think number one is that it features the story a little known, but amazing seabird species, the Desertas Petrel.
Everyone deserves to see this beautiful piece of science communication.
🌏🧪🪶
There are many things I love about this, but I think number one is that it features the story a little known, but amazing seabird species, the Desertas Petrel.
Reposted by Dax Kellie

(1) 🥁 Announcing the 2025 Ebbe Nielsen Challenge winners!
First place: 🥇 @rukayaj.bsky.social (@gbifnorway.bsky.social) for BDQEmail
Sharing first place: 🥇 @daxkellie.bsky.social, Amanda Buyan, @shandiya.bsky.social and @rowdynerd.bsky.social (Atlas of Living Australia) for galaxias!
First place: 🥇 @rukayaj.bsky.social (@gbifnorway.bsky.social) for BDQEmail
Sharing first place: 🥇 @daxkellie.bsky.social, Amanda Buyan, @shandiya.bsky.social and @rowdynerd.bsky.social (Atlas of Living Australia) for galaxias!


October 22, 2025 at 3:00 PM
(1) 🥁 Announcing the 2025 Ebbe Nielsen Challenge winners!
First place: 🥇 @rukayaj.bsky.social (@gbifnorway.bsky.social) for BDQEmail
Sharing first place: 🥇 @daxkellie.bsky.social, Amanda Buyan, @shandiya.bsky.social and @rowdynerd.bsky.social (Atlas of Living Australia) for galaxias!
First place: 🥇 @rukayaj.bsky.social (@gbifnorway.bsky.social) for BDQEmail
Sharing first place: 🥇 @daxkellie.bsky.social, Amanda Buyan, @shandiya.bsky.social and @rowdynerd.bsky.social (Atlas of Living Australia) for galaxias!
I’m a few episodes in and this podcast is *fantastic*

Peabody Award-winning journalist Jad Abumrad is back with a new podcast series Fela Kuti: Fear No Man, investigating the icon's creation of Afrobeats and his fight against oppression. n.pr/47wArzy

'Fela Kuti: Fear No Man' podcast explores the icon's music and activism
Peabody Award-winning journalist Jad Abumrad is back with a new podcast series Fela Kuti: Fear No Man, investigating the icon's creation of Afrobeats and his fight against oppression.
n.pr
October 23, 2025 at 9:36 PM
I’m a few episodes in and this podcast is *fantastic*
Reposted by Dax Kellie

VERY proud to release the first version of the OceanOmics per-site #eDNA reports: every site we sampled over the past 4 years, summarised and visualised. We have >5,500 samples over 950 sites, so eventually we will have 950 reports.
Features:
(Thread: 1/6)
Features:
(Thread: 1/6)

October 23, 2025 at 11:06 AM
VERY proud to release the first version of the OceanOmics per-site #eDNA reports: every site we sampled over the past 4 years, summarised and visualised. We have >5,500 samples over 950 sites, so eventually we will have 950 reports.
Features:
(Thread: 1/6)
Features:
(Thread: 1/6)
Want to see what {galaxias} can do? 🤔
Check out slides from a talk we presented on galaxias this week at the Living Data conference:
martinwestgate.com/presentation...
Or, check out this intro video about galaxias:
www.youtube.com/watch?v=kO4-...
#rstats 🌏🧪🐟
Check out slides from a talk we presented on galaxias this week at the Living Data conference:
martinwestgate.com/presentation...
Or, check out this intro video about galaxias:
www.youtube.com/watch?v=kO4-...
#rstats 🌏🧪🐟

October 23, 2025 at 2:55 AM
Want to see what {galaxias} can do? 🤔
Check out slides from a talk we presented on galaxias this week at the Living Data conference:
martinwestgate.com/presentation...
Or, check out this intro video about galaxias:
www.youtube.com/watch?v=kO4-...
#rstats 🌏🧪🐟
Check out slides from a talk we presented on galaxias this week at the Living Data conference:
martinwestgate.com/presentation...
Or, check out this intro video about galaxias:
www.youtube.com/watch?v=kO4-...
#rstats 🌏🧪🐟
🚨Our new package {galaxias} is released in R & Python today! 🚨
📦 galaxias makes it easy to standardise data to Darwin Core, the accepted format for sharing ecological data with infrastructures like @gbif.org and the Atlas of Living Australia
galaxias.ala.org.au
#rstats #python 🧪🌏🐟
A thread 🧵👇
📦 galaxias makes it easy to standardise data to Darwin Core, the accepted format for sharing ecological data with infrastructures like @gbif.org and the Atlas of Living Australia
galaxias.ala.org.au
#rstats #python 🧪🌏🐟
A thread 🧵👇
October 23, 2025 at 2:41 AM
🚨Our new package {galaxias} is released in R & Python today! 🚨
📦 galaxias makes it easy to standardise data to Darwin Core, the accepted format for sharing ecological data with infrastructures like @gbif.org and the Atlas of Living Australia
galaxias.ala.org.au
#rstats #python 🧪🌏🐟
A thread 🧵👇
📦 galaxias makes it easy to standardise data to Darwin Core, the accepted format for sharing ecological data with infrastructures like @gbif.org and the Atlas of Living Australia
galaxias.ala.org.au
#rstats #python 🧪🌏🐟
A thread 🧵👇
These worms can jump up to 20 times their body length—the equivalent of a human jumping the height of an 11-story building—by riding on electrostatic charges 🪱⚡😮
An incredible example of how important electrostatic forces are for many insects & plants (eg pollination)
🧪🌏🐙
An incredible example of how important electrostatic forces are for many insects & plants (eg pollination)
🧪🌏🐙

my first story back as a freelancer is a fun one: a quick hit for @science.org about the electrostatic tricks that parasitic worms take to infect their hosts... featuring very cool videos! 🧪

Bull’s-eye! Static electricity pulls worm through air to its insect victim
Electrostatic charges may help roundworms infect a wide variety of hosts
www.science.org
October 20, 2025 at 12:20 AM
These worms can jump up to 20 times their body length—the equivalent of a human jumping the height of an 11-story building—by riding on electrostatic charges 🪱⚡😮
An incredible example of how important electrostatic forces are for many insects & plants (eg pollination)
🧪🌏🐙
An incredible example of how important electrostatic forces are for many insects & plants (eg pollination)
🧪🌏🐙
🎉Congrats to 2025's Australian Bird of the Year, the Tawny Frogmouth (everyone's favourite tree-stump-that's-not-actually-a-tree-stump)! 🦉
Here's a map of where they've been recorded. Take a photo of the next tree stump you see, it might be a bird of the year!😉
🌏🧪📊 #rstats @birdlifeoz.bsky.social
Here's a map of where they've been recorded. Take a photo of the next tree stump you see, it might be a bird of the year!😉
🌏🧪📊 #rstats @birdlifeoz.bsky.social


October 17, 2025 at 6:23 AM
🎉Congrats to 2025's Australian Bird of the Year, the Tawny Frogmouth (everyone's favourite tree-stump-that's-not-actually-a-tree-stump)! 🦉
Here's a map of where they've been recorded. Take a photo of the next tree stump you see, it might be a bird of the year!😉
🌏🧪📊 #rstats @birdlifeoz.bsky.social
Here's a map of where they've been recorded. Take a photo of the next tree stump you see, it might be a bird of the year!😉
🌏🧪📊 #rstats @birdlifeoz.bsky.social
And of course a big benefit of joining a group like SORTEE is meeting other like-minded people who care about robust and transparent science. Many are on Bluesky!
If you’re a member and want to be added, send me a DM 😀 🧪🌏
go.bsky.app/44PpngU
If you’re a member and want to be added, send me a DM 😀 🧪🌏
go.bsky.app/44PpngU

October 15, 2025 at 12:26 PM
And of course a big benefit of joining a group like SORTEE is meeting other like-minded people who care about robust and transparent science. Many are on Bluesky!
If you’re a member and want to be added, send me a DM 😀 🧪🌏
go.bsky.app/44PpngU
If you’re a member and want to be added, send me a DM 😀 🧪🌏
go.bsky.app/44PpngU
Reposted by Dax Kellie

Looks like a good guide - the general data cleaning part is a lean intro to some very common issues in all sorts of data. Would be great if every phd who touches raw data was offered a short course in these basics (in R or Python or whatever HipsterScript) cleaning-data-r.ala.org.au/2_general-cl...
October 15, 2025 at 9:44 AM
Looks like a good guide - the general data cleaning part is a lean intro to some very common issues in all sorts of data. Would be great if every phd who touches raw data was offered a short course in these basics (in R or Python or whatever HipsterScript) cleaning-data-r.ala.org.au/2_general-cl...
Still want to make cleaning biodiversity data shrimp-ler? 🦐
Good news: We just updated our Cleaning Biodiversity Data in R book, so you still can! We've updated data for 2025, added new content & fixed lots of silly typos 😀
Live the shrimp-le life:
cleaning-data-r.ala.org.au
#rstats #ecology 🧪🌏
Good news: We just updated our Cleaning Biodiversity Data in R book, so you still can! We've updated data for 2025, added new content & fixed lots of silly typos 😀
Live the shrimp-le life:
cleaning-data-r.ala.org.au
#rstats #ecology 🧪🌏

October 15, 2025 at 4:12 AM
Still want to make cleaning biodiversity data shrimp-ler? 🦐
Good news: We just updated our Cleaning Biodiversity Data in R book, so you still can! We've updated data for 2025, added new content & fixed lots of silly typos 😀
Live the shrimp-le life:
cleaning-data-r.ala.org.au
#rstats #ecology 🧪🌏
Good news: We just updated our Cleaning Biodiversity Data in R book, so you still can! We've updated data for 2025, added new content & fixed lots of silly typos 😀
Live the shrimp-le life:
cleaning-data-r.ala.org.au
#rstats #ecology 🧪🌏
Was listening to D’Angelo just yesterday talking about how he’s one of the greats. Huge loss 💔 RIP
pitchfork.com/news/dangelo...
pitchfork.com/news/dangelo...

D’Angelo, Groundbreaking R&B Artist, Dies at 51
From his 1995 debut Brown Sugar to his 2014 comeback Black Messiah, he helped define the neo-soul movement
pitchfork.com
October 14, 2025 at 9:58 PM
Was listening to D’Angelo just yesterday talking about how he’s one of the greats. Huge loss 💔 RIP
pitchfork.com/news/dangelo...
pitchfork.com/news/dangelo...
Reposted by Dax Kellie

Southern emu wren is a good one for targeted conservation action too. It needs immediate saving from a tenth of it's habitat being converted to a rocket launching facility
October 14, 2025 at 4:18 AM
Southern emu wren is a good one for targeted conservation action too. It needs immediate saving from a tenth of it's habitat being converted to a rocket launching facility
Reposted by Dax Kellie

Vote now, if you haven't already, for the Guardian's Bird of the Year 2025
It helps to nominate a bird that's endangered, giving it a much higher profile - like Baudin's black cockatoo for example
Please vote - this is a wonderful environmental exercise
🙏🏽 🦜
www.theguardian.com/environment/...
It helps to nominate a bird that's endangered, giving it a much higher profile - like Baudin's black cockatoo for example
Please vote - this is a wonderful environmental exercise
🙏🏽 🦜
www.theguardian.com/environment/...

Australian bird of the year 2025: vote for your favourite #birdoftheyear in the Guardian / BirdLife Australia poll
From little penguins to (very big) cassowaries, every bird has its fans. Vote for your favourite in the 2025 Guardian/BirdLife Australia poll
www.theguardian.com
October 14, 2025 at 1:44 AM
Vote now, if you haven't already, for the Guardian's Bird of the Year 2025
It helps to nominate a bird that's endangered, giving it a much higher profile - like Baudin's black cockatoo for example
Please vote - this is a wonderful environmental exercise
🙏🏽 🦜
www.theguardian.com/environment/...
It helps to nominate a bird that's endangered, giving it a much higher profile - like Baudin's black cockatoo for example
Please vote - this is a wonderful environmental exercise
🙏🏽 🦜
www.theguardian.com/environment/...
Reposted by Dax Kellie

Field crickets (Gryllinae) aren't just plain brown chirping things in backyards - the group is actually pretty diverse, with >3,000 species. Maybe the weirdest are in the genus Sciobia, which all have these delightful Pikmin-like "hats" 🥺
📸: Sciobia barbara, Pierre-Henri Fabre
#EverydayEnsifera
📸: Sciobia barbara, Pierre-Henri Fabre
#EverydayEnsifera


October 12, 2025 at 4:52 AM
Field crickets (Gryllinae) aren't just plain brown chirping things in backyards - the group is actually pretty diverse, with >3,000 species. Maybe the weirdest are in the genus Sciobia, which all have these delightful Pikmin-like "hats" 🥺
📸: Sciobia barbara, Pierre-Henri Fabre
#EverydayEnsifera
📸: Sciobia barbara, Pierre-Henri Fabre
#EverydayEnsifera