


Keon Monroe
@monroek.bsky.social
- 🌍 geospatial dev & mapping enthusiast.
- 🐶&🌱dad.
- Philly living, climate action, tech, and ✊🏾👑🏳️🌈
kdmonroe.dev
- 🐶&🌱dad.
- Philly living, climate action, tech, and ✊🏾👑🏳️🌈
kdmonroe.dev
#30DayMapChallenge Day 25: Hexagons
Used DuckDB for spatial aggregation, GeoPandas for preprocessing, and pydeck's HexagonLayer with 3D extrusion to map global mangrove density and change (1996–2020). Data from Global Mangrove Watch
See the full map at shorturl.at/rpHxM
#Python #dataviz #mangroves
Used DuckDB for spatial aggregation, GeoPandas for preprocessing, and pydeck's HexagonLayer with 3D extrusion to map global mangrove density and change (1996–2020). Data from Global Mangrove Watch
See the full map at shorturl.at/rpHxM
#Python #dataviz #mangroves
November 26, 2025 at 3:38 AM
#30DayMapChallenge Day 25: Hexagons
Used DuckDB for spatial aggregation, GeoPandas for preprocessing, and pydeck's HexagonLayer with 3D extrusion to map global mangrove density and change (1996–2020). Data from Global Mangrove Watch
See the full map at shorturl.at/rpHxM
#Python #dataviz #mangroves
Used DuckDB for spatial aggregation, GeoPandas for preprocessing, and pydeck's HexagonLayer with 3D extrusion to map global mangrove density and change (1996–2020). Data from Global Mangrove Watch
See the full map at shorturl.at/rpHxM
#Python #dataviz #mangroves
Reposted by Keon Monroe

#30DayMapChallenge #30DayMapChallenge2025 #30DayMapChallengeRbanism #30DayMapChallengeR
Day 25: Hexagons
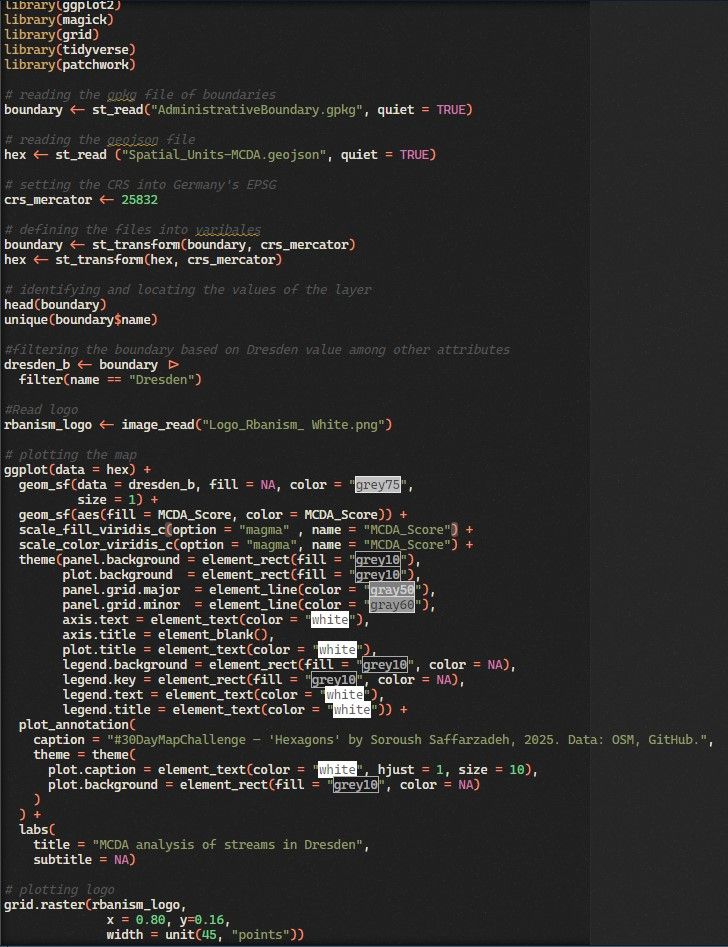
MCDA Analysis of Water Network in Dresden
by Soroush Saffarzadeh
#GeoData #rstats #DataViz #Maps #SpatialViz
Day 25: Hexagons
MCDA Analysis of Water Network in Dresden
by Soroush Saffarzadeh
#GeoData #rstats #DataViz #Maps #SpatialViz

November 25, 2025 at 8:39 AM
#30DayMapChallenge #30DayMapChallenge2025 #30DayMapChallengeRbanism #30DayMapChallengeR
Day 25: Hexagons
MCDA Analysis of Water Network in Dresden
by Soroush Saffarzadeh
#GeoData #rstats #DataViz #Maps #SpatialViz
Day 25: Hexagons
MCDA Analysis of Water Network in Dresden
by Soroush Saffarzadeh
#GeoData #rstats #DataViz #Maps #SpatialViz
Reposted by Keon Monroe

🗺️ Back with another map-making blog post! 🗺️
Learn how to make your own custom GPS route map entirely in #RStats 📊 Perfect timing whether you're looking for a #30DayMapChallenge idea, or planning a Christmas gift for your running friend 🎅
Link in comments 👇👇
#ggplot2 #DataViz #RSpatial
Learn how to make your own custom GPS route map entirely in #RStats 📊 Perfect timing whether you're looking for a #30DayMapChallenge idea, or planning a Christmas gift for your running friend 🎅
Link in comments 👇👇
#ggplot2 #DataViz #RSpatial

November 24, 2025 at 5:34 PM
🗺️ Back with another map-making blog post! 🗺️
Learn how to make your own custom GPS route map entirely in #RStats 📊 Perfect timing whether you're looking for a #30DayMapChallenge idea, or planning a Christmas gift for your running friend 🎅
Link in comments 👇👇
#ggplot2 #DataViz #RSpatial
Learn how to make your own custom GPS route map entirely in #RStats 📊 Perfect timing whether you're looking for a #30DayMapChallenge idea, or planning a Christmas gift for your running friend 🎅
Link in comments 👇👇
#ggplot2 #DataViz #RSpatial
#30DayMapChallenge Day 24 - Places and Their Names.
Say Their Names - A memorial Map of Lives Lost to Police Violence in America. Using data from mappingpoliceviolence.us. See the full map here - shorturl.at/8PKh8
Built w/ MapLibreJS. #MapLibre #Javascript #dataviz
Say Their Names - A memorial Map of Lives Lost to Police Violence in America. Using data from mappingpoliceviolence.us. See the full map here - shorturl.at/8PKh8
Built w/ MapLibreJS. #MapLibre #Javascript #dataviz
November 25, 2025 at 4:12 AM
#30DayMapChallenge Day 24 - Places and Their Names.
Say Their Names - A memorial Map of Lives Lost to Police Violence in America. Using data from mappingpoliceviolence.us. See the full map here - shorturl.at/8PKh8
Built w/ MapLibreJS. #MapLibre #Javascript #dataviz
Say Their Names - A memorial Map of Lives Lost to Police Violence in America. Using data from mappingpoliceviolence.us. See the full map here - shorturl.at/8PKh8
Built w/ MapLibreJS. #MapLibre #Javascript #dataviz
Reposted by Keon Monroe

🔊Using #GIS to visualise the impact of physical and human processes on coasts🌊
@oaknational.bsky.social lesson stepped explanation demonstrating #GIS integration at KS4 GCSE Geography for coastal erosion on Holderness peninsula UK
tinyurl.com/mwpn2229
#30DayMapChallenge Day 23: Process
@oaknational.bsky.social lesson stepped explanation demonstrating #GIS integration at KS4 GCSE Geography for coastal erosion on Holderness peninsula UK
tinyurl.com/mwpn2229
#30DayMapChallenge Day 23: Process
November 22, 2025 at 11:34 PM
🔊Using #GIS to visualise the impact of physical and human processes on coasts🌊
@oaknational.bsky.social lesson stepped explanation demonstrating #GIS integration at KS4 GCSE Geography for coastal erosion on Holderness peninsula UK
tinyurl.com/mwpn2229
#30DayMapChallenge Day 23: Process
@oaknational.bsky.social lesson stepped explanation demonstrating #GIS integration at KS4 GCSE Geography for coastal erosion on Holderness peninsula UK
tinyurl.com/mwpn2229
#30DayMapChallenge Day 23: Process
#30DayMapChallenge Day 18 - Out of This World
Using Python I mapped several active satellite constellations, including Starlink, the International Space Station, and more. Key tools used were Skyfield, Wheretheiss.at , and CelesTrack.
See the full map here - shorturl.at/uXDBh
#FOSS4G #Python
Using Python I mapped several active satellite constellations, including Starlink, the International Space Station, and more. Key tools used were Skyfield, Wheretheiss.at , and CelesTrack.
See the full map here - shorturl.at/uXDBh
#FOSS4G #Python
November 23, 2025 at 5:22 PM
#30DayMapChallenge Day 18 - Out of This World
Using Python I mapped several active satellite constellations, including Starlink, the International Space Station, and more. Key tools used were Skyfield, Wheretheiss.at , and CelesTrack.
See the full map here - shorturl.at/uXDBh
#FOSS4G #Python
Using Python I mapped several active satellite constellations, including Starlink, the International Space Station, and more. Key tools used were Skyfield, Wheretheiss.at , and CelesTrack.
See the full map here - shorturl.at/uXDBh
#FOSS4G #Python
#30DayMapChallenge Days 17 + 22 - A New Tool & Natural Earth Data.
Here's a population density map using DuckDB & Lonboard with Natural Earth data! Populated places are aggregated with the H3 library into hexbins. See the full map here - shorturl.at/jkZGi
#FOSS4G #DuckDB #Python #H3
Here's a population density map using DuckDB & Lonboard with Natural Earth data! Populated places are aggregated with the H3 library into hexbins. See the full map here - shorturl.at/jkZGi
#FOSS4G #DuckDB #Python #H3


November 23, 2025 at 5:12 PM
#30DayMapChallenge Days 17 + 22 - A New Tool & Natural Earth Data.
Here's a population density map using DuckDB & Lonboard with Natural Earth data! Populated places are aggregated with the H3 library into hexbins. See the full map here - shorturl.at/jkZGi
#FOSS4G #DuckDB #Python #H3
Here's a population density map using DuckDB & Lonboard with Natural Earth data! Populated places are aggregated with the H3 library into hexbins. See the full map here - shorturl.at/jkZGi
#FOSS4G #DuckDB #Python #H3
Reposted by Keon Monroe

#30DayMapsChallenge
Day 17: A new tool
Played around with #rayshader to look at Mont Rainier (Washington).
Day 17: A new tool
Played around with #rayshader to look at Mont Rainier (Washington).

November 17, 2025 at 4:33 PM
#30DayMapsChallenge
Day 17: A new tool
Played around with #rayshader to look at Mont Rainier (Washington).
Day 17: A new tool
Played around with #rayshader to look at Mont Rainier (Washington).
#30DayMapChallenge Day 16 - Cell
I made a binned heatmap of alternative fuel sources in the US (mostly electric charging stations but biodiesel, hydrogen + others are included). Darker colors indicate more in a given cell. See the full map here - shorturl.at/CSg3C
#ArcGIS #Javascript #dataviz
I made a binned heatmap of alternative fuel sources in the US (mostly electric charging stations but biodiesel, hydrogen + others are included). Darker colors indicate more in a given cell. See the full map here - shorturl.at/CSg3C
#ArcGIS #Javascript #dataviz


November 17, 2025 at 12:00 AM
#30DayMapChallenge Day 16 - Cell
I made a binned heatmap of alternative fuel sources in the US (mostly electric charging stations but biodiesel, hydrogen + others are included). Darker colors indicate more in a given cell. See the full map here - shorturl.at/CSg3C
#ArcGIS #Javascript #dataviz
I made a binned heatmap of alternative fuel sources in the US (mostly electric charging stations but biodiesel, hydrogen + others are included). Darker colors indicate more in a given cell. See the full map here - shorturl.at/CSg3C
#ArcGIS #Javascript #dataviz
#30DayMapChallenge Day 15 - Fire
I redesigned an existing map of US Wildfires with Firefly cartography in mind, and added a timeline slider at the bottom. Made w/ ArcGIS JS. See active + historic wildfire incidents on the full map here - shorturl.at/0lqGq
#ArcGIS #Javascript #dataviz
I redesigned an existing map of US Wildfires with Firefly cartography in mind, and added a timeline slider at the bottom. Made w/ ArcGIS JS. See active + historic wildfire incidents on the full map here - shorturl.at/0lqGq
#ArcGIS #Javascript #dataviz
November 16, 2025 at 3:39 AM
#30DayMapChallenge Day 15 - Fire
I redesigned an existing map of US Wildfires with Firefly cartography in mind, and added a timeline slider at the bottom. Made w/ ArcGIS JS. See active + historic wildfire incidents on the full map here - shorturl.at/0lqGq
#ArcGIS #Javascript #dataviz
I redesigned an existing map of US Wildfires with Firefly cartography in mind, and added a timeline slider at the bottom. Made w/ ArcGIS JS. See active + historic wildfire incidents on the full map here - shorturl.at/0lqGq
#ArcGIS #Javascript #dataviz
Reposted by Keon Monroe


November 16, 2025 at 12:15 AM
Reposted by Keon Monroe

NEW: New Jersey’s township data is (mostly) in, so
@shanegoldmacher.bsky.social & I crunched the numbers on NJ’s blue shift/pendulum swing
The same majority-Hispanic cities & towns that swung to Trump in 24 shifted back D, to Mikie Sherrill, in the governor’s race
www.nytimes.com/2025/11/15/u...
@shanegoldmacher.bsky.social & I crunched the numbers on NJ’s blue shift/pendulum swing
The same majority-Hispanic cities & towns that swung to Trump in 24 shifted back D, to Mikie Sherrill, in the governor’s race
www.nytimes.com/2025/11/15/u...

Maps Show How Latinos Who Shifted Right in 2024 Snapped Back Left in 2025
www.nytimes.com
November 15, 2025 at 3:15 PM
NEW: New Jersey’s township data is (mostly) in, so
@shanegoldmacher.bsky.social & I crunched the numbers on NJ’s blue shift/pendulum swing
The same majority-Hispanic cities & towns that swung to Trump in 24 shifted back D, to Mikie Sherrill, in the governor’s race
www.nytimes.com/2025/11/15/u...
@shanegoldmacher.bsky.social & I crunched the numbers on NJ’s blue shift/pendulum swing
The same majority-Hispanic cities & towns that swung to Trump in 24 shifted back D, to Mikie Sherrill, in the governor’s race
www.nytimes.com/2025/11/15/u...
Day 14. OpenStreetMap.
Explore 8 different types of amenities worldwide using OpenStreetMap data! Made with ArcGIS Javascript and Overpass API. See the full map here - shorturl.at/ByTUR #30DayMapChallenge #OpenStreetMap #ArcGIS
Explore 8 different types of amenities worldwide using OpenStreetMap data! Made with ArcGIS Javascript and Overpass API. See the full map here - shorturl.at/ByTUR #30DayMapChallenge #OpenStreetMap #ArcGIS
November 15, 2025 at 3:48 AM
Day 14. OpenStreetMap.
Explore 8 different types of amenities worldwide using OpenStreetMap data! Made with ArcGIS Javascript and Overpass API. See the full map here - shorturl.at/ByTUR #30DayMapChallenge #OpenStreetMap #ArcGIS
Explore 8 different types of amenities worldwide using OpenStreetMap data! Made with ArcGIS Javascript and Overpass API. See the full map here - shorturl.at/ByTUR #30DayMapChallenge #OpenStreetMap #ArcGIS

Reposted by Keon Monroe

In the global electrification race China is marching ahead.
The US and Europe risk falling behind clinging on to yesterday's technologies.
The US and Europe risk falling behind clinging on to yesterday's technologies.

November 14, 2025 at 1:51 PM
In the global electrification race China is marching ahead.
The US and Europe risk falling behind clinging on to yesterday's technologies.
The US and Europe risk falling behind clinging on to yesterday's technologies.
Thanks again to all Richmond alum who came to the Paint & Sip event last week! 🕷️ #LGBTQSpiders #PhiladelphiaSpiders #UR

November 14, 2025 at 2:47 AM
Thanks again to all Richmond alum who came to the Paint & Sip event last week! 🕷️ #LGBTQSpiders #PhiladelphiaSpiders #UR
Reposted by Keon Monroe

Topology and geometry can solve many of life’s woes. Here Dr. Roland Fryer, Professor of economics at Harvard University and NY Times Contributor, shares simple transparent process that uses #geometry to solve our #gerrymandering problem. www.nytimes.com/2025/08/12/o...

Opinion | Geometry Solves Gerrymandering
www.nytimes.com
August 12, 2025 at 12:17 PM
Topology and geometry can solve many of life’s woes. Here Dr. Roland Fryer, Professor of economics at Harvard University and NY Times Contributor, shares simple transparent process that uses #geometry to solve our #gerrymandering problem. www.nytimes.com/2025/08/12/o...
Reposted by Keon Monroe

What was the weather like on your birthday? Now you can find out!
During the shutdown, I forced myself to stay agile in data science tech, like AWS, Google, and Open AI.
I made a notebook that gets weather for the day/location of your birth, using multiple NOAA sources.
github.com/jjrennie/bir...
During the shutdown, I forced myself to stay agile in data science tech, like AWS, Google, and Open AI.
I made a notebook that gets weather for the day/location of your birth, using multiple NOAA sources.
github.com/jjrennie/bir...


November 13, 2025 at 8:13 PM
What was the weather like on your birthday? Now you can find out!
During the shutdown, I forced myself to stay agile in data science tech, like AWS, Google, and Open AI.
I made a notebook that gets weather for the day/location of your birth, using multiple NOAA sources.
github.com/jjrennie/bir...
During the shutdown, I forced myself to stay agile in data science tech, like AWS, Google, and Open AI.
I made a notebook that gets weather for the day/location of your birth, using multiple NOAA sources.
github.com/jjrennie/bir...
Day 13. 10 min map.
Here are some town maps from Cities Skylines 2. It typically takes me around ten minutes to build out a new road network and connect it to existing infrastructure, zone, etc... Highly recommend if you're into city builder games! #30DayMapChallenge #CitiesSkylines
Here are some town maps from Cities Skylines 2. It typically takes me around ten minutes to build out a new road network and connect it to existing infrastructure, zone, etc... Highly recommend if you're into city builder games! #30DayMapChallenge #CitiesSkylines


November 13, 2025 at 11:38 PM
Day 13. 10 min map.
Here are some town maps from Cities Skylines 2. It typically takes me around ten minutes to build out a new road network and connect it to existing infrastructure, zone, etc... Highly recommend if you're into city builder games! #30DayMapChallenge #CitiesSkylines
Here are some town maps from Cities Skylines 2. It typically takes me around ten minutes to build out a new road network and connect it to existing infrastructure, zone, etc... Highly recommend if you're into city builder games! #30DayMapChallenge #CitiesSkylines
Reposted by Keon Monroe

A 2125 cyberpunk theme for Tokyo, visualized in 3D with
@mapbox.com.
#30DayMapChallenge Day 12: Map from 2125
The brand-new `palette_to_lut()` function in #rstats mapgl helps you create a custom LUT from any colors.
@mapbox.com.
#30DayMapChallenge Day 12: Map from 2125
The brand-new `palette_to_lut()` function in #rstats mapgl helps you create a custom LUT from any colors.
November 12, 2025 at 3:20 PM
A 2125 cyberpunk theme for Tokyo, visualized in 3D with
@mapbox.com.
#30DayMapChallenge Day 12: Map from 2125
The brand-new `palette_to_lut()` function in #rstats mapgl helps you create a custom LUT from any colors.
@mapbox.com.
#30DayMapChallenge Day 12: Map from 2125
The brand-new `palette_to_lut()` function in #rstats mapgl helps you create a custom LUT from any colors.
Day 12. Map from 2125. Using NOAA data, I created a map of projected sea level rise in the DC/Chesapeake Bay area. Featuring an automated timeline to sync with the sea level data. #30DayMapChallenge #MapLibre #JavaScript #dataviz #climatechange #FOSS4G See the full map here - shorturl.at/5U6Uz

November 13, 2025 at 4:30 AM
Day 12. Map from 2125. Using NOAA data, I created a map of projected sea level rise in the DC/Chesapeake Bay area. Featuring an automated timeline to sync with the sea level data. #30DayMapChallenge #MapLibre #JavaScript #dataviz #climatechange #FOSS4G See the full map here - shorturl.at/5U6Uz
Another November, another month of maps! Day 11 is minimal map - here's a quick one using MapLibre! Although simple it is functional, returning the coordinates anywhere you click. #30DayMapChallenge #MapLibre #Javascript See the full map here - shorturl.at/3aukp
November 12, 2025 at 5:10 AM
Another November, another month of maps! Day 11 is minimal map - here's a quick one using MapLibre! Although simple it is functional, returning the coordinates anywhere you click. #30DayMapChallenge #MapLibre #Javascript See the full map here - shorturl.at/3aukp
Reposted by Keon Monroe

Breaking News: The EPA moved to stop requiring polluters to report their emissions of greenhouse gases. The proposal would end a key tool the government uses to track carbon dioxide, methane and other gases that are driving climate change.

E.P.A. to Stop Collecting Emissions Data From Polluters
The data, from thousands of coal-burning power plants, oil refineries, steel mills and other industrial facilities, is the country’s most comprehensive way to track greenhouse gases.
nyti.ms
September 12, 2025 at 7:37 PM
Breaking News: The EPA moved to stop requiring polluters to report their emissions of greenhouse gases. The proposal would end a key tool the government uses to track carbon dioxide, methane and other gases that are driving climate change.
April 26, 2025 at 11:14 PM
Happy Saturday BlueSky! Happy 1st post to me!
April 26, 2025 at 10:28 PM
Happy Saturday BlueSky! Happy 1st post to me!