


Marcelo Caffera
@marcelocaffera.bsky.social
Environmental Economist.
University of Montevideo, Uruguay.
University of Montevideo, Uruguay.
Reposted by Marcelo Caffera
Carbon pricing is one of our best assets for the climate.
Over 80 countries now have a carbon price.
Today we launch the Open Coalition on Compliance Carbon Market.
Together with Brazil and other partners, let’s do it right, and let’s do it together.
Over 80 countries now have a carbon price.
Today we launch the Open Coalition on Compliance Carbon Market.
Together with Brazil and other partners, let’s do it right, and let’s do it together.

November 7, 2025 at 5:13 PM
Carbon pricing is one of our best assets for the climate.
Over 80 countries now have a carbon price.
Today we launch the Open Coalition on Compliance Carbon Market.
Together with Brazil and other partners, let’s do it right, and let’s do it together.
Over 80 countries now have a carbon price.
Today we launch the Open Coalition on Compliance Carbon Market.
Together with Brazil and other partners, let’s do it right, and let’s do it together.
Reposted by Marcelo Caffera

🌏#WCERE2026 CALL FOR PARTICIPTION GRANTS🌎
🍃 The 𝟳𝘁𝗵 𝗪𝗼𝗿𝗹𝗱 𝗖𝗼𝗻𝗴𝗿𝗲𝘀𝘀 𝗼𝗳 𝗘𝗻𝘃𝗶𝗿𝗼𝗻𝗺𝗲𝗻𝘁𝗮𝗹 𝗮𝗻𝗱 𝗥𝗲𝘀𝗼𝘂𝗿𝗰𝗲 𝗘𝗰𝗼𝗻𝗼𝗺𝗶𝘀𝘁𝘀 will take place from 29th June to 3rd July 2026 in Carcavelos, Portugal.
👉 Participation grants are available. Access the call at wcere2026.org/index.php/pa... and apply by JAN 16, 2026⏰
🍃 The 𝟳𝘁𝗵 𝗪𝗼𝗿𝗹𝗱 𝗖𝗼𝗻𝗴𝗿𝗲𝘀𝘀 𝗼𝗳 𝗘𝗻𝘃𝗶𝗿𝗼𝗻𝗺𝗲𝗻𝘁𝗮𝗹 𝗮𝗻𝗱 𝗥𝗲𝘀𝗼𝘂𝗿𝗰𝗲 𝗘𝗰𝗼𝗻𝗼𝗺𝗶𝘀𝘁𝘀 will take place from 29th June to 3rd July 2026 in Carcavelos, Portugal.
👉 Participation grants are available. Access the call at wcere2026.org/index.php/pa... and apply by JAN 16, 2026⏰

October 27, 2025 at 12:07 PM
🌏#WCERE2026 CALL FOR PARTICIPTION GRANTS🌎
🍃 The 𝟳𝘁𝗵 𝗪𝗼𝗿𝗹𝗱 𝗖𝗼𝗻𝗴𝗿𝗲𝘀𝘀 𝗼𝗳 𝗘𝗻𝘃𝗶𝗿𝗼𝗻𝗺𝗲𝗻𝘁𝗮𝗹 𝗮𝗻𝗱 𝗥𝗲𝘀𝗼𝘂𝗿𝗰𝗲 𝗘𝗰𝗼𝗻𝗼𝗺𝗶𝘀𝘁𝘀 will take place from 29th June to 3rd July 2026 in Carcavelos, Portugal.
👉 Participation grants are available. Access the call at wcere2026.org/index.php/pa... and apply by JAN 16, 2026⏰
🍃 The 𝟳𝘁𝗵 𝗪𝗼𝗿𝗹𝗱 𝗖𝗼𝗻𝗴𝗿𝗲𝘀𝘀 𝗼𝗳 𝗘𝗻𝘃𝗶𝗿𝗼𝗻𝗺𝗲𝗻𝘁𝗮𝗹 𝗮𝗻𝗱 𝗥𝗲𝘀𝗼𝘂𝗿𝗰𝗲 𝗘𝗰𝗼𝗻𝗼𝗺𝗶𝘀𝘁𝘀 will take place from 29th June to 3rd July 2026 in Carcavelos, Portugal.
👉 Participation grants are available. Access the call at wcere2026.org/index.php/pa... and apply by JAN 16, 2026⏰
Reposted by Marcelo Caffera
🍃The 𝟳𝘁𝗵 𝗪𝗼𝗿𝗹𝗱 𝗖𝗼𝗻𝗴𝗿𝗲𝘀𝘀 𝗼𝗳 𝗘𝗻𝘃𝗶𝗿𝗼𝗻𝗺𝗲𝗻𝘁𝗮𝗹 𝗮𝗻𝗱 𝗥𝗲𝘀𝗼𝘂𝗿𝗰𝗲 𝗘𝗰𝗼𝗻𝗼𝗺𝗶𝘀𝘁𝘀 will take place from 29th June to 3rd July 2026 in Carcavelos-Cascais, Portugal. #WCERE2026 is hosted by the Nova School of Business and Economics.
👀Discover the keynote speakers and access the calls for contributions at wcere2026.org
👀Discover the keynote speakers and access the calls for contributions at wcere2026.org


October 1, 2025 at 11:01 AM
🍃The 𝟳𝘁𝗵 𝗪𝗼𝗿𝗹𝗱 𝗖𝗼𝗻𝗴𝗿𝗲𝘀𝘀 𝗼𝗳 𝗘𝗻𝘃𝗶𝗿𝗼𝗻𝗺𝗲𝗻𝘁𝗮𝗹 𝗮𝗻𝗱 𝗥𝗲𝘀𝗼𝘂𝗿𝗰𝗲 𝗘𝗰𝗼𝗻𝗼𝗺𝗶𝘀𝘁𝘀 will take place from 29th June to 3rd July 2026 in Carcavelos-Cascais, Portugal. #WCERE2026 is hosted by the Nova School of Business and Economics.
👀Discover the keynote speakers and access the calls for contributions at wcere2026.org
👀Discover the keynote speakers and access the calls for contributions at wcere2026.org
Reposted by Marcelo Caffera
📢 Come and work with us!
We're looking to recruit an Assistant Professor in Biodiversity Economics
Application Deadline: 26 October 2025
More details here: jobs.lse.ac.uk/Vacancies/W/12…
Please share
We're looking to recruit an Assistant Professor in Biodiversity Economics
Application Deadline: 26 October 2025
More details here: jobs.lse.ac.uk/Vacancies/W/12…
Please share
https://jobs.lse.ac.uk/Vacancies/W/12…
September 25, 2025 at 10:21 AM
📢 Come and work with us!
We're looking to recruit an Assistant Professor in Biodiversity Economics
Application Deadline: 26 October 2025
More details here: jobs.lse.ac.uk/Vacancies/W/12…
Please share
We're looking to recruit an Assistant Professor in Biodiversity Economics
Application Deadline: 26 October 2025
More details here: jobs.lse.ac.uk/Vacancies/W/12…
Please share
Reposted by Marcelo Caffera
💻The recording of the webinar "𝗧𝗵𝗲 𝗽𝗼𝗹𝗶𝘁𝗶𝗰𝗮𝗹 𝗲𝗰𝗼𝗻𝗼𝗺𝘆 𝗼𝗳 𝗰𝗮𝗿𝗯𝗼𝗻 𝗽𝗿𝗶𝗰𝗶𝗻𝗴" is now available on the WCEREA's YouTube channel!
📑 Read the report of the event and access the panelists' slides at www.eaere.org/policy/econo...
🎥 Watch or re-watch the webinar at www.youtube.com/watch?v=3S3I...
📑 Read the report of the event and access the panelists' slides at www.eaere.org/policy/econo...
🎥 Watch or re-watch the webinar at www.youtube.com/watch?v=3S3I...

September 17, 2025 at 12:30 PM
💻The recording of the webinar "𝗧𝗵𝗲 𝗽𝗼𝗹𝗶𝘁𝗶𝗰𝗮𝗹 𝗲𝗰𝗼𝗻𝗼𝗺𝘆 𝗼𝗳 𝗰𝗮𝗿𝗯𝗼𝗻 𝗽𝗿𝗶𝗰𝗶𝗻𝗴" is now available on the WCEREA's YouTube channel!
📑 Read the report of the event and access the panelists' slides at www.eaere.org/policy/econo...
🎥 Watch or re-watch the webinar at www.youtube.com/watch?v=3S3I...
📑 Read the report of the event and access the panelists' slides at www.eaere.org/policy/econo...
🎥 Watch or re-watch the webinar at www.youtube.com/watch?v=3S3I...
Reposted by Marcelo Caffera
🌍💡 Join the WCEREA Webinar on The Political Economy of Carbon Pricing
📅 Sept 9, 2025
⏰ 9:00–10:30 am Pacific Time | Online
Speakers: @bardharstad.bsky.social, @profjeroenbergh.bsky.social, @cwolfram.bsky.social
Moderator: @marcelocaffera.bsky.social
🔗 a1d0g2.emailsp.com/f/rnl.aspx/?...
📅 Sept 9, 2025
⏰ 9:00–10:30 am Pacific Time | Online
Speakers: @bardharstad.bsky.social, @profjeroenbergh.bsky.social, @cwolfram.bsky.social
Moderator: @marcelocaffera.bsky.social
🔗 a1d0g2.emailsp.com/f/rnl.aspx/?...

August 27, 2025 at 3:08 AM
🌍💡 Join the WCEREA Webinar on The Political Economy of Carbon Pricing
📅 Sept 9, 2025
⏰ 9:00–10:30 am Pacific Time | Online
Speakers: @bardharstad.bsky.social, @profjeroenbergh.bsky.social, @cwolfram.bsky.social
Moderator: @marcelocaffera.bsky.social
🔗 a1d0g2.emailsp.com/f/rnl.aspx/?...
📅 Sept 9, 2025
⏰ 9:00–10:30 am Pacific Time | Online
Speakers: @bardharstad.bsky.social, @profjeroenbergh.bsky.social, @cwolfram.bsky.social
Moderator: @marcelocaffera.bsky.social
🔗 a1d0g2.emailsp.com/f/rnl.aspx/?...
**Reminder**: The call for papers for the RIDGE Environmental Economics Workshop is still open.
December 8–9, Montevideo.
The deadline for submission is September 8, 2025.
More info here: ridge.org.uy/wp-content/u...
December 8–9, Montevideo.
The deadline for submission is September 8, 2025.
More info here: ridge.org.uy/wp-content/u...

August 6, 2025 at 5:21 PM
**Reminder**: The call for papers for the RIDGE Environmental Economics Workshop is still open.
December 8–9, Montevideo.
The deadline for submission is September 8, 2025.
More info here: ridge.org.uy/wp-content/u...
December 8–9, Montevideo.
The deadline for submission is September 8, 2025.
More info here: ridge.org.uy/wp-content/u...
Reposted by Marcelo Caffera
🌎 Reminder: 𝐖𝐂𝐄𝐑𝐄𝐀 𝐰𝐞𝐛𝐢𝐧𝐚𝐫 𝐨𝐧 "𝐓𝐡𝐞 𝐩𝐨𝐥𝐢𝐭𝐢𝐜𝐚𝐥 𝐞𝐜𝐨𝐧𝐨𝐦𝐲 𝐨𝐟 𝐜𝐚𝐫𝐛𝐨𝐧 𝐩𝐫𝐢𝐜𝐢𝐧𝐠"🌎
📅 September 9, 2025
🕘 9:00 - 10:30 am Pacific Time
👉 REGISTER AT cmcc-it.zoom.us/webinar/regi...
🔗 More info: www.eaere.org/events/suppo...
@aereorg.bsky.social
@aares-org.bsky.social
📅 September 9, 2025
🕘 9:00 - 10:30 am Pacific Time
👉 REGISTER AT cmcc-it.zoom.us/webinar/regi...
🔗 More info: www.eaere.org/events/suppo...
@aereorg.bsky.social
@aares-org.bsky.social

July 22, 2025 at 9:08 AM
🌎 Reminder: 𝐖𝐂𝐄𝐑𝐄𝐀 𝐰𝐞𝐛𝐢𝐧𝐚𝐫 𝐨𝐧 "𝐓𝐡𝐞 𝐩𝐨𝐥𝐢𝐭𝐢𝐜𝐚𝐥 𝐞𝐜𝐨𝐧𝐨𝐦𝐲 𝐨𝐟 𝐜𝐚𝐫𝐛𝐨𝐧 𝐩𝐫𝐢𝐜𝐢𝐧𝐠"🌎
📅 September 9, 2025
🕘 9:00 - 10:30 am Pacific Time
👉 REGISTER AT cmcc-it.zoom.us/webinar/regi...
🔗 More info: www.eaere.org/events/suppo...
@aereorg.bsky.social
@aares-org.bsky.social
📅 September 9, 2025
🕘 9:00 - 10:30 am Pacific Time
👉 REGISTER AT cmcc-it.zoom.us/webinar/regi...
🔗 More info: www.eaere.org/events/suppo...
@aereorg.bsky.social
@aares-org.bsky.social
“… one day I realized that all we were doing with all these scientific papers we were writing, we were saying the same thing, that we were killing ocean life”.

Bringing the ocean back to life with Enric Sala
Podcast Episode · Rewilding the World with Ben Goldsmith · 02/07/2025 · 35m
podcasts.apple.com
July 12, 2025 at 12:42 PM
“… one day I realized that all we were doing with all these scientific papers we were writing, we were saying the same thing, that we were killing ocean life”.
Reposted by Marcelo Caffera

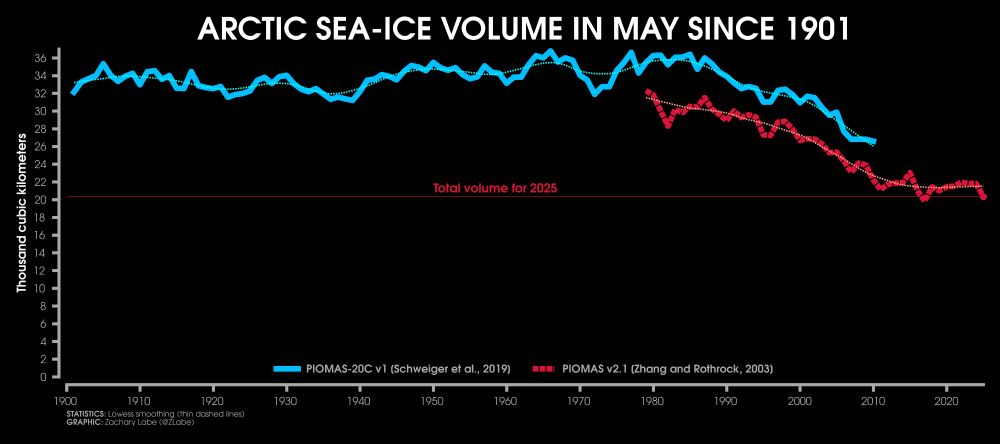
Changes in May #Arctic sea ice volume since the year 1901...
Comparison between PIOMAS-20C and PIOMAS data sets now updated through 2025 with data information available at doi.org/10.1175/JCLI.... This graphic is available at zacklabe.com/arctic-sea-i....
Comparison between PIOMAS-20C and PIOMAS data sets now updated through 2025 with data information available at doi.org/10.1175/JCLI.... This graphic is available at zacklabe.com/arctic-sea-i....
June 29, 2025 at 2:30 PM
Changes in May #Arctic sea ice volume since the year 1901...
Comparison between PIOMAS-20C and PIOMAS data sets now updated through 2025 with data information available at doi.org/10.1175/JCLI.... This graphic is available at zacklabe.com/arctic-sea-i....
Comparison between PIOMAS-20C and PIOMAS data sets now updated through 2025 with data information available at doi.org/10.1175/JCLI.... This graphic is available at zacklabe.com/arctic-sea-i....
Reposted by Marcelo Caffera
Those were the days

June 29, 2025 at 3:08 PM
Those were the days
Reposted by Marcelo Caffera
As announced during #EAERE2025 closing session, many initiatives are ahead of us!
🌎 Join the webinar on "𝗧𝗵𝗲 𝗣𝗼𝗹𝗶𝘁𝗶𝗰𝗮𝗹 𝗘𝗰𝗼𝗻𝗼𝗺𝘆 𝗼𝗳 𝗖𝗮𝗿𝗯𝗼𝗻 𝗣𝗿𝗶𝗰𝗶𝗻𝗴" by the #WCEREA - World Council of Environmental and Resource Economists Associations. Together with its sister associations, #EAERE is part of the WCEREA
🌎 Join the webinar on "𝗧𝗵𝗲 𝗣𝗼𝗹𝗶𝘁𝗶𝗰𝗮𝗹 𝗘𝗰𝗼𝗻𝗼𝗺𝘆 𝗼𝗳 𝗖𝗮𝗿𝗯𝗼𝗻 𝗣𝗿𝗶𝗰𝗶𝗻𝗴" by the #WCEREA - World Council of Environmental and Resource Economists Associations. Together with its sister associations, #EAERE is part of the WCEREA
June 21, 2025 at 8:44 AM
As announced during #EAERE2025 closing session, many initiatives are ahead of us!
🌎 Join the webinar on "𝗧𝗵𝗲 𝗣𝗼𝗹𝗶𝘁𝗶𝗰𝗮𝗹 𝗘𝗰𝗼𝗻𝗼𝗺𝘆 𝗼𝗳 𝗖𝗮𝗿𝗯𝗼𝗻 𝗣𝗿𝗶𝗰𝗶𝗻𝗴" by the #WCEREA - World Council of Environmental and Resource Economists Associations. Together with its sister associations, #EAERE is part of the WCEREA
🌎 Join the webinar on "𝗧𝗵𝗲 𝗣𝗼𝗹𝗶𝘁𝗶𝗰𝗮𝗹 𝗘𝗰𝗼𝗻𝗼𝗺𝘆 𝗼𝗳 𝗖𝗮𝗿𝗯𝗼𝗻 𝗣𝗿𝗶𝗰𝗶𝗻𝗴" by the #WCEREA - World Council of Environmental and Resource Economists Associations. Together with its sister associations, #EAERE is part of the WCEREA
Do not miss this one!
📅 September 9, 2025
🕘 9:00 - 10:30 am Pacific Time
📍 Online on Zoom
🔗 Register at cmcc-it.zoom.us/webinar/regi...
Save the date and register!
#politicaleconomy #carbonpricing
🕘 9:00 - 10:30 am Pacific Time
📍 Online on Zoom
🔗 Register at cmcc-it.zoom.us/webinar/regi...
Save the date and register!
#politicaleconomy #carbonpricing
June 24, 2025 at 10:51 PM
Do not miss this one!
Reposted by Marcelo Caffera
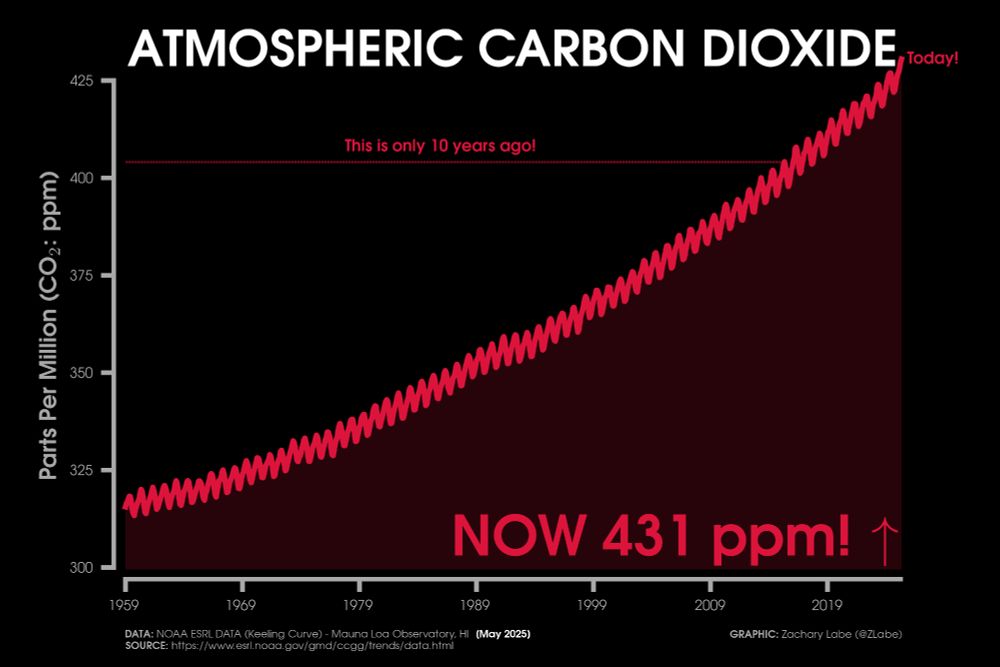
🚨 Carbon dioxide (CO₂) levels set a new monthly *record high* in May 2025 - 430.51 ppm (seasonal maximum)
This is the second largest May-May increase in this dataset (3.6 ppm higher than 2024). This is not good... 🫣
Data from gml.noaa.gov/ccgg/trends/
This is the second largest May-May increase in this dataset (3.6 ppm higher than 2024). This is not good... 🫣
Data from gml.noaa.gov/ccgg/trends/
June 7, 2025 at 1:57 PM
🚨 Carbon dioxide (CO₂) levels set a new monthly *record high* in May 2025 - 430.51 ppm (seasonal maximum)
This is the second largest May-May increase in this dataset (3.6 ppm higher than 2024). This is not good... 🫣
Data from gml.noaa.gov/ccgg/trends/
This is the second largest May-May increase in this dataset (3.6 ppm higher than 2024). This is not good... 🫣
Data from gml.noaa.gov/ccgg/trends/
I think Miliband is right in pointing out that we have made progress and the biggest reason why is the profit motive.
Part 2 of our @restispoliticsus.bsky.social LEADING with Ed Miliband - life after losing and why he thinks the net zero battle can and must be won alastaircampbell.org/2025/05/136-...

136. Ed Miliband: Farage, Starmer and The Fight for Net Zero (Part 2)
How did Ed Miliband recover from Labour’s 2015 defeat and decide to remain in politics? Can the Energy Secretary win the argument for Net Zero against the likes of Tony Blair and Nigel Farage? Is it p...
alastaircampbell.org
May 30, 2025 at 11:14 AM
I think Miliband is right in pointing out that we have made progress and the biggest reason why is the profit motive.
Reposted by Marcelo Caffera
Nice proposal! While some countries are tempted to profit from the sacrifices of others [ahem!] without making any themselves, Boyer and Gollier propose that the EU and Canada unite to set a single price for carbon and impose a tax at their borders on external countries that avoid this constraint.

« L’Union européenne et le Canada devraient nouer une coalition climatique pour sauver l’accord de Paris »
TRIBUNE. Alors que certains pays sont tentés de profiter des sacrifices des autres sans en faire eux-mêmes, les économistes Marcel Boyer et Christian Gollier suggèrent, dans une tribune au « Monde », ...
www.lemonde.fr
April 13, 2025 at 5:32 PM
Nice proposal! While some countries are tempted to profit from the sacrifices of others [ahem!] without making any themselves, Boyer and Gollier propose that the EU and Canada unite to set a single price for carbon and impose a tax at their borders on external countries that avoid this constraint.
Reposted by Marcelo Caffera
We’re probably at the stage where an asteroid hitting Washington DC and decapitating the US federal government would make the stock markets go up
April 7, 2025 at 3:54 PM
We’re probably at the stage where an asteroid hitting Washington DC and decapitating the US federal government would make the stock markets go up
For environmental political economy nerds: a yellow vest hangs in a window, at the French consulate in London.

April 2, 2025 at 11:07 AM
For environmental political economy nerds: a yellow vest hangs in a window, at the French consulate in London.
Juan Pablo Rud Keynote presentation kicks off the congress of LAERE. Can windfall government transfers from mining royalties (“Canon”) boost local economic activity?

March 20, 2025 at 2:15 PM
Juan Pablo Rud Keynote presentation kicks off the congress of LAERE. Can windfall government transfers from mining royalties (“Canon”) boost local economic activity?
Reposted by Marcelo Caffera
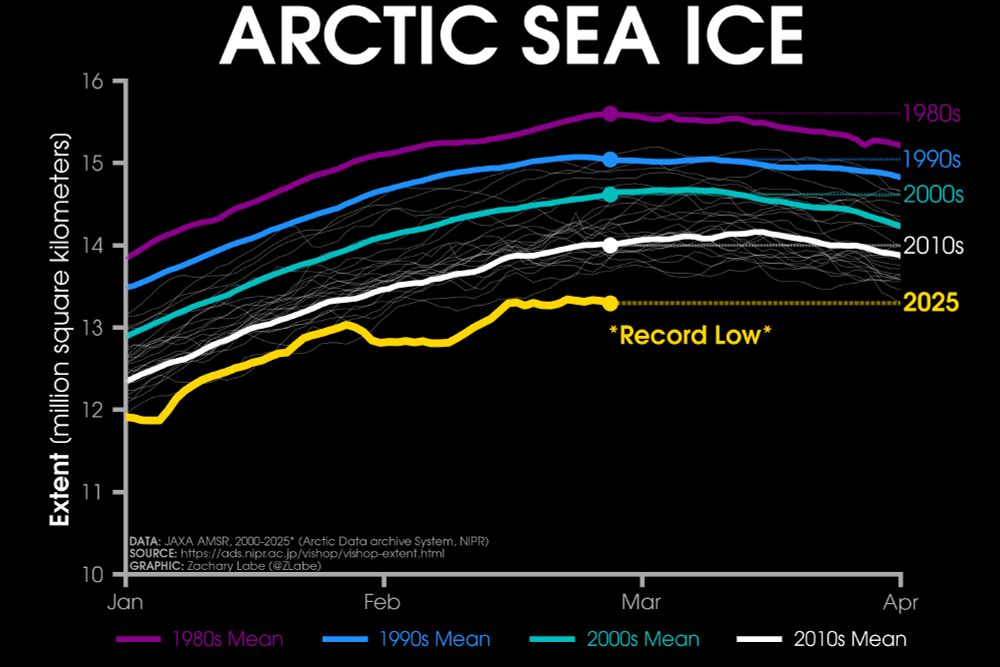
In the next few days, I will be sharing some of our work that I am most proud of from my time at NOAA/GFDL. But I would also like a little normalcy today on my feed, so here's my go-to sea ice data viz update.
#Arctic sea ice extent still remains the *lowest* on record for the date (JAXA). Not good
#Arctic sea ice extent still remains the *lowest* on record for the date (JAXA). Not good
March 1, 2025 at 12:01 AM
In the next few days, I will be sharing some of our work that I am most proud of from my time at NOAA/GFDL. But I would also like a little normalcy today on my feed, so here's my go-to sea ice data viz update.
#Arctic sea ice extent still remains the *lowest* on record for the date (JAXA). Not good
#Arctic sea ice extent still remains the *lowest* on record for the date (JAXA). Not good
Amazing.
The reasons I was given:
-> I did not demonstrate that my work was in the public interest, and my ability, knowledge and/or skills did not match NOAA's needs.
More soon. It will be okay.
-> I did not demonstrate that my work was in the public interest, and my ability, knowledge and/or skills did not match NOAA's needs.
More soon. It will be okay.
February 28, 2025 at 2:31 AM
Amazing.

Great paper by @tbourany.bsky.social . IAM with heterogeneous countries and international trade. Optimal climate agreement has incomplete participation, tax lower than SCC and substantial tariffs on non members.

February 7, 2025 at 12:04 AM
Great paper by @tbourany.bsky.social . IAM with heterogeneous countries and international trade. Optimal climate agreement has incomplete participation, tax lower than SCC and substantial tariffs on non members.