Occasional climate scientist, diagram monkey, probabilistic historian, science anti-communicator. All views and opinions are my own. This is not, sadly, a promise of novelty: it’s a disclaimer. He/him. https://www.jkclimate.fr/ .. more
Occasional climate scientist, diagram monkey, probabilistic historian, science anti-communicator. All views and opinions are my own. This is not, sadly, a promise of novelty: it’s a disclaimer. He/him. https://www.jkclimate.fr/
Reposted by John Kennedy
If you're not, listen to this.
Get a guitar or some drums, or a trumpet. Pick up a brush, a pencil, some clay or a welder.
Just make shit. It doesn't have to be good (eventually it will be) just make music, art or write or whatever.
It's literally never been more important.

diagrammonkey.wordpress.com/2025/06/28/w...
Reposted by John Kennedy

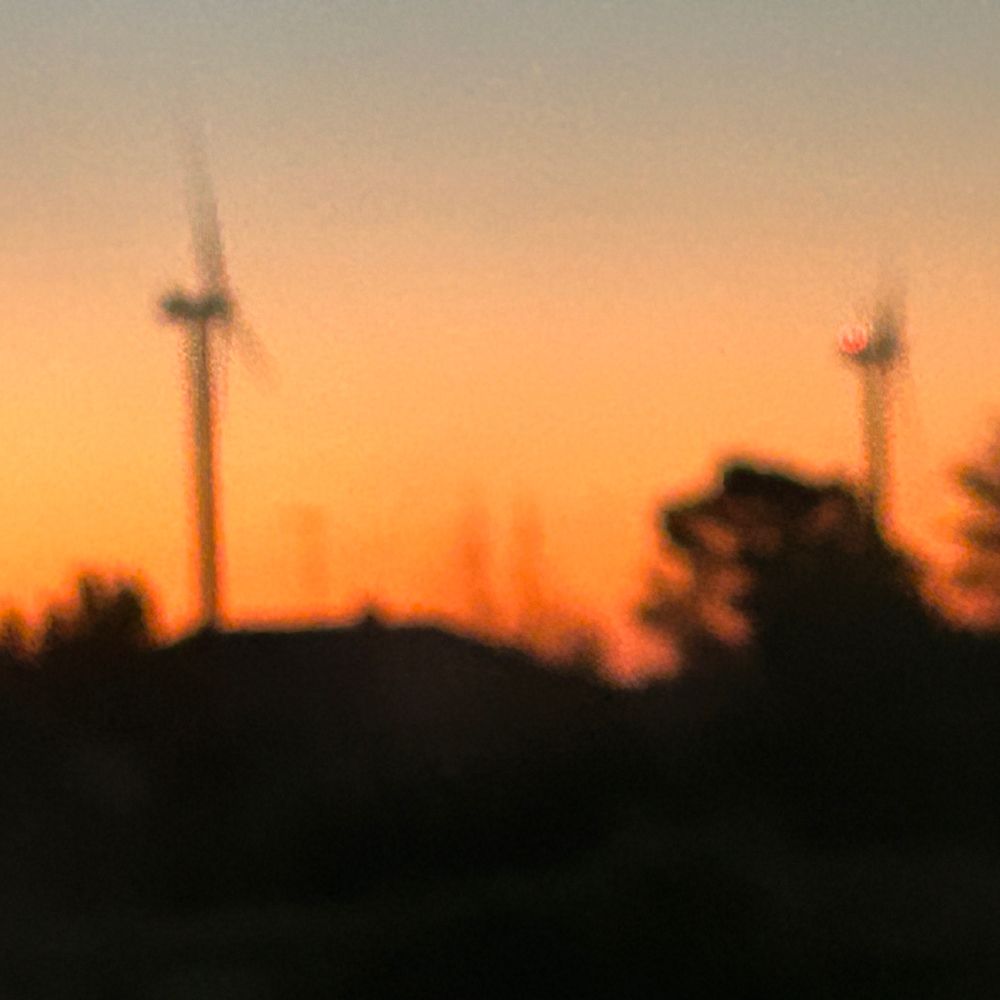
#oilpainting #landscape #hills
Reposted by John Kennedy

Reposted by John Kennedy


docs.google.com/forms/d/e/1F...
Reposted by Peter Thorne


diagrammonkey.wordpress.com/2021/11/17/t...

diagrammonkey.wordpress.com/2025/01/09/p...

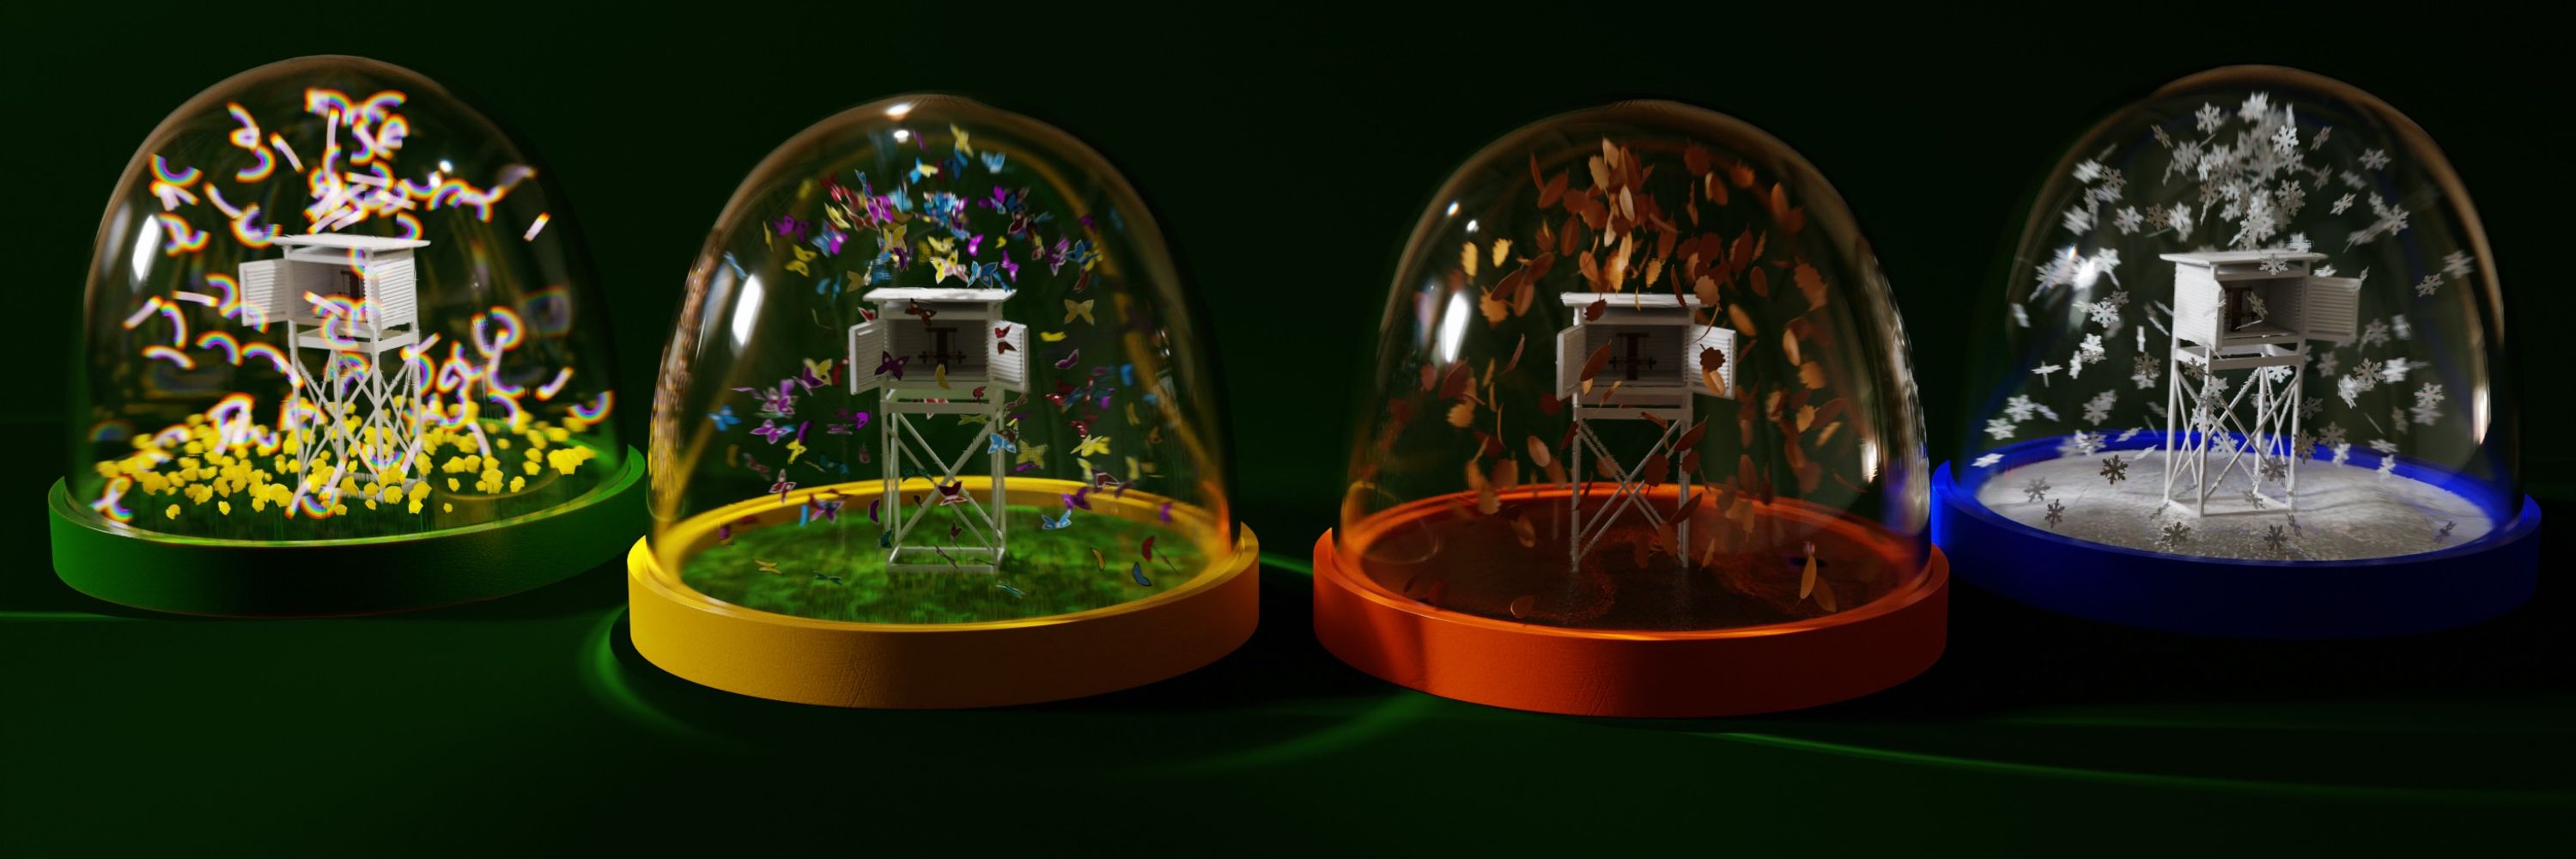
Notes on a paper about a systematic approach for reducing the size of ensembles needed for Monte Carlo style uncertainty calculations.
diagrammonkey.wordpress.com/2025/11/13/t...
* uncertainty estimation
** use far fewer samples.
www.ptb.de/cms/en/ptb/f...
Reposted by John Kennedy