


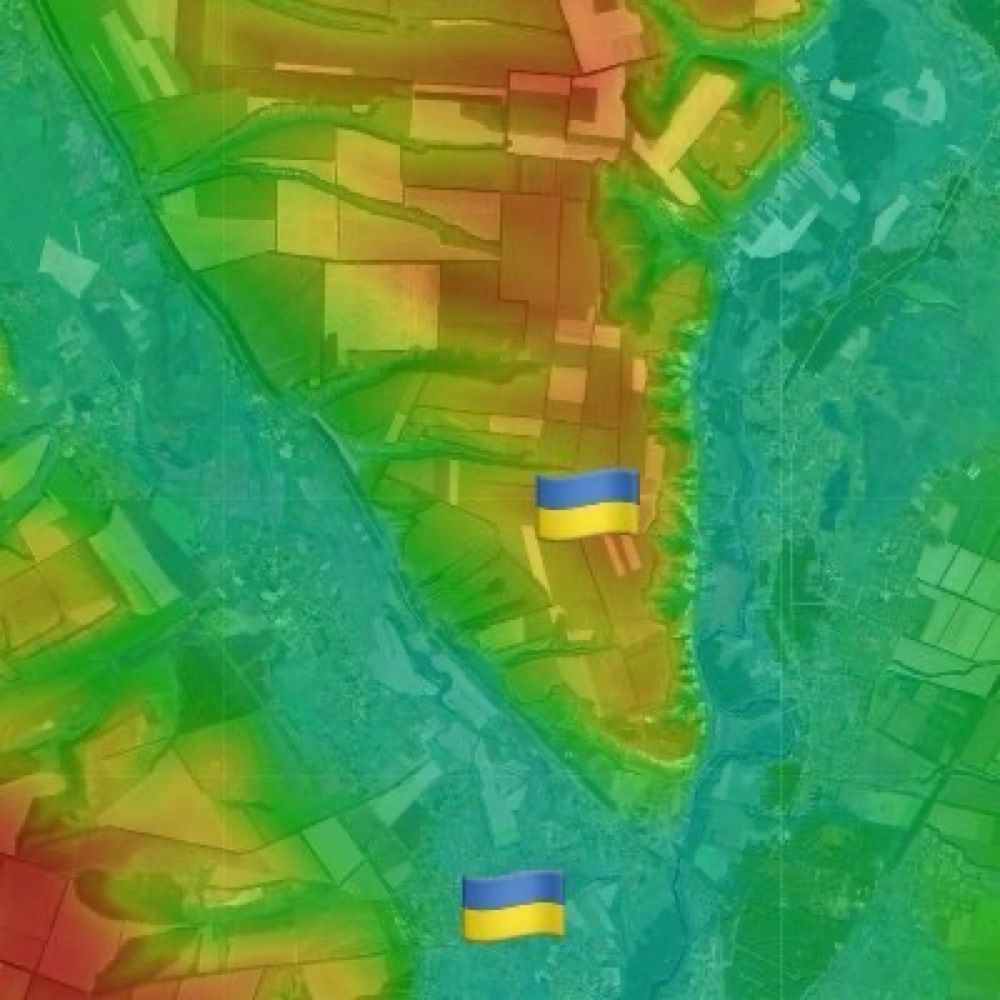
Talking about the flat Ukrainian terrain
Mapbox provides some 3D view capabilities that allow you to look at the frontline at an angle and see the battlefield from a different perspective.
You can also notice how flat Huliaipole is compared to other directions.
Mapbox provides some 3D view capabilities that allow you to look at the frontline at an angle and see the battlefield from a different perspective.
You can also notice how flat Huliaipole is compared to other directions.


January 10, 2026 at 10:52 AM
Talking about the flat Ukrainian terrain
Mapbox provides some 3D view capabilities that allow you to look at the frontline at an angle and see the battlefield from a different perspective.
You can also notice how flat Huliaipole is compared to other directions.
Mapbox provides some 3D view capabilities that allow you to look at the frontline at an angle and see the battlefield from a different perspective.
You can also notice how flat Huliaipole is compared to other directions.

Added a new category on my blog - a map 🗺️
I've put 4 posts on it to test it out. Next up is adding a lot more posts + some filtering so it's a bit easier to use as well. I'm back to work tomorrow (after a nice long holiday break) so this is where I'll have to leave it for now 🫡
www.emgoto.com/map/
I've put 4 posts on it to test it out. Next up is adding a lot more posts + some filtering so it's a bit easier to use as well. I'm back to work tomorrow (after a nice long holiday break) so this is where I'll have to leave it for now 🫡
www.emgoto.com/map/

January 4, 2026 at 11:57 AM
Added a new category on my blog - a map 🗺️
I've put 4 posts on it to test it out. Next up is adding a lot more posts + some filtering so it's a bit easier to use as well. I'm back to work tomorrow (after a nice long holiday break) so this is where I'll have to leave it for now 🫡
www.emgoto.com/map/
I've put 4 posts on it to test it out. Next up is adding a lot more posts + some filtering so it's a bit easier to use as well. I'm back to work tomorrow (after a nice long holiday break) so this is where I'll have to leave it for now 🫡
www.emgoto.com/map/
New section on my blog I'm playing around with (still a WIP so I haven't deployed it just yet). I like bookmarking places I've been on Google Maps so it would be like that but in my blog.
Also feel like I'm running out of category colours, not too sold on the teal (maybe I could go orange)?
Also feel like I'm running out of category colours, not too sold on the teal (maybe I could go orange)?

January 3, 2026 at 9:13 AM
New section on my blog I'm playing around with (still a WIP so I haven't deployed it just yet). I like bookmarking places I've been on Google Maps so it would be like that but in my blog.
Also feel like I'm running out of category colours, not too sold on the teal (maybe I could go orange)?
Also feel like I'm running out of category colours, not too sold on the teal (maybe I could go orange)?

NEW MAP ALERT 🗺️
We just shipped a brand-new Mapbox scrolly at @crisisgroup.org — rebuilt from the ground up with full-motion video and interactive maps throughout.
Design: @clairemaevabg.bsky.social
Engineering: me
👉 www.crisisgroup.org/visual-expla...
We just shipped a brand-new Mapbox scrolly at @crisisgroup.org — rebuilt from the ground up with full-motion video and interactive maps throughout.
Design: @clairemaevabg.bsky.social
Engineering: me
👉 www.crisisgroup.org/visual-expla...

Here’s why the year ahead looks set to be as bloody as the one ending.
Scroll through our latest visual explainer unpacking the conflicts @crisisgroup.org is watching in 2026. 3/3
www.crisisgroup.org/visual-expla...
Scroll through our latest visual explainer unpacking the conflicts @crisisgroup.org is watching in 2026. 3/3
www.crisisgroup.org/visual-expla...
December 31, 2025 at 6:20 PM
NEW MAP ALERT 🗺️
We just shipped a brand-new Mapbox scrolly at @crisisgroup.org — rebuilt from the ground up with full-motion video and interactive maps throughout.
Design: @clairemaevabg.bsky.social
Engineering: me
👉 www.crisisgroup.org/visual-expla...
We just shipped a brand-new Mapbox scrolly at @crisisgroup.org — rebuilt from the ground up with full-motion video and interactive maps throughout.
Design: @clairemaevabg.bsky.social
Engineering: me
👉 www.crisisgroup.org/visual-expla...

Speed and precision matter when data guides decisions. That’s why DataKind turned to Mapbox.
Mapbox Boundaries powers fast, accurate rendering of census tracts, ZIP codes, counties, and congressional districts—eliminating performance bottlenecks caused by slow TIGERweb calls: buff.ly/JOCjQVY
Mapbox Boundaries powers fast, accurate rendering of census tracts, ZIP codes, counties, and congressional districts—eliminating performance bottlenecks caused by slow TIGERweb calls: buff.ly/JOCjQVY

December 30, 2025 at 5:04 PM
Speed and precision matter when data guides decisions. That’s why DataKind turned to Mapbox.
Mapbox Boundaries powers fast, accurate rendering of census tracts, ZIP codes, counties, and congressional districts—eliminating performance bottlenecks caused by slow TIGERweb calls: buff.ly/JOCjQVY
Mapbox Boundaries powers fast, accurate rendering of census tracts, ZIP codes, counties, and congressional districts—eliminating performance bottlenecks caused by slow TIGERweb calls: buff.ly/JOCjQVY

Detecting the letter "O" at @uoregon.bsky.social's athletic fields using Meta's Segment Anything Model 3, Mapbox imagery, and the {geosam} #rstats package.
SAM3 does quite well - all you need is the text prompt "the letter o"!
#GoDucks
SAM3 does quite well - all you need is the text prompt "the letter o"!
#GoDucks
December 20, 2025 at 9:06 PM
Detecting the letter "O" at @uoregon.bsky.social's athletic fields using Meta's Segment Anything Model 3, Mapbox imagery, and the {geosam} #rstats package.
SAM3 does quite well - all you need is the text prompt "the letter o"!
#GoDucks
SAM3 does quite well - all you need is the text prompt "the letter o"!
#GoDucks
Introducing {geosam}: an R toolkit for Meta's Segment Anything Model 3
- Detect objects in satellite imagery with text prompts
- Interactive Shiny tools with draw & click-to-identify
- Works with Mapbox, Esri, MapTiler
- Use regular images too!
walker-data.com/geosam/
- Detect objects in satellite imagery with text prompts
- Interactive Shiny tools with draw & click-to-identify
- Works with Mapbox, Esri, MapTiler
- Use regular images too!
walker-data.com/geosam/


December 17, 2025 at 5:23 PM
Introducing {geosam}: an R toolkit for Meta's Segment Anything Model 3
- Detect objects in satellite imagery with text prompts
- Interactive Shiny tools with draw & click-to-identify
- Works with Mapbox, Esri, MapTiler
- Use regular images too!
walker-data.com/geosam/
- Detect objects in satellite imagery with text prompts
- Interactive Shiny tools with draw & click-to-identify
- Works with Mapbox, Esri, MapTiler
- Use regular images too!
walker-data.com/geosam/
Today's update on the upcoming R interface to Meta's SAM3:
We'll have a Shiny gadget that allows you to interactively explore and segment imagery.
Shown here in Positron: finding red cars in a parking lot at TCU via Mapbox imagery, which are returned to your R session as an sf object.
We'll have a Shiny gadget that allows you to interactively explore and segment imagery.
Shown here in Positron: finding red cars in a parking lot at TCU via Mapbox imagery, which are returned to your R session as an sf object.
December 10, 2025 at 8:27 PM
Today's update on the upcoming R interface to Meta's SAM3:
We'll have a Shiny gadget that allows you to interactively explore and segment imagery.
Shown here in Positron: finding red cars in a parking lot at TCU via Mapbox imagery, which are returned to your R session as an sf object.
We'll have a Shiny gadget that allows you to interactively explore and segment imagery.
Shown here in Positron: finding red cars in a parking lot at TCU via Mapbox imagery, which are returned to your R session as an sf object.
The new SAM3 model from Meta is blowing my mind
Shown here: detecting putting greens, pools, and cars in Scottsdale from simple text prompts via Mapbox imagery
R, Shiny, mapgl for the UI; Python backend via @giswqs.bsky.social's segment-geospatial package (thanks Qiusheng!)
Shown here: detecting putting greens, pools, and cars in Scottsdale from simple text prompts via Mapbox imagery
R, Shiny, mapgl for the UI; Python backend via @giswqs.bsky.social's segment-geospatial package (thanks Qiusheng!)
December 8, 2025 at 7:16 PM
The new SAM3 model from Meta is blowing my mind
Shown here: detecting putting greens, pools, and cars in Scottsdale from simple text prompts via Mapbox imagery
R, Shiny, mapgl for the UI; Python backend via @giswqs.bsky.social's segment-geospatial package (thanks Qiusheng!)
Shown here: detecting putting greens, pools, and cars in Scottsdale from simple text prompts via Mapbox imagery
R, Shiny, mapgl for the UI; Python backend via @giswqs.bsky.social's segment-geospatial package (thanks Qiusheng!)

Demo by Kyle Walker of using Meta's SAM3 in the geospatial domain, to segment aerial imagery. "Shown here: detecting putting greens, pools, and cars in Scottsdale from simple text prompts via @Mapbox imagery R, Shiny, mapgl for the UI; Python backend" x.com/kyle_e_walke...
December 8, 2025 at 11:14 PM
Demo by Kyle Walker of using Meta's SAM3 in the geospatial domain, to segment aerial imagery. "Shown here: detecting putting greens, pools, and cars in Scottsdale from simple text prompts via @Mapbox imagery R, Shiny, mapgl for the UI; Python backend" x.com/kyle_e_walke...
Create a store locator map that lets customers browse locations from a sidebar and tap markers to see more details.
This tutorial covers everything you need to get started: integrating Mapbox GL JS, importing GeoJSON, creating custom interactive markers, and building a sidebar with store listing.
This tutorial covers everything you need to get started: integrating Mapbox GL JS, importing GeoJSON, creating custom interactive markers, and building a sidebar with store listing.
December 5, 2025 at 5:01 PM
Create a store locator map that lets customers browse locations from a sidebar and tap markers to see more details.
This tutorial covers everything you need to get started: integrating Mapbox GL JS, importing GeoJSON, creating custom interactive markers, and building a sidebar with store listing.
This tutorial covers everything you need to get started: integrating Mapbox GL JS, importing GeoJSON, creating custom interactive markers, and building a sidebar with store listing.

Discover how to create a custom map interface in Airtable using GPX & KML files! Dive into spatial data visualization, interact directly with routes & areas, and enhance your operational database. Watch our latest YouTube video for a deep dive: https://youtu.be/_RJraEAfvZg #Airtable

December 2, 2025 at 7:36 AM
Discover how to create a custom map interface in Airtable using GPX & KML files! Dive into spatial data visualization, interact directly with routes & areas, and enhance your operational database. Watch our latest YouTube video for a deep dive: https://youtu.be/_RJraEAfvZg #Airtable
#30DayMapChallenge Day 29 — Raster
Check out this demo by Kenji Shima showing off the new Mapbox Japan Weather Layers. Toggle raster tilesets, swap projections, and experiment with particle animations — all powered by Mapbox: buff.ly/H7MW6gG
#BuiltWithMapbox #GeoVisualization
Check out this demo by Kenji Shima showing off the new Mapbox Japan Weather Layers. Toggle raster tilesets, swap projections, and experiment with particle animations — all powered by Mapbox: buff.ly/H7MW6gG
#BuiltWithMapbox #GeoVisualization
November 29, 2025 at 4:01 PM
#30DayMapChallenge Day 29 — Raster
Check out this demo by Kenji Shima showing off the new Mapbox Japan Weather Layers. Toggle raster tilesets, swap projections, and experiment with particle animations — all powered by Mapbox: buff.ly/H7MW6gG
#BuiltWithMapbox #GeoVisualization
Check out this demo by Kenji Shima showing off the new Mapbox Japan Weather Layers. Toggle raster tilesets, swap projections, and experiment with particle animations — all powered by Mapbox: buff.ly/H7MW6gG
#BuiltWithMapbox #GeoVisualization

Bike accidents in Cologne 2024, created with Mapbox
I used the data from Day 1, group accident locations in R, and created a map using Mapbox. Finally, I added interactive tooltips showing the number of bike accidents at each location.
#30DayMapChallenge | Day 17 - A new tool
I used the data from Day 1, group accident locations in R, and created a map using Mapbox. Finally, I added interactive tooltips showing the number of bike accidents at each location.
#30DayMapChallenge | Day 17 - A new tool
November 23, 2025 at 10:41 AM
Bike accidents in Cologne 2024, created with Mapbox
I used the data from Day 1, group accident locations in R, and created a map using Mapbox. Finally, I added interactive tooltips showing the number of bike accidents at each location.
#30DayMapChallenge | Day 17 - A new tool
I used the data from Day 1, group accident locations in R, and created a map using Mapbox. Finally, I added interactive tooltips showing the number of bike accidents at each location.
#30DayMapChallenge | Day 17 - A new tool

new placemark.io feature: drawing with routing. currently uses the mapbox directions api!
November 22, 2025 at 8:33 PM
new placemark.io feature: drawing with routing. currently uses the mapbox directions api!

📍: Sluice, Towpath Culvert 45 Control
ℹ️: sluice
🗺: https://www.openstreetmap.org/?mlat=51.0270645924459&mlon=-3.05913367187914#map=17/51.0270645924459/-3.05913367187914
#canal #narrowboat #england #uk #mapbox #aerialphoto #aerialphotography #satelliteview
ℹ️: sluice
🗺: https://www.openstreetmap.org/?mlat=51.0270645924459&mlon=-3.05913367187914#map=17/51.0270645924459/-3.05913367187914
#canal #narrowboat #england #uk #mapbox #aerialphoto #aerialphotography #satelliteview

December 28, 2024 at 12:49 PM
📍: Sluice, Towpath Culvert 45 Control
ℹ️: sluice
🗺: https://www.openstreetmap.org/?mlat=51.0270645924459&mlon=-3.05913367187914#map=17/51.0270645924459/-3.05913367187914
#canal #narrowboat #england #uk #mapbox #aerialphoto #aerialphotography #satelliteview
ℹ️: sluice
🗺: https://www.openstreetmap.org/?mlat=51.0270645924459&mlon=-3.05913367187914#map=17/51.0270645924459/-3.05913367187914
#canal #narrowboat #england #uk #mapbox #aerialphoto #aerialphotography #satelliteview

[#Réalisation] @makina_corpus a réalisé une #application #cartographique de gestion des autorisations d’évènements en forêt pour l’ONF de #Fontainebleau : https://lnkd.in/d4FD8YTg. #SIG #Webmapping #opensource #webSIG #django #Mapbox @ONF_Officiel #cartes #PostGIS #PostgreSQL


December 15, 2024 at 8:23 PM
[#Réalisation] @makina_corpus a réalisé une #application #cartographique de gestion des autorisations d’évènements en forêt pour l’ONF de #Fontainebleau : https://lnkd.in/d4FD8YTg. #SIG #Webmapping #opensource #webSIG #django #Mapbox @ONF_Officiel #cartes #PostGIS #PostgreSQL

#TeslaTakedown Get out there Chicagoland!


March 22, 2025 at 3:22 PM
#TeslaTakedown Get out there Chicagoland!

Tried the @Uber_DC ETA feature for the first time. Always a delighter to see a startup using @MapBox + OSM.
November 16, 2024 at 1:25 AM
Tried the @Uber_DC ETA feature for the first time. Always a delighter to see a startup using @MapBox + OSM.

⬆️ MapsPeople A/S just released MapsIndoorsMapbox v4.9.3-beta.1
https://swiftpackageindex.com/MapsPeople/mapsindoors-mapbox-ios#releases
https://swiftpackageindex.com/MapsPeople/mapsindoors-mapbox-ios#releases
February 5, 2025 at 3:26 PM
⬆️ MapsPeople A/S just released MapsIndoorsMapbox v4.9.3-beta.1
https://swiftpackageindex.com/MapsPeople/mapsindoors-mapbox-ios#releases
https://swiftpackageindex.com/MapsPeople/mapsindoors-mapbox-ios#releases

Hey Bluesky! 👋
Looking forward to connecting with more mapping and navigation enthusiasts here.
Looking forward to connecting with more mapping and navigation enthusiasts here.
November 22, 2024 at 10:04 PM

Treweler – Mapbox Map Builder Plugin for WordPress
https://code.stylelib.org/?p=153334
#codecanyon #utilities #wordpress
https://code.stylelib.org/?p=153334
#codecanyon #utilities #wordpress

March 26, 2025 at 1:20 PM
Treweler – Mapbox Map Builder Plugin for WordPress
https://code.stylelib.org/?p=153334
#codecanyon #utilities #wordpress
https://code.stylelib.org/?p=153334
#codecanyon #utilities #wordpress

Mapbox Geospatial MCP Server https://github.com/mapbox/mcp-server (https://news.ycombinator.com/item?id=44247124)

GitHub - mapbox/mcp-server: Mapbox Model Context Protocol (MCP) server
Mapbox Model Context Protocol (MCP) server. Contribute to mapbox/mcp-server development by creating an account on GitHub.
github.com
June 11, 2025 at 3:08 PM
Mapbox Geospatial MCP Server https://github.com/mapbox/mcp-server (https://news.ycombinator.com/item?id=44247124)