


Shankho Niyogi
@seismologic.bsky.social
Seismologist PhD student from UC Riverside. Interested in seismic studies of earthquakes, ambient noise and anthropogenic events. Currently looking for postdoc opportunities.
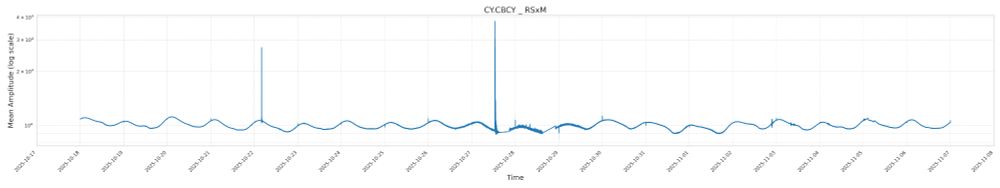
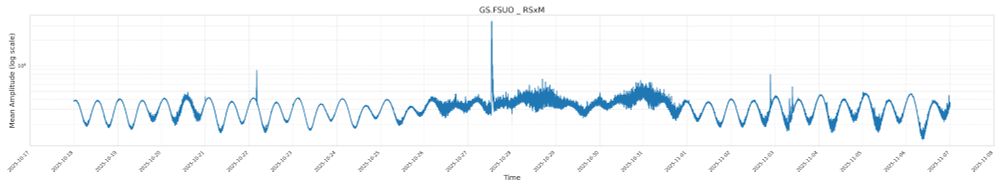
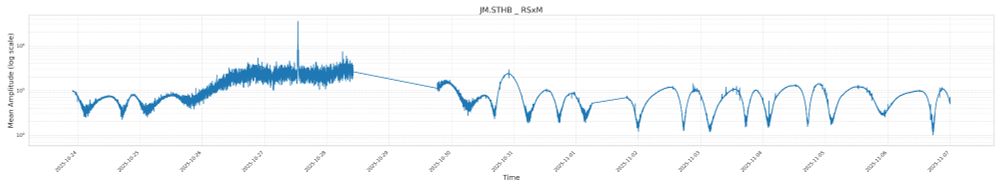
Other stations also show characteristic long duration increase of amplitudes during the passage of the hurricane. I have only looked at HHZ channels but similar phenomenon can be observed in other stations too. BTW the big spike on 27th Oct is a M6.5 event (id: us6000rjq8)
November 9, 2025 at 11:04 PM
Other stations also show characteristic long duration increase of amplitudes during the passage of the hurricane. I have only looked at HHZ channels but similar phenomenon can be observed in other stations too. BTW the big spike on 27th Oct is a M6.5 event (id: us6000rjq8)
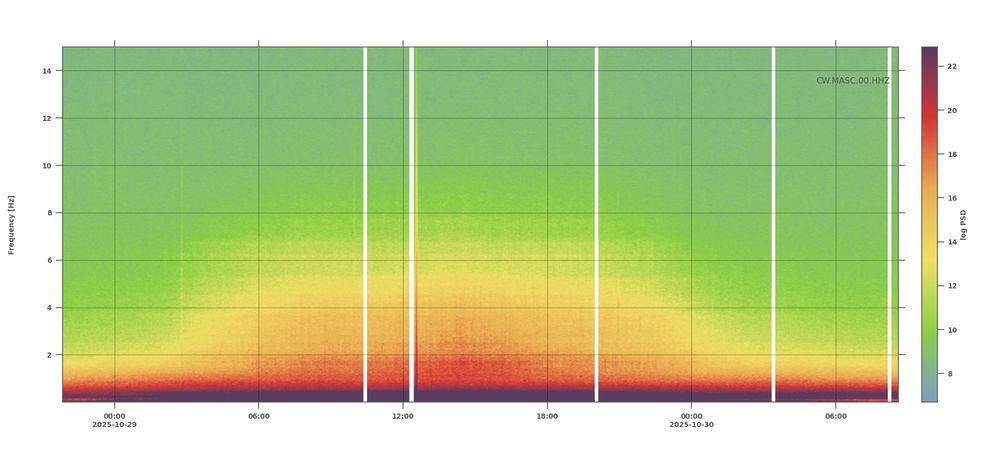
Just wanted to showcase that you plot the mean amplitude (60 sec window) over the week and half when Melissa was at the strongest you can see the event very clearly. The spectrogram show the frequency bands where the energy of the hurricane is the strongest.

November 9, 2025 at 10:56 PM
Just wanted to showcase that you plot the mean amplitude (60 sec window) over the week and half when Melissa was at the strongest you can see the event very clearly. The spectrogram show the frequency bands where the energy of the hurricane is the strongest.
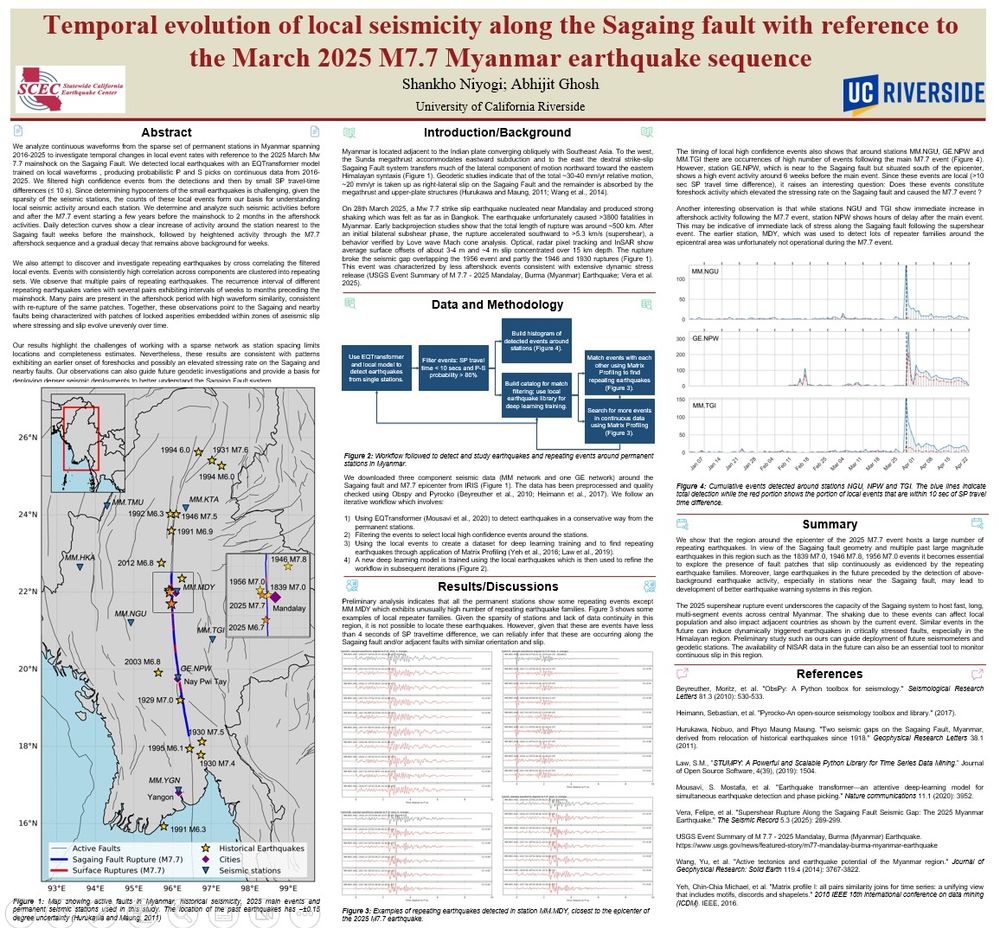
A big shout-out to the team behind GPlates and PyGPlates. Visualization of plate motions and points is very convenient now.
github.com/GPlates/GPla...
github.com/GPlates/GPla...
August 18, 2025 at 4:33 AM
A big shout-out to the team behind GPlates and PyGPlates. Visualization of plate motions and points is very convenient now.
github.com/GPlates/GPla...
github.com/GPlates/GPla...
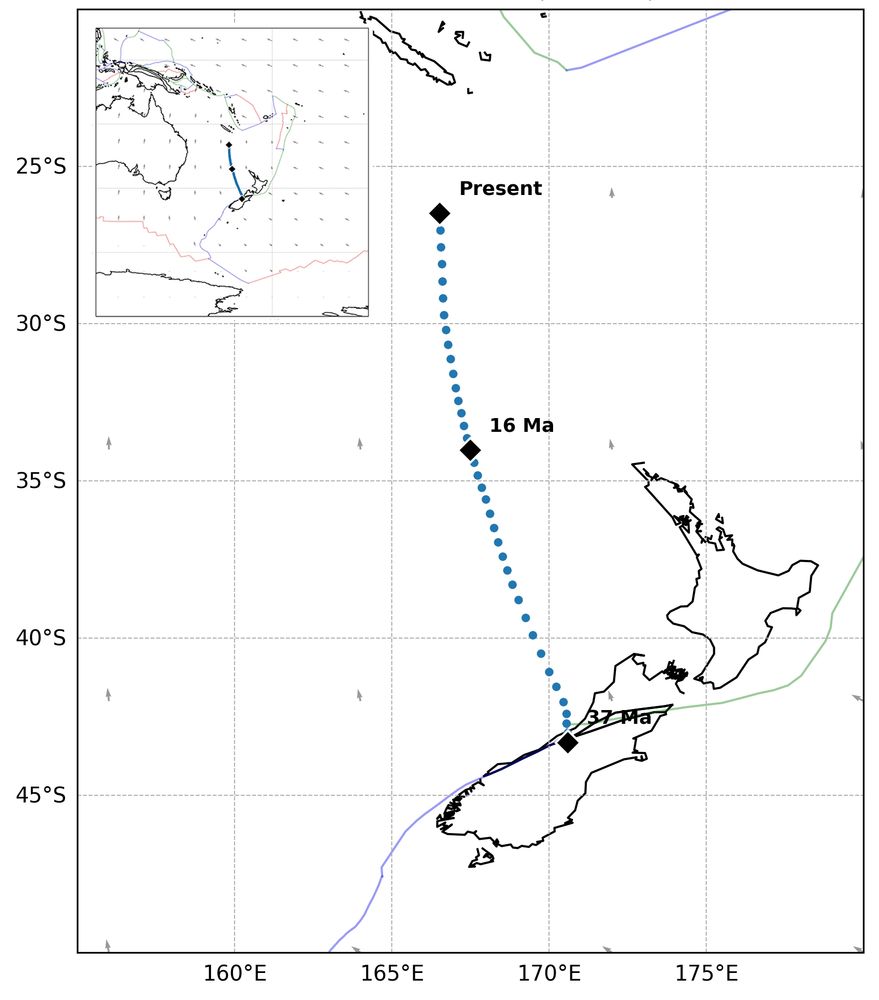
One interesting observation is that for stations LAUCH and LKBD2, which are situated to the west of the landslide, the HHE component registered a higher energy than other components. My interpretation is that it is due to the incoming surface waves generated by the landslide from the east.


May 29, 2025 at 7:45 PM
One interesting observation is that for stations LAUCH and LKBD2, which are situated to the west of the landslide, the HHE component registered a higher energy than other components. My interpretation is that it is due to the incoming surface waves generated by the landslide from the east.
Amplitude spectrum shows that in the nearby stations the highest energy is concentrated in the 0.5 - 3 Hz bandwidth.
May 29, 2025 at 7:45 PM
Amplitude spectrum shows that in the nearby stations the highest energy is concentrated in the 0.5 - 3 Hz bandwidth.
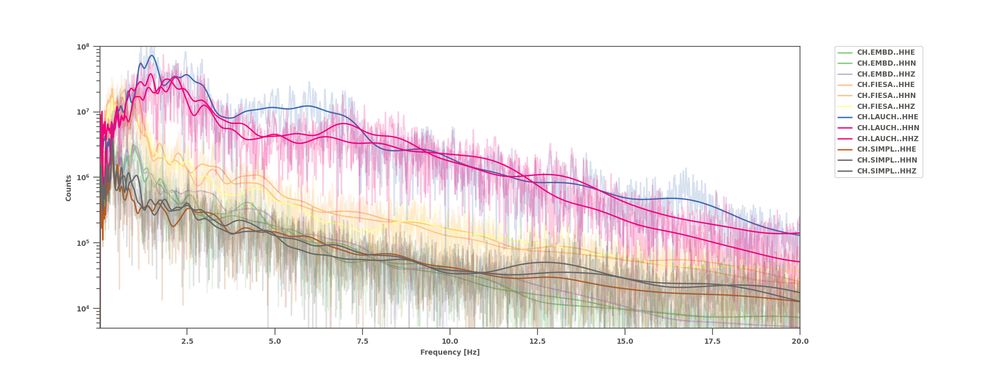
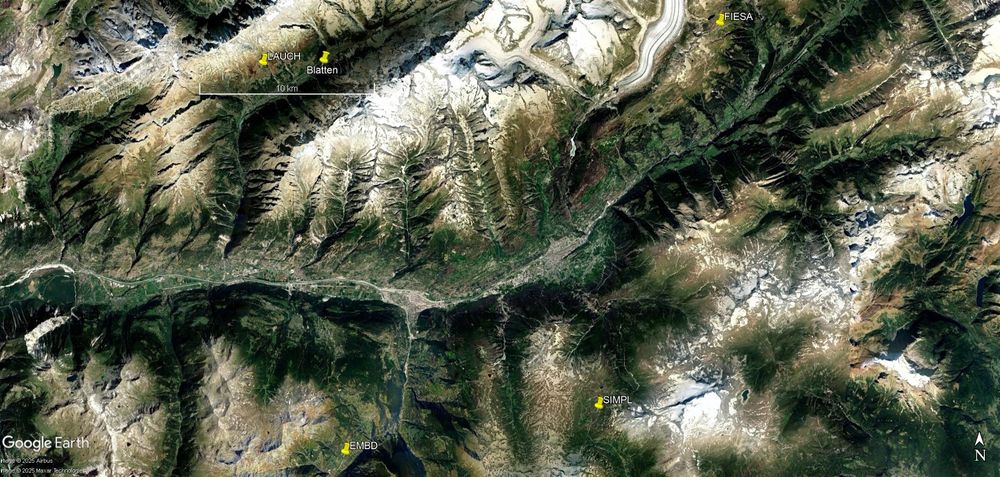
The Blatten landslide was registered on nearby seismometers (station LAUCH is closest, within 10 kms). Spectrogram of the raw waveform shows high energy content in the frequency band 1 - 10 Hz. The spectral signature is similar to those recorded in other parts of the world.


May 29, 2025 at 7:45 PM
The Blatten landslide was registered on nearby seismometers (station LAUCH is closest, within 10 kms). Spectrogram of the raw waveform shows high energy content in the frequency band 1 - 10 Hz. The spectral signature is similar to those recorded in other parts of the world.