


Rutger
@rutje.bsky.social
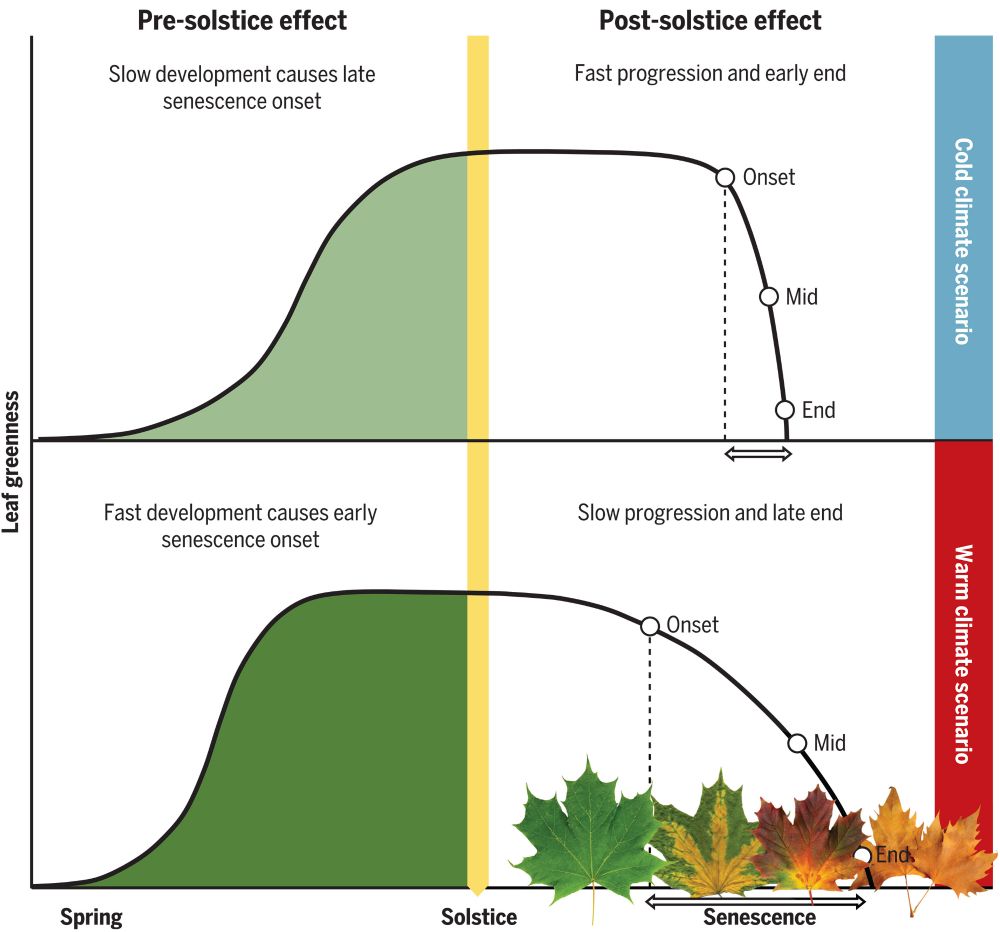
Voor veel soorten geeft een vroeg voorjaar ook een vroege(re) verkleuring. De baten van een blad nemen af met de leeftijd, en zeker voor soorten die weinig investeren "per blad" kan het aan het einde van één seizoen al niet meer "de moeite" waard zijn.
www.science.org/doi/10.1126/...
www.science.org/doi/10.1126/...

November 21, 2025 at 5:49 AM
Voor veel soorten geeft een vroeg voorjaar ook een vroege(re) verkleuring. De baten van een blad nemen af met de leeftijd, en zeker voor soorten die weinig investeren "per blad" kan het aan het einde van één seizoen al niet meer "de moeite" waard zijn.
www.science.org/doi/10.1126/...
www.science.org/doi/10.1126/...
Here's what @ecoclimatelab.bsky.social said specifically about drought. Using Kimutai et al 2025 to make such claims is obviously beyond inappropriate.
Still none of the 85+ authors seem to willing to take responsibility for any of this.
bsky.app/profile/rutj...
Still none of the 85+ authors seem to willing to take responsibility for any of this.
bsky.app/profile/rutj...
The arguments and citations you and your co-authors use in this rebuttal fit exactly what you accuse others of.
To use such language and accusations only to then proceed to do the same yourself is such a bad look. What's the point of dragging climate science into such a tribal state?
To use such language and accusations only to then proceed to do the same yourself is such a bad look. What's the point of dragging climate science into such a tribal state?

November 20, 2025 at 12:30 PM
Here's what @ecoclimatelab.bsky.social said specifically about drought. Using Kimutai et al 2025 to make such claims is obviously beyond inappropriate.
Still none of the 85+ authors seem to willing to take responsibility for any of this.
bsky.app/profile/rutj...
Still none of the 85+ authors seem to willing to take responsibility for any of this.
bsky.app/profile/rutj...

Mind you, these people are literally the ones who get to compile the IPCC reports, lead authors...🤦♂️
If @ipcc.bsky.social is smart they remove any association with all of them to protect their credibility. It'll be too easy for anyone who wants to dismiss reports like AR7 if this continues.
If @ipcc.bsky.social is smart they remove any association with all of them to protect their credibility. It'll be too easy for anyone who wants to dismiss reports like AR7 if this continues.
November 13, 2025 at 8:25 AM
Mind you, these people are literally the ones who get to compile the IPCC reports, lead authors...🤦♂️
If @ipcc.bsky.social is smart they remove any association with all of them to protect their credibility. It'll be too easy for anyone who wants to dismiss reports like AR7 if this continues.
If @ipcc.bsky.social is smart they remove any association with all of them to protect their credibility. It'll be too easy for anyone who wants to dismiss reports like AR7 if this continues.
The entire field of climate science keeps embracing it, citing it all the time, media loves it etc. Truly,is there a single climate scientist who's willing to publicly criticise KNMI for what they're doing?
Contrast what @bobkopp.net & @pammcelwee.bsky.social say with this:
bsky.app/profile/rutj...
Contrast what @bobkopp.net & @pammcelwee.bsky.social say with this:
bsky.app/profile/rutj...
November 13, 2025 at 8:25 AM
The entire field of climate science keeps embracing it, citing it all the time, media loves it etc. Truly,is there a single climate scientist who's willing to publicly criticise KNMI for what they're doing?
Contrast what @bobkopp.net & @pammcelwee.bsky.social say with this:
bsky.app/profile/rutj...
Contrast what @bobkopp.net & @pammcelwee.bsky.social say with this:
bsky.app/profile/rutj...
It should be obvious to anyone that citing such papers, as they do, completely invalidates the accusations they make. If anything, what they do strikes me as a lot worse than the DOE report. These issues with the work from @knmi.nl have been well known for years, regarding some for over a decade.
November 13, 2025 at 8:21 AM
It should be obvious to anyone that citing such papers, as they do, completely invalidates the accusations they make. If anything, what they do strikes me as a lot worse than the DOE report. These issues with the work from @knmi.nl have been well known for years, regarding some for over a decade.
Here's what @bobkopp.net & @pammcelwee.bsky.social say about it on the website of @ruclimateenergy.bsky.social, at:
rcei.rutgers.edu/climate-expe...
rcei.rutgers.edu/climate-expe...

November 13, 2025 at 8:21 AM
Here's what @bobkopp.net & @pammcelwee.bsky.social say about it on the website of @ruclimateenergy.bsky.social, at:
rcei.rutgers.edu/climate-expe...
rcei.rutgers.edu/climate-expe...
As an example; for their argument on the topic of extreme weather they cite sources like Kimutai et al 2025. Which isn't just bad, those results are completely fabricated and their claims evaporate after the errors are corrected.
November 13, 2025 at 8:21 AM
As an example; for their argument on the topic of extreme weather they cite sources like Kimutai et al 2025. Which isn't just bad, those results are completely fabricated and their claims evaporate after the errors are corrected.
This despite many of them being warned before and afterwards about the quality issues.
Many of the authors lashed out with accusations from calling the DOE CWG report "a farce", "a mockery of science" all the way up to accusations of "fraud" & "misconduct".
Many of the authors lashed out with accusations from calling the DOE CWG report "a farce", "a mockery of science" all the way up to accusations of "fraud" & "misconduct".
November 13, 2025 at 8:21 AM
This despite many of them being warned before and afterwards about the quality issues.
Many of the authors lashed out with accusations from calling the DOE CWG report "a farce", "a mockery of science" all the way up to accusations of "fraud" & "misconduct".
Many of the authors lashed out with accusations from calling the DOE CWG report "a farce", "a mockery of science" all the way up to accusations of "fraud" & "misconduct".
They share a lot of data on KNMI's Climate Explorer, which has its issues as shown and the versioning could be better, but it helps understanding the workflow. As far as I can tell all their publications are open access, which is also awesome.
November 12, 2025 at 12:48 PM
They share a lot of data on KNMI's Climate Explorer, which has its issues as shown and the versioning could be better, but it helps understanding the workflow. As far as I can tell all their publications are open access, which is also awesome.
To end on a more positive note. It's awesome that they have a repo with their code (even though it obviously doesn't match the paper, it's not too far off either). That should be required for any analysis of this type.
November 12, 2025 at 12:48 PM
To end on a more positive note. It's awesome that they have a repo with their code (even though it obviously doesn't match the paper, it's not too far off either). That should be required for any analysis of this type.
Specifically regarding the misleading way they communicate their results in the media even as early as March 2014 (see Meteorologica magazine for that month) were they publicly called out by former @KNMI employee Henk de Bruin (no slouch on evaporation), to this day they keep doubling down on it.
November 12, 2025 at 12:48 PM
Specifically regarding the misleading way they communicate their results in the media even as early as March 2014 (see Meteorologica magazine for that month) were they publicly called out by former @KNMI employee Henk de Bruin (no slouch on evaporation), to this day they keep doubling down on it.
@knmi.nl has been well aware of the quality issues with their work and communication for many years, this paper is just an example, not an incident. Many people have notified them about these issues, myself included. They simply refuse to address it.
November 12, 2025 at 12:48 PM
@knmi.nl has been well aware of the quality issues with their work and communication for many years, this paper is just an example, not an incident. Many people have notified them about these issues, myself included. They simply refuse to address it.
I'm sure there are many more issues, one I haven't mentioned is them taking a grid average (on a regular grid in epsg:4326) instead of a "cos(latitude)" weighted average. The effect is limited here on the equator, but could be significant for other areas.
November 12, 2025 at 12:48 PM
I'm sure there are many more issues, one I haven't mentioned is them taking a grid average (on a regular grid in epsg:4326) instead of a "cos(latitude)" weighted average. The effect is limited here on the equator, but could be significant for other areas.
I don't think those residuals impact the issues I raised above. But my attempts of course shouldn't be trusted either. They also do a lot of text-based I/O (reading/writing intermediates), I haven't fully chased the impact of that, but doubt it explains it.
November 12, 2025 at 12:48 PM
I don't think those residuals impact the issues I raised above. But my attempts of course shouldn't be trusted either. They also do a lot of text-based I/O (reading/writing intermediates), I haven't fully chased the impact of that, but doubt it explains it.
Here are the residuals (lower left) after replicating their SPEI24 as close as possible. It's close but not perfect, and the magnitude/pattern can't be just (blown up) numerical-precision/noise. Clearly I'm either overlooking or doing something wrong but I can't figure it out.

November 12, 2025 at 12:48 PM
Here are the residuals (lower left) after replicating their SPEI24 as close as possible. It's close but not perfect, and the magnitude/pattern can't be just (blown up) numerical-precision/noise. Clearly I'm either overlooking or doing something wrong but I can't figure it out.
Taking a monthly avg, applying PET (Thornthwaite), taking an area avg, and finally creating a rolling 24-month SPEI really muffles the impact of such outliers. Too much to see anything meaningful when I compare it with the SPEI24 that they share on KNMI's Climate Explorer.
November 12, 2025 at 12:48 PM
Taking a monthly avg, applying PET (Thornthwaite), taking an area avg, and finally creating a rolling 24-month SPEI really muffles the impact of such outliers. Too much to see anything meaningful when I compare it with the SPEI24 that they share on KNMI's Climate Explorer.
The Tmin & Tmax data shows clear outliers, sometimes a daily Tmin that is as low as -60°C (for the Horn of Africa!). Especially their "event year" 2022 contains a lot of bad data. Here's an example for a single location (no area/aoi average).

November 12, 2025 at 12:48 PM
The Tmin & Tmax data shows clear outliers, sometimes a daily Tmin that is as low as -60°C (for the Horn of Africa!). Especially their "event year" 2022 contains a lot of bad data. Here's an example for a single location (no area/aoi average).
One obvious issue that I haven't addressed myself is the terrible quality of the CPC temperature data. I also don't see them addressing it in any way (in the paper or code), but they could have of course altered the "raw" data from NOAA prior to reading it (they should, it's bad).
November 12, 2025 at 12:48 PM
One obvious issue that I haven't addressed myself is the terrible quality of the CPC temperature data. I also don't see them addressing it in any way (in the paper or code), but they could have of course altered the "raw" data from NOAA prior to reading it (they should, it's bad).
Regarding some loose ends. While their code captures the gist of their analysis, the repo doesn't exactly match the publication. Perhaps their code changed, maybe a 3rd party library changed (there's no versioning). Maybe the inputs (NOAA PSL's CPC data) changed?
November 12, 2025 at 12:48 PM
Regarding some loose ends. While their code captures the gist of their analysis, the repo doesn't exactly match the publication. Perhaps their code changed, maybe a 3rd party library changed (there's no versioning). Maybe the inputs (NOAA PSL's CPC data) changed?
It seems a self-fulfilling prophecy, double counting the impact of climate change, which manifests itself specifically in the local temperature that's already used for SPEI-24. What's the added value of again regressing that with GMST? Of course there's a correlation.
November 12, 2025 at 12:48 PM
It seems a self-fulfilling prophecy, double counting the impact of climate change, which manifests itself specifically in the local temperature that's already used for SPEI-24. What's the added value of again regressing that with GMST? Of course there's a correlation.
Tangent; I don't get the point of using something that's already effectively *only* a (hyper)sensitive function of local temperature (Thornthwaite + no rainfall trend), regress this with GMST to amplify what was already a probability (the SPEI-24)!?
November 12, 2025 at 12:48 PM
Tangent; I don't get the point of using something that's already effectively *only* a (hyper)sensitive function of local temperature (Thornthwaite + no rainfall trend), regress this with GMST to amplify what was already a probability (the SPEI-24)!?
And the same for the probability-ratio (figure 6b).
November 12, 2025 at 12:48 PM
And the same for the probability-ratio (figure 6b).
The SPEI24 regression with GMST and the subsequent probability ration plot change as follows. Note that I don't exactly replicate their claimed 5500x pr-ratio, there are some loose ends but it's pretty close.
With my fix the pr-ratio drops to around ~400x.
Their Fig 6a:
With my fix the pr-ratio drops to around ~400x.
Their Fig 6a:
November 12, 2025 at 12:48 PM
The SPEI24 regression with GMST and the subsequent probability ration plot change as follows. Note that I don't exactly replicate their claimed 5500x pr-ratio, there are some loose ends but it's pretty close.
With my fix the pr-ratio drops to around ~400x.
Their Fig 6a:
With my fix the pr-ratio drops to around ~400x.
Their Fig 6a: