


Tyson Graber
@rnaguru.bsky.social
Cell biologist. Interested in identifying & decoding the public health information stored in 💩. Posting Ottawa WAVE 🌊 (wastewater analytics for viral epidemiology)
...and further divided into seasons of each year. Interesting times.

November 29, 2025 at 12:35 AM
...and further divided into seasons of each year. Interesting times.
As 2025 draws to a close let's look at SARS-CoV-2 RNA signal in Ottawa wastewater over the past 6(!) years and by VOC. We've never seem a period this stable and low....

November 29, 2025 at 12:35 AM
As 2025 draws to a close let's look at SARS-CoV-2 RNA signal in Ottawa wastewater over the past 6(!) years and by VOC. We've never seem a period this stable and low....
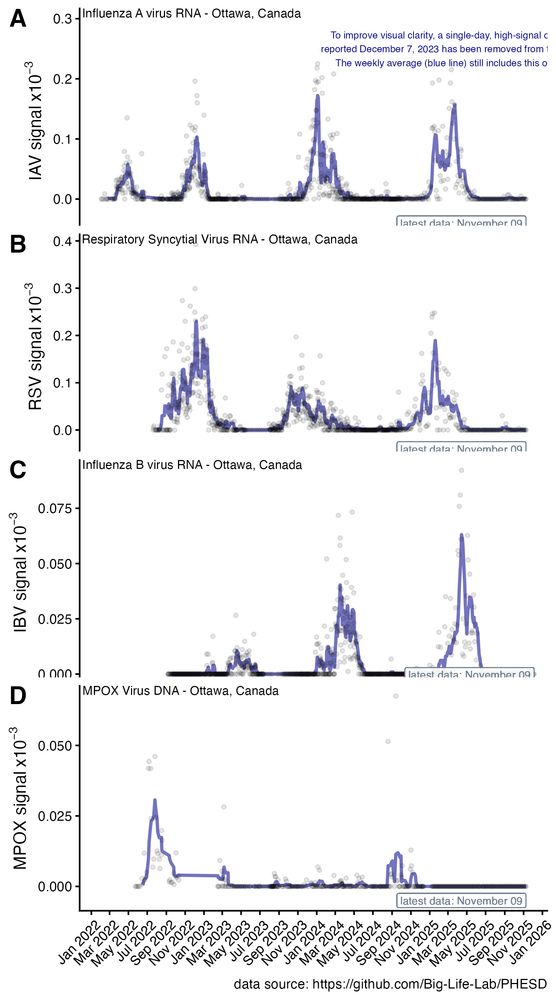
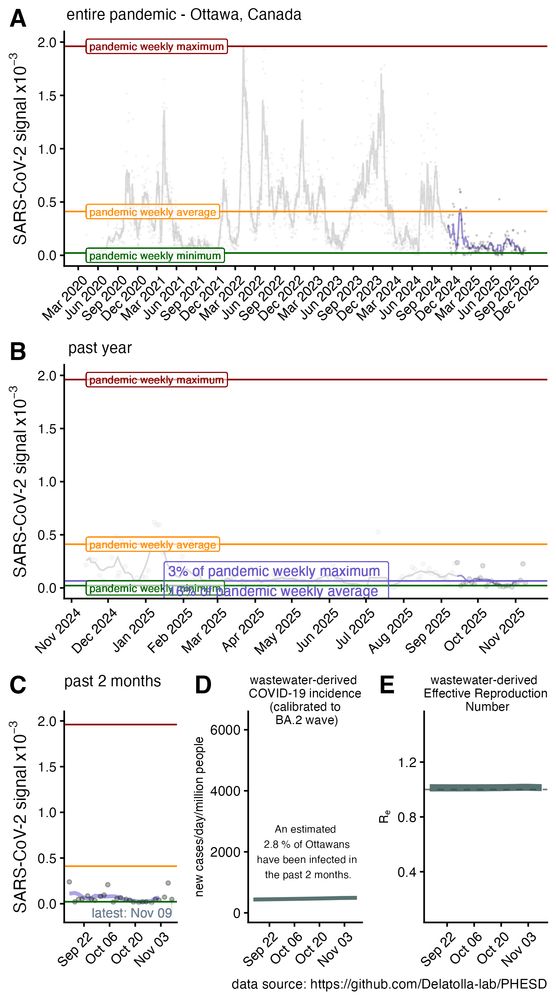
Ottawa WAVE (Wastewater Analytics for Viral Epidemiology) as of Nov 23. LEFT IMAGE: 7d trendline of SARS-CoV-2 signal since spring 2020 (A); Past year (B), and 2 months (C), inferred case incidence (D), and Reff (E) determined with ern (PMID: 38905266). RIGHT IMAGE: other viral traces


November 28, 2025 at 7:51 PM
Ottawa WAVE (Wastewater Analytics for Viral Epidemiology) as of Nov 23. LEFT IMAGE: 7d trendline of SARS-CoV-2 signal since spring 2020 (A); Past year (B), and 2 months (C), inferred case incidence (D), and Reff (E) determined with ern (PMID: 38905266). RIGHT IMAGE: other viral traces
Ottawa WAVE (Wastewater Analytics for Viral Epidemiology) as of Nov 23. LEFT IMAGE: 7d trendline of SARS-CoV-2 signal since spring 2020 (A); Past year (B), and 2 months (C), inferred case incidence (D), and Reff (E) determined with ern (PMID: 38905266). RIGHT IMAGE: other viral traces


November 27, 2025 at 7:51 PM
Ottawa WAVE (Wastewater Analytics for Viral Epidemiology) as of Nov 23. LEFT IMAGE: 7d trendline of SARS-CoV-2 signal since spring 2020 (A); Past year (B), and 2 months (C), inferred case incidence (D), and Reff (E) determined with ern (PMID: 38905266). RIGHT IMAGE: other viral traces
Ottawa WAVE (Wastewater Analytics for Viral Epidemiology) as of Nov 23. LEFT IMAGE: 7d trendline of SARS-CoV-2 signal since spring 2020 (A); Past year (B), and 2 months (C), inferred case incidence (D), and Reff (E) determined with ern (PMID: 38905266). RIGHT IMAGE: other viral traces


November 26, 2025 at 7:52 PM
Ottawa WAVE (Wastewater Analytics for Viral Epidemiology) as of Nov 23. LEFT IMAGE: 7d trendline of SARS-CoV-2 signal since spring 2020 (A); Past year (B), and 2 months (C), inferred case incidence (D), and Reff (E) determined with ern (PMID: 38905266). RIGHT IMAGE: other viral traces
Ottawa WAVE (Wastewater Analytics for Viral Epidemiology) as of Nov 16. LEFT IMAGE: 7d trendline of SARS-CoV-2 signal since spring 2020 (A); Past year (B), and 2 months (C), inferred case incidence (D), and Reff (E) determined with ern (PMID: 38905266). RIGHT IMAGE: other viral traces


November 25, 2025 at 7:52 PM
Ottawa WAVE (Wastewater Analytics for Viral Epidemiology) as of Nov 16. LEFT IMAGE: 7d trendline of SARS-CoV-2 signal since spring 2020 (A); Past year (B), and 2 months (C), inferred case incidence (D), and Reff (E) determined with ern (PMID: 38905266). RIGHT IMAGE: other viral traces
Quick assembly. Just don’t lose the Allen/Hex key.

November 22, 2025 at 5:52 AM
Quick assembly. Just don’t lose the Allen/Hex key.
The last year has signalled the end of the roller coaster, not the pandemic. SARS-CoV-2 sits as yet another viral infection that we are susceptible to amongst the mix, no longer a looming boogeyman. See the clinical percent positivity across Canada. Lower this past year than any other. But …

November 22, 2025 at 3:47 AM
The last year has signalled the end of the roller coaster, not the pandemic. SARS-CoV-2 sits as yet another viral infection that we are susceptible to amongst the mix, no longer a looming boogeyman. See the clinical percent positivity across Canada. Lower this past year than any other. But …
8/
Let's focus on what this means in Ottawa wastewater this past year.
Top: Separated N1 and N2 signals in Ottawa wastewater.
Middle: z-score (N1 vs N2) - negative deviation suggests N1 underestimation.
Bottom: mutation burden in clinical genomes.
Let's focus on what this means in Ottawa wastewater this past year.
Top: Separated N1 and N2 signals in Ottawa wastewater.
Middle: z-score (N1 vs N2) - negative deviation suggests N1 underestimation.
Bottom: mutation burden in clinical genomes.

November 22, 2025 at 1:13 AM
8/
Let's focus on what this means in Ottawa wastewater this past year.
Top: Separated N1 and N2 signals in Ottawa wastewater.
Middle: z-score (N1 vs N2) - negative deviation suggests N1 underestimation.
Bottom: mutation burden in clinical genomes.
Let's focus on what this means in Ottawa wastewater this past year.
Top: Separated N1 and N2 signals in Ottawa wastewater.
Middle: z-score (N1 vs N2) - negative deviation suggests N1 underestimation.
Bottom: mutation burden in clinical genomes.
7/
Looking at it as mutational burden over time.
Across N1+N2, burden is now the highest seen (>2 mutations on average). Yellow marks weeks with <50 sequences. Remember these are clinical seqs based on global *OPEN* data (Genbank) and misses Canadian seqs. But Ottawa tends to follow the trend.
Looking at it as mutational burden over time.
Across N1+N2, burden is now the highest seen (>2 mutations on average). Yellow marks weeks with <50 sequences. Remember these are clinical seqs based on global *OPEN* data (Genbank) and misses Canadian seqs. But Ottawa tends to follow the trend.

November 22, 2025 at 1:13 AM
7/
Looking at it as mutational burden over time.
Across N1+N2, burden is now the highest seen (>2 mutations on average). Yellow marks weeks with <50 sequences. Remember these are clinical seqs based on global *OPEN* data (Genbank) and misses Canadian seqs. But Ottawa tends to follow the trend.
Looking at it as mutational burden over time.
Across N1+N2, burden is now the highest seen (>2 mutations on average). Yellow marks weeks with <50 sequences. Remember these are clinical seqs based on global *OPEN* data (Genbank) and misses Canadian seqs. But Ottawa tends to follow the trend.
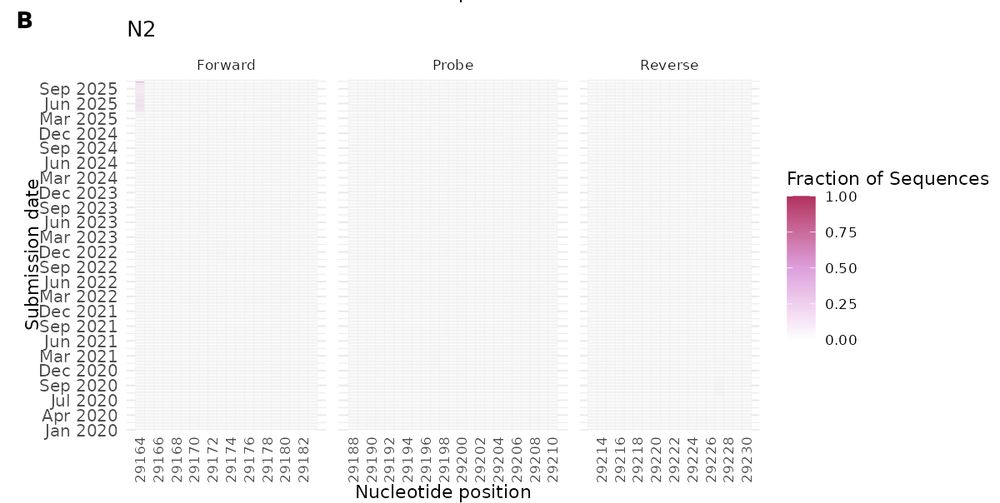
6/
Now N2 locus mutations.
A mutation near the start of the forward primer is rising due to a new variant. Its position likely limits impact on assay sensitivity, but it’s something to watch.
Now N2 locus mutations.
A mutation near the start of the forward primer is rising due to a new variant. Its position likely limits impact on assay sensitivity, but it’s something to watch.
November 22, 2025 at 1:13 AM
6/
Now N2 locus mutations.
A mutation near the start of the forward primer is rising due to a new variant. Its position likely limits impact on assay sensitivity, but it’s something to watch.
Now N2 locus mutations.
A mutation near the start of the forward primer is rising due to a new variant. Its position likely limits impact on assay sensitivity, but it’s something to watch.
5/
Let's look at the N1 locus.
N1 has gained mutations over the pandemic, especially at nt28311. Researchers have shown that this can slightly lower N1 signal but the effect is small. New mutations have also appeared recently.
Let's look at the N1 locus.
N1 has gained mutations over the pandemic, especially at nt28311. Researchers have shown that this can slightly lower N1 signal but the effect is small. New mutations have also appeared recently.

November 22, 2025 at 1:13 AM
5/
Let's look at the N1 locus.
N1 has gained mutations over the pandemic, especially at nt28311. Researchers have shown that this can slightly lower N1 signal but the effect is small. New mutations have also appeared recently.
Let's look at the N1 locus.
N1 has gained mutations over the pandemic, especially at nt28311. Researchers have shown that this can slightly lower N1 signal but the effect is small. New mutations have also appeared recently.
Ottawa WAVE (Wastewater Analytics for Viral Epidemiology) as of Nov 16. LEFT IMAGE: 7d trendline of SARS-CoV-2 signal since spring 2020 (A); Past year (B), and 2 months (C), inferred case incidence (D), and Reff (E) determined with ern (PMID: 38905266). RIGHT IMAGE: other viral traces


November 21, 2025 at 7:52 PM
Ottawa WAVE (Wastewater Analytics for Viral Epidemiology) as of Nov 16. LEFT IMAGE: 7d trendline of SARS-CoV-2 signal since spring 2020 (A); Past year (B), and 2 months (C), inferred case incidence (D), and Reff (E) determined with ern (PMID: 38905266). RIGHT IMAGE: other viral traces
Ottawa WAVE (Wastewater Analytics for Viral Epidemiology) as of Nov 16. LEFT IMAGE: 7d trendline of SARS-CoV-2 signal since spring 2020 (A); Past year (B), and 2 months (C), inferred case incidence (D), and Reff (E) determined with ern (PMID: 38905266). RIGHT IMAGE: other viral traces


November 20, 2025 at 7:52 PM
Ottawa WAVE (Wastewater Analytics for Viral Epidemiology) as of Nov 16. LEFT IMAGE: 7d trendline of SARS-CoV-2 signal since spring 2020 (A); Past year (B), and 2 months (C), inferred case incidence (D), and Reff (E) determined with ern (PMID: 38905266). RIGHT IMAGE: other viral traces
Ottawa WAVE (Wastewater Analytics for Viral Epidemiology) as of Nov 16. LEFT IMAGE: 7d trendline of SARS-CoV-2 signal since spring 2020 (A); Past year (B), and 2 months (C), inferred case incidence (D), and Reff (E) determined with ern (PMID: 38905266). RIGHT IMAGE: other viral traces


November 19, 2025 at 7:52 PM
Ottawa WAVE (Wastewater Analytics for Viral Epidemiology) as of Nov 16. LEFT IMAGE: 7d trendline of SARS-CoV-2 signal since spring 2020 (A); Past year (B), and 2 months (C), inferred case incidence (D), and Reff (E) determined with ern (PMID: 38905266). RIGHT IMAGE: other viral traces
Ottawa WAVE (Wastewater Analytics for Viral Epidemiology) as of Nov 09. LEFT IMAGE: 7d trendline of SARS-CoV-2 signal since spring 2020 (A); Past year (B), and 2 months (C), inferred case incidence (D), and Reff (E) determined with ern (PMID: 38905266). RIGHT IMAGE: other viral traces

November 18, 2025 at 7:51 PM
Ottawa WAVE (Wastewater Analytics for Viral Epidemiology) as of Nov 09. LEFT IMAGE: 7d trendline of SARS-CoV-2 signal since spring 2020 (A); Past year (B), and 2 months (C), inferred case incidence (D), and Reff (E) determined with ern (PMID: 38905266). RIGHT IMAGE: other viral traces
Ottawa WAVE (Wastewater Analytics for Viral Epidemiology) as of Nov 09. LEFT IMAGE: 7d trendline of SARS-CoV-2 signal since spring 2020 (A); Past year (B), and 2 months (C), inferred case incidence (D), and Reff (E) determined with ern (PMID: 38905266). RIGHT IMAGE: other viral traces


November 14, 2025 at 7:52 PM
Ottawa WAVE (Wastewater Analytics for Viral Epidemiology) as of Nov 09. LEFT IMAGE: 7d trendline of SARS-CoV-2 signal since spring 2020 (A); Past year (B), and 2 months (C), inferred case incidence (D), and Reff (E) determined with ern (PMID: 38905266). RIGHT IMAGE: other viral traces
Ottawa WAVE (Wastewater Analytics for Viral Epidemiology) as of Nov 09. LEFT IMAGE: 7d trendline of SARS-CoV-2 signal since spring 2020 (A); Past year (B), and 2 months (C), inferred case incidence (D), and Reff (E) determined with ern (PMID: 38905266). RIGHT IMAGE: other viral traces


November 13, 2025 at 7:52 PM
Ottawa WAVE (Wastewater Analytics for Viral Epidemiology) as of Nov 09. LEFT IMAGE: 7d trendline of SARS-CoV-2 signal since spring 2020 (A); Past year (B), and 2 months (C), inferred case incidence (D), and Reff (E) determined with ern (PMID: 38905266). RIGHT IMAGE: other viral traces
Ottawa WAVE (Wastewater Analytics for Viral Epidemiology) as of Nov 09. LEFT IMAGE: 7d trendline of SARS-CoV-2 signal since spring 2020 (A); Past year (B), and 2 months (C), inferred case incidence (D), and Reff (E) determined with ern (PMID: 38905266). RIGHT IMAGE: other viral traces

November 12, 2025 at 7:52 PM
Ottawa WAVE (Wastewater Analytics for Viral Epidemiology) as of Nov 09. LEFT IMAGE: 7d trendline of SARS-CoV-2 signal since spring 2020 (A); Past year (B), and 2 months (C), inferred case incidence (D), and Reff (E) determined with ern (PMID: 38905266). RIGHT IMAGE: other viral traces
Ottawa WAVE (Wastewater Analytics for Viral Epidemiology) as of Nov 02. LEFT IMAGE: 7d trendline of SARS-CoV-2 signal since spring 2020 (A); Past year (B), and 2 months (C), inferred case incidence (D), and Reff (E) determined with ern (PMID: 38905266). RIGHT IMAGE: other viral traces


November 11, 2025 at 7:52 PM
Ottawa WAVE (Wastewater Analytics for Viral Epidemiology) as of Nov 02. LEFT IMAGE: 7d trendline of SARS-CoV-2 signal since spring 2020 (A); Past year (B), and 2 months (C), inferred case incidence (D), and Reff (E) determined with ern (PMID: 38905266). RIGHT IMAGE: other viral traces
Ottawa WAVE (Wastewater Analytics for Viral Epidemiology) as of Nov 02. LEFT IMAGE: 7d trendline of SARS-CoV-2 signal since spring 2020 (A); Past year (B), and 2 months (C), inferred case incidence (D), and Reff (E) determined with ern (PMID: 38905266). RIGHT IMAGE: other viral traces


November 7, 2025 at 7:52 PM
Ottawa WAVE (Wastewater Analytics for Viral Epidemiology) as of Nov 02. LEFT IMAGE: 7d trendline of SARS-CoV-2 signal since spring 2020 (A); Past year (B), and 2 months (C), inferred case incidence (D), and Reff (E) determined with ern (PMID: 38905266). RIGHT IMAGE: other viral traces
Ottawa WAVE (Wastewater Analytics for Viral Epidemiology) as of Nov 02. LEFT IMAGE: 7d trendline of SARS-CoV-2 signal since spring 2020 (A); Past year (B), and 2 months (C), inferred case incidence (D), and Reff (E) determined with ern (PMID: 38905266). RIGHT IMAGE: other viral traces

November 7, 2025 at 1:49 AM
Ottawa WAVE (Wastewater Analytics for Viral Epidemiology) as of Nov 02. LEFT IMAGE: 7d trendline of SARS-CoV-2 signal since spring 2020 (A); Past year (B), and 2 months (C), inferred case incidence (D), and Reff (E) determined with ern (PMID: 38905266). RIGHT IMAGE: other viral traces
Ottawa WAVE (Wastewater Analytics for Viral Epidemiology) as of Oct 26. LEFT IMAGE: 7d trendline of SARS-CoV-2 signal since spring 2020 (A); Past year (B), and 2 months (C), inferred case incidence (D), and Reff (E) determined with ern (PMID: 38905266). RIGHT IMAGE: other viral traces


November 4, 2025 at 7:54 PM
Ottawa WAVE (Wastewater Analytics for Viral Epidemiology) as of Oct 26. LEFT IMAGE: 7d trendline of SARS-CoV-2 signal since spring 2020 (A); Past year (B), and 2 months (C), inferred case incidence (D), and Reff (E) determined with ern (PMID: 38905266). RIGHT IMAGE: other viral traces
Ottawa WAVE (Wastewater Analytics for Viral Epidemiology) as of Oct 26. LEFT IMAGE: 7d trendline of SARS-CoV-2 signal since spring 2020 (A); Past year (B), and 2 months (C), inferred case incidence (D), and Reff (E) determined with ern (PMID: 38905266). RIGHT IMAGE: other viral traces


October 31, 2025 at 7:54 PM
Ottawa WAVE (Wastewater Analytics for Viral Epidemiology) as of Oct 26. LEFT IMAGE: 7d trendline of SARS-CoV-2 signal since spring 2020 (A); Past year (B), and 2 months (C), inferred case incidence (D), and Reff (E) determined with ern (PMID: 38905266). RIGHT IMAGE: other viral traces
Ottawa WAVE (Wastewater Analytics for Viral Epidemiology) as of Oct 26. LEFT IMAGE: 7d trendline of SARS-CoV-2 signal since spring 2020 (A); Past year (B), and 2 months (C), inferred case incidence (D), and Reff (E) determined with ern (PMID: 38905266). RIGHT IMAGE: other viral traces


October 30, 2025 at 7:55 PM
Ottawa WAVE (Wastewater Analytics for Viral Epidemiology) as of Oct 26. LEFT IMAGE: 7d trendline of SARS-CoV-2 signal since spring 2020 (A); Past year (B), and 2 months (C), inferred case incidence (D), and Reff (E) determined with ern (PMID: 38905266). RIGHT IMAGE: other viral traces