


Nicolas Fulghum
@nicolasfulghum.bsky.social
Senior Energy and Climate Data Analyst @emberenergy.bsky.social
Finding, curating and explaining the data behind the global energy⚡️transition.
Finding, curating and explaining the data behind the global energy⚡️transition.
NEW DATA | Solar generation in 2025 has already exceeded the 2024 total as of September ☀️⚡️
A 31% increase in Q1-Q3 2025, has pushed solar beyond the full year output for 2024, with three months left in 2025.
A 31% increase in Q1-Q3 2025, has pushed solar beyond the full year output for 2024, with three months left in 2025.

November 13, 2025 at 11:12 AM
NEW DATA | Solar generation in 2025 has already exceeded the 2024 total as of September ☀️⚡️
A 31% increase in Q1-Q3 2025, has pushed solar beyond the full year output for 2024, with three months left in 2025.
A 31% increase in Q1-Q3 2025, has pushed solar beyond the full year output for 2024, with three months left in 2025.
The central player so far in 2025 is once again solar, dwarfing changes from other sources ☀️
The yoy increase of 498 TWh in Q1-Q3 was three times larger than the next biggest increase from wind.
Solar's rise is in stark contrast to stagnating fossil generation.
The yoy increase of 498 TWh in Q1-Q3 was three times larger than the next biggest increase from wind.
Solar's rise is in stark contrast to stagnating fossil generation.

November 13, 2025 at 8:36 AM
The central player so far in 2025 is once again solar, dwarfing changes from other sources ☀️
The yoy increase of 498 TWh in Q1-Q3 was three times larger than the next biggest increase from wind.
Solar's rise is in stark contrast to stagnating fossil generation.
The yoy increase of 498 TWh in Q1-Q3 was three times larger than the next biggest increase from wind.
Solar's rise is in stark contrast to stagnating fossil generation.
Our latest power sector analysis out today shows that in the first three quarters of 2025, solar and wind exceeded the growth in electricity demand globally.
Combined with an increase in nuclear generation and falls in hydro power, fossil generation saw a minor decline in Q1-Q3.
Combined with an increase in nuclear generation and falls in hydro power, fossil generation saw a minor decline in Q1-Q3.

November 13, 2025 at 8:36 AM
Our latest power sector analysis out today shows that in the first three quarters of 2025, solar and wind exceeded the growth in electricity demand globally.
Combined with an increase in nuclear generation and falls in hydro power, fossil generation saw a minor decline in Q1-Q3.
Combined with an increase in nuclear generation and falls in hydro power, fossil generation saw a minor decline in Q1-Q3.
NEW | No growth for fossil fuels in global electricity generation expected in 2025 🔥❌
Ember forecasts no increase in fossil generation as wind and solar are growing fast enough to meet all new electricity demand.
Ember forecasts no increase in fossil generation as wind and solar are growing fast enough to meet all new electricity demand.

November 13, 2025 at 8:36 AM
NEW | No growth for fossil fuels in global electricity generation expected in 2025 🔥❌
Ember forecasts no increase in fossil generation as wind and solar are growing fast enough to meet all new electricity demand.
Ember forecasts no increase in fossil generation as wind and solar are growing fast enough to meet all new electricity demand.
NEW data | Less than 50% of Australia's electricity generation came from fossil fuels in October 🇦🇺⚡️
This was the first month ever where renewables have overtaken fossil fuels in Australia's electricity mix.
10 years ago, in October 2015, fossil fuels made up 86%.
This was the first month ever where renewables have overtaken fossil fuels in Australia's electricity mix.
10 years ago, in October 2015, fossil fuels made up 86%.

November 10, 2025 at 11:08 AM
NEW data | Less than 50% of Australia's electricity generation came from fossil fuels in October 🇦🇺⚡️
This was the first month ever where renewables have overtaken fossil fuels in Australia's electricity mix.
10 years ago, in October 2015, fossil fuels made up 86%.
This was the first month ever where renewables have overtaken fossil fuels in Australia's electricity mix.
10 years ago, in October 2015, fossil fuels made up 86%.
LATEST DATA | Strong solar additions and favourable hydro conditions in China pushed coal power down 5.4% in September compared to 2024 🇨🇳⚡️
Year-to-date, coal power remains down 1.4%.
Year-to-date, coal power remains down 1.4%.

October 28, 2025 at 4:59 PM
LATEST DATA | Strong solar additions and favourable hydro conditions in China pushed coal power down 5.4% in September compared to 2024 🇨🇳⚡️
Year-to-date, coal power remains down 1.4%.
Year-to-date, coal power remains down 1.4%.
Another new record for batteries in California 🔋⚡️
Batteries met a record high 37.2% of load at 6:25pm yesterday, Oct 12.
The share of load remained at >30% for two whole hours from 5:50 to 7:50 during peak demand and discharged late into the night, reducing gas and imports.
Batteries met a record high 37.2% of load at 6:25pm yesterday, Oct 12.
The share of load remained at >30% for two whole hours from 5:50 to 7:50 during peak demand and discharged late into the night, reducing gas and imports.

October 13, 2025 at 3:28 PM
Another new record for batteries in California 🔋⚡️
Batteries met a record high 37.2% of load at 6:25pm yesterday, Oct 12.
The share of load remained at >30% for two whole hours from 5:50 to 7:50 during peak demand and discharged late into the night, reducing gas and imports.
Batteries met a record high 37.2% of load at 6:25pm yesterday, Oct 12.
The share of load remained at >30% for two whole hours from 5:50 to 7:50 during peak demand and discharged late into the night, reducing gas and imports.
NEW | EU solar generation has already exceeded its 2024 total as of September ☀️🇪🇺
Solar is by far the fastest growing source of electricity in the EU, up 20% year-on-year.
Solar is by far the fastest growing source of electricity in the EU, up 20% year-on-year.

October 11, 2025 at 10:10 AM
NEW | EU solar generation has already exceeded its 2024 total as of September ☀️🇪🇺
Solar is by far the fastest growing source of electricity in the EU, up 20% year-on-year.
Solar is by far the fastest growing source of electricity in the EU, up 20% year-on-year.
NEW DATA | For the first time ever, wind and solar produced more than 50% of the UK's electricity ☀️🍃🇬🇧
🏆 In September, wind and solar generation reached a share of 50.4%
Both wind and solar generation also reached new absolute output records for the month of September:
Wind: 7.7 TWh
Solar: 1.7 TWh
🏆 In September, wind and solar generation reached a share of 50.4%
Both wind and solar generation also reached new absolute output records for the month of September:
Wind: 7.7 TWh
Solar: 1.7 TWh

October 9, 2025 at 5:52 PM
NEW DATA | For the first time ever, wind and solar produced more than 50% of the UK's electricity ☀️🍃🇬🇧
🏆 In September, wind and solar generation reached a share of 50.4%
Both wind and solar generation also reached new absolute output records for the month of September:
Wind: 7.7 TWh
Solar: 1.7 TWh
🏆 In September, wind and solar generation reached a share of 50.4%
Both wind and solar generation also reached new absolute output records for the month of September:
Wind: 7.7 TWh
Solar: 1.7 TWh
NEW @ember-energy.org report out today | Renewables now produce more electricity than coal worldwide ⚡️
Renewables produced 5,072 TWh (34.4% share) in the first half of 2025 overtaking coal for the first time which stood at 4,896 TWh (33.1%.)
Renewables produced 5,072 TWh (34.4% share) in the first half of 2025 overtaking coal for the first time which stood at 4,896 TWh (33.1%.)

October 7, 2025 at 4:10 PM
NEW @ember-energy.org report out today | Renewables now produce more electricity than coal worldwide ⚡️
Renewables produced 5,072 TWh (34.4% share) in the first half of 2025 overtaking coal for the first time which stood at 4,896 TWh (33.1%.)
Renewables produced 5,072 TWh (34.4% share) in the first half of 2025 overtaking coal for the first time which stood at 4,896 TWh (33.1%.)
More than 5% isn't possible...more than 10% isn't possible...
Solar was already at 8.8% of GLOBAL electricity generation in the first half of 2025, more than doubling since 2021 (3.8%). ☀️
I guess 30% is the new limit??
🇭🇺Hungary: 29.7%
🇬🇷Greece: 26.3%
🇳🇱Netherlands: 25.7%
Solar was already at 8.8% of GLOBAL electricity generation in the first half of 2025, more than doubling since 2021 (3.8%). ☀️
I guess 30% is the new limit??
🇭🇺Hungary: 29.7%
🇬🇷Greece: 26.3%
🇳🇱Netherlands: 25.7%

October 7, 2025 at 3:20 PM
More than 5% isn't possible...more than 10% isn't possible...
Solar was already at 8.8% of GLOBAL electricity generation in the first half of 2025, more than doubling since 2021 (3.8%). ☀️
I guess 30% is the new limit??
🇭🇺Hungary: 29.7%
🇬🇷Greece: 26.3%
🇳🇱Netherlands: 25.7%
Solar was already at 8.8% of GLOBAL electricity generation in the first half of 2025, more than doubling since 2021 (3.8%). ☀️
I guess 30% is the new limit??
🇭🇺Hungary: 29.7%
🇬🇷Greece: 26.3%
🇳🇱Netherlands: 25.7%
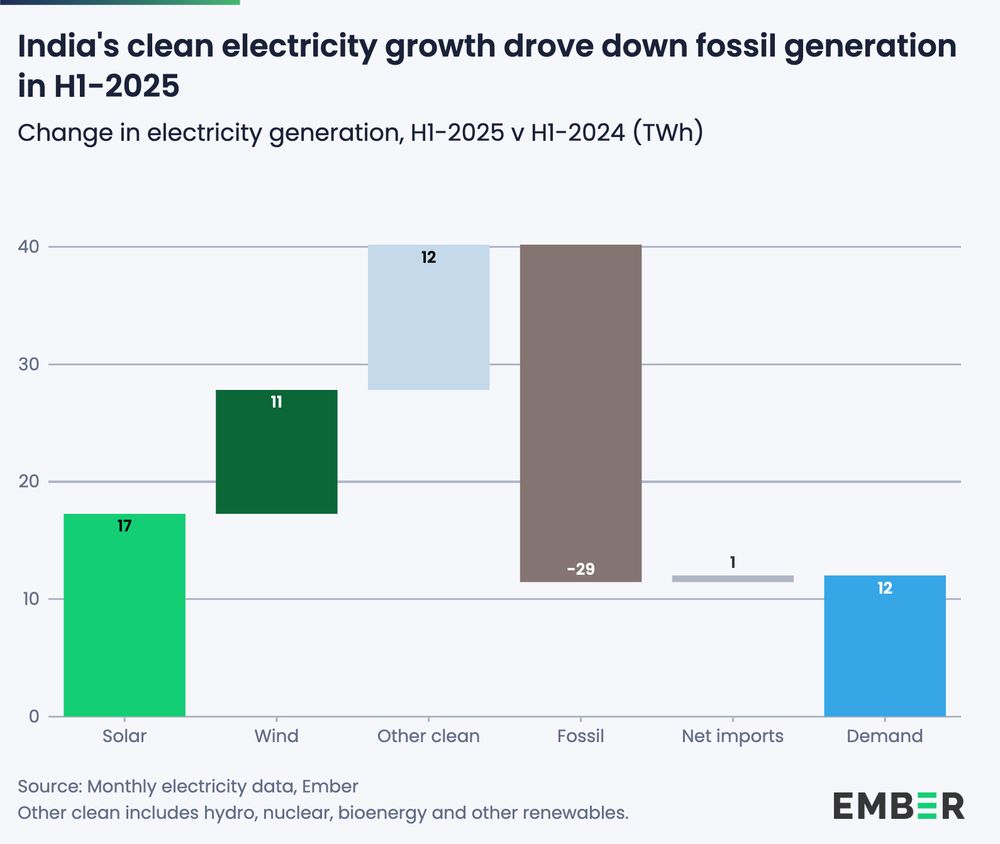
However, even periods of low demand growth would have not led to substantial fossil fuel falls in the past in India.
The difference now? Record growth in wind and solar generation.
The difference now? Record growth in wind and solar generation.

October 7, 2025 at 7:16 AM
However, even periods of low demand growth would have not led to substantial fossil fuel falls in the past in India.
The difference now? Record growth in wind and solar generation.
The difference now? Record growth in wind and solar generation.
The slow demand growth was caused by temperature differences between 2025 and 2024.
2024 saw record heatwaves push up cooling demand, but 2025 has been much milder. This moderated demand growth, sometimes even dropping below 2024 levels, a rare sight in India's steadily growing power sector.
2024 saw record heatwaves push up cooling demand, but 2025 has been much milder. This moderated demand growth, sometimes even dropping below 2024 levels, a rare sight in India's steadily growing power sector.

October 7, 2025 at 7:16 AM
The slow demand growth was caused by temperature differences between 2025 and 2024.
2024 saw record heatwaves push up cooling demand, but 2025 has been much milder. This moderated demand growth, sometimes even dropping below 2024 levels, a rare sight in India's steadily growing power sector.
2024 saw record heatwaves push up cooling demand, but 2025 has been much milder. This moderated demand growth, sometimes even dropping below 2024 levels, a rare sight in India's steadily growing power sector.
In India, record solar and wind growth combined with favourable hydro conditions to drive fossil generation down substantially. However, electricity demand increased by just 1.3% compared to a 9% increase in H1-2024.
October 7, 2025 at 7:16 AM
In India, record solar and wind growth combined with favourable hydro conditions to drive fossil generation down substantially. However, electricity demand increased by just 1.3% compared to a 9% increase in H1-2024.
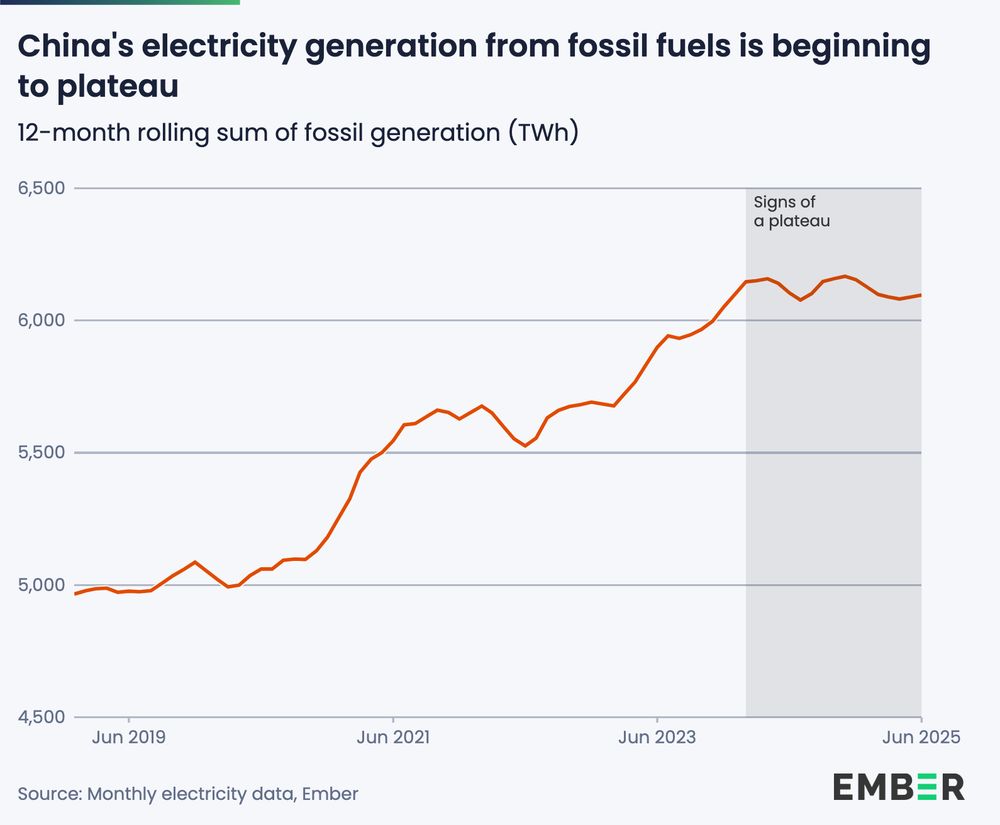
The first half of 2025 is the continuation of a flattening out of fossil generation in China.
Fossil power has plateaued since early 2024 as solar and wind have been matching or growing faster than electricity demand.
Fossil power has plateaued since early 2024 as solar and wind have been matching or growing faster than electricity demand.
October 7, 2025 at 7:16 AM
The first half of 2025 is the continuation of a flattening out of fossil generation in China.
Fossil power has plateaued since early 2024 as solar and wind have been matching or growing faster than electricity demand.
Fossil power has plateaued since early 2024 as solar and wind have been matching or growing faster than electricity demand.
The fall in fossil generation in India and China had slightly different reasons.
In China, low-carbon power growth from solar, wind (and some nuclear) was higher than the increase in electricity demand, despite a small fall in hydro generation. This led to a decline in coal.
In China, low-carbon power growth from solar, wind (and some nuclear) was higher than the increase in electricity demand, despite a small fall in hydro generation. This led to a decline in coal.

October 7, 2025 at 7:16 AM
The fall in fossil generation in India and China had slightly different reasons.
In China, low-carbon power growth from solar, wind (and some nuclear) was higher than the increase in electricity demand, despite a small fall in hydro generation. This led to a decline in coal.
In China, low-carbon power growth from solar, wind (and some nuclear) was higher than the increase in electricity demand, despite a small fall in hydro generation. This led to a decline in coal.
The continued rapid growth of solar generation meant that renewables overtook coal for the first time.
Coal generation dipped slightly compared to the first half of 2024, with renewables continuing to grow.
Coal generation dipped slightly compared to the first half of 2024, with renewables continuing to grow.
October 7, 2025 at 7:16 AM
The continued rapid growth of solar generation meant that renewables overtook coal for the first time.
Coal generation dipped slightly compared to the first half of 2024, with renewables continuing to grow.
Coal generation dipped slightly compared to the first half of 2024, with renewables continuing to grow.
On a global level, wind and solar met and exceeded the growth in electricity demand, particularly as a result of record breaking solar growth.
A fall in hydro negated some of the growth in solar, wind and nuclear, but fossil fuels still saw a small decline.
A fall in hydro negated some of the growth in solar, wind and nuclear, but fossil fuels still saw a small decline.

October 7, 2025 at 7:16 AM
On a global level, wind and solar met and exceeded the growth in electricity demand, particularly as a result of record breaking solar growth.
A fall in hydro negated some of the growth in solar, wind and nuclear, but fossil fuels still saw a small decline.
A fall in hydro negated some of the growth in solar, wind and nuclear, but fossil fuels still saw a small decline.
NEW | Electricity generation from fossil fuels fell in China and India in the first half of 2025 🔥📉
This marks a reversal from previous trends.
Simultaneously, there was a small uptick in the US and in the EU.
A thread 🧵
This marks a reversal from previous trends.
Simultaneously, there was a small uptick in the US and in the EU.
A thread 🧵

October 7, 2025 at 7:16 AM
NEW | Electricity generation from fossil fuels fell in China and India in the first half of 2025 🔥📉
This marks a reversal from previous trends.
Simultaneously, there was a small uptick in the US and in the EU.
A thread 🧵
This marks a reversal from previous trends.
Simultaneously, there was a small uptick in the US and in the EU.
A thread 🧵
The new data explorer also includes a full breakdown of every technology by country.

October 6, 2025 at 8:22 AM
The new data explorer also includes a full breakdown of every technology by country.
Despite the cost declines, the value of battery exports is higher than ever🔋

October 6, 2025 at 8:22 AM
Despite the cost declines, the value of battery exports is higher than ever🔋
In fact, solar module exports reached a record high in August according to our existing tracking of GW exports for cells, panels and wafers.
At the same time, the value of solar PV exports peaked in early 2023 as our new tool shows.
At the same time, the value of solar PV exports peaked in early 2023 as our new tool shows.


October 6, 2025 at 8:22 AM
In fact, solar module exports reached a record high in August according to our existing tracking of GW exports for cells, panels and wafers.
At the same time, the value of solar PV exports peaked in early 2023 as our new tool shows.
At the same time, the value of solar PV exports peaked in early 2023 as our new tool shows.
The increase in export value is even more impressive considering the substantial fall in costs for some clean technologies like batteries and solar modules.

October 6, 2025 at 8:22 AM
The increase in export value is even more impressive considering the substantial fall in costs for some clean technologies like batteries and solar modules.
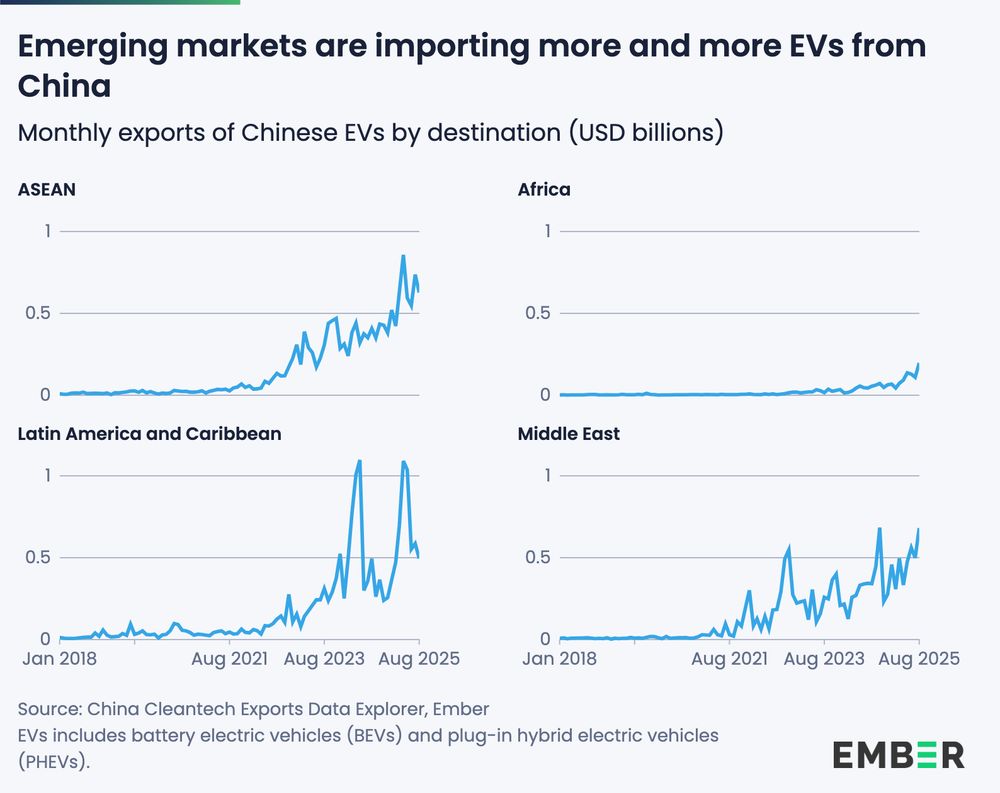
For EVs, emerging markets like ASEAN or the Middle East are becoming increasingly important.
October 6, 2025 at 8:22 AM
For EVs, emerging markets like ASEAN or the Middle East are becoming increasingly important.
EV and battery exports are the biggest drivers of the growth in export value. In the last 12 months, China exported $76bn of batteries and $57bn of EVs.
The export value of batteries is 4x higher than in 2020, the value of EV exports has grown 10x.
The export value of batteries is 4x higher than in 2020, the value of EV exports has grown 10x.

October 6, 2025 at 8:22 AM
EV and battery exports are the biggest drivers of the growth in export value. In the last 12 months, China exported $76bn of batteries and $57bn of EVs.
The export value of batteries is 4x higher than in 2020, the value of EV exports has grown 10x.
The export value of batteries is 4x higher than in 2020, the value of EV exports has grown 10x.