


Matt Patterson
@mattpattclimate.bsky.social
Research Fellow at the University of St Andrews and NCAS in climate science and ML. Interests in climate dynamics, jet streams and long-term prediction. Formerly at University of Reading and University of Oxford.
Very rarely does this happen to me so when it happened today I felt the need to mark it with a meme.
(Calculations of transports in ocean straits, StraitFlux doi.org/10.5194/gmd-... for those interested)
(Calculations of transports in ocean straits, StraitFlux doi.org/10.5194/gmd-... for those interested)

November 11, 2025 at 8:49 PM
Very rarely does this happen to me so when it happened today I felt the need to mark it with a meme.
(Calculations of transports in ocean straits, StraitFlux doi.org/10.5194/gmd-... for those interested)
(Calculations of transports in ocean straits, StraitFlux doi.org/10.5194/gmd-... for those interested)
Looks like it may be a mild and wet Autumn / early Winter for the UK and particularly Scotland 🙄.
Probably depends quite a bit on the placement of that high over the Atlantic.
Probably depends quite a bit on the placement of that high over the Atlantic.


September 10, 2025 at 1:18 PM
Looks like it may be a mild and wet Autumn / early Winter for the UK and particularly Scotland 🙄.
Probably depends quite a bit on the placement of that high over the Atlantic.
Probably depends quite a bit on the placement of that high over the Atlantic.
Also, a lot of people live in the East in the drier, more drought exposed places like the cities of Edinburgh, Dundee and Aberdeen.

August 25, 2025 at 6:17 PM
Also, a lot of people live in the East in the drier, more drought exposed places like the cities of Edinburgh, Dundee and Aberdeen.
There's a lot of detail in the paper about the potential drivers of the model-observations trend differences. These include differing atmospheric variability, different responses to forcing, the El Niño-like trend bias. Interestingly these trend errors could develop within a week or two.

August 14, 2025 at 10:50 AM
There's a lot of detail in the paper about the potential drivers of the model-observations trend differences. These include differing atmospheric variability, different responses to forcing, the El Niño-like trend bias. Interestingly these trend errors could develop within a week or two.
Looking more regionally, the reason for this discrepancy differed between seasons.
In DJF, the models warmed too much over northern mid-latitudes while in JJA, the models warmed too much in the tropical Pacific (consistent with an El Niño trend bias) and southern Ocean.
In DJF, the models warmed too much over northern mid-latitudes while in JJA, the models warmed too much in the tropical Pacific (consistent with an El Niño trend bias) and southern Ocean.

August 14, 2025 at 10:50 AM
Looking more regionally, the reason for this discrepancy differed between seasons.
In DJF, the models warmed too much over northern mid-latitudes while in JJA, the models warmed too much in the tropical Pacific (consistent with an El Niño trend bias) and southern Ocean.
In DJF, the models warmed too much over northern mid-latitudes while in JJA, the models warmed too much in the tropical Pacific (consistent with an El Niño trend bias) and southern Ocean.
We compared trends in 8 seasonal forecast systems to two reanalyses and two gridded observational products over the 1993-2016 period.
7 out of the 8 systems overestimated the trend in both boreal summer and winter.
7 out of the 8 systems overestimated the trend in both boreal summer and winter.

August 14, 2025 at 10:50 AM
We compared trends in 8 seasonal forecast systems to two reanalyses and two gridded observational products over the 1993-2016 period.
7 out of the 8 systems overestimated the trend in both boreal summer and winter.
7 out of the 8 systems overestimated the trend in both boreal summer and winter.
A warm day across the UK but look at the cooling effect of the sea along the coasts!
istheukhotrightnow.com
istheukhotrightnow.com

August 12, 2025 at 8:37 PM
A warm day across the UK but look at the cooling effect of the sea along the coasts!
istheukhotrightnow.com
istheukhotrightnow.com
If the UK was asked to name it…

July 22, 2025 at 10:50 AM
If the UK was asked to name it…
The east of Scotland dodged the heat today due to a cold sea fog (haar).
A high of 32C in Aviemore (inland) but only 20C in Leuchars (near the coast)!
A high of 32C in Aviemore (inland) but only 20C in Leuchars (near the coast)!

July 12, 2025 at 9:19 PM
The east of Scotland dodged the heat today due to a cold sea fog (haar).
A high of 32C in Aviemore (inland) but only 20C in Leuchars (near the coast)!
A high of 32C in Aviemore (inland) but only 20C in Leuchars (near the coast)!
Looks like they’ve clarified this now! Parts of England =/= the UK

July 11, 2025 at 10:31 AM
Looks like they’ve clarified this now! Parts of England =/= the UK
One thing I have learned from spending far too much time looking at istheukhotrightnow.com is the strong skew in summer temperatures.
The most common temperature for Benson at 3pm in late June is 18-19C, but the cold tail is 8C cooler while the hot tail is 14C warmer. @edhawkins.org
The most common temperature for Benson at 3pm in late June is 18-19C, but the cold tail is 8C cooler while the hot tail is 14C warmer. @edhawkins.org

June 23, 2025 at 11:03 AM
One thing I have learned from spending far too much time looking at istheukhotrightnow.com is the strong skew in summer temperatures.
The most common temperature for Benson at 3pm in late June is 18-19C, but the cold tail is 8C cooler while the hot tail is 14C warmer. @edhawkins.org
The most common temperature for Benson at 3pm in late June is 18-19C, but the cold tail is 8C cooler while the hot tail is 14C warmer. @edhawkins.org
With temperatures increasing over the next few days, it’s worth remembering that the hottest summer days have warmed more than twice as fast as average summer days in England over recent decades.
agupubs.onlinelibrary.wiley.com/doi/full/10....
agupubs.onlinelibrary.wiley.com/doi/full/10....

June 17, 2025 at 8:11 AM
With temperatures increasing over the next few days, it’s worth remembering that the hottest summer days have warmed more than twice as fast as average summer days in England over recent decades.
agupubs.onlinelibrary.wiley.com/doi/full/10....
agupubs.onlinelibrary.wiley.com/doi/full/10....
No strong atmospheric circulation signal so this is likely driven by warm SSTs persisting from spring and the general global warming trend.
climatereanalyzer.org
climatereanalyzer.org

June 11, 2025 at 10:18 AM
No strong atmospheric circulation signal so this is likely driven by warm SSTs persisting from spring and the general global warming trend.
climatereanalyzer.org
climatereanalyzer.org
The chance of a very warm July and August remains high in the latest set of @copernicusecmwf.bsky.social C3S seasonal forecasts (June start date)
50-70% probability of each month being in the hottest 20% (compared to 1993-2016).
climate.copernicus.eu/charts/packa...
50-70% probability of each month being in the hottest 20% (compared to 1993-2016).
climate.copernicus.eu/charts/packa...


June 11, 2025 at 10:18 AM
The chance of a very warm July and August remains high in the latest set of @copernicusecmwf.bsky.social C3S seasonal forecasts (June start date)
50-70% probability of each month being in the hottest 20% (compared to 1993-2016).
climate.copernicus.eu/charts/packa...
50-70% probability of each month being in the hottest 20% (compared to 1993-2016).
climate.copernicus.eu/charts/packa...
Interesting to see both the BBC and Guardian running stories on seasonal predictions, that UK summer is twice as likely as usual to be hot (upper quintile)
Probably a combination of warming trend and warm SSTs after blocking highs in spring.
www.theguardian.com/uk-news/2025...
Probably a combination of warming trend and warm SSTs after blocking highs in spring.
www.theguardian.com/uk-news/2025...


June 1, 2025 at 8:17 PM
Interesting to see both the BBC and Guardian running stories on seasonal predictions, that UK summer is twice as likely as usual to be hot (upper quintile)
Probably a combination of warming trend and warm SSTs after blocking highs in spring.
www.theguardian.com/uk-news/2025...
Probably a combination of warming trend and warm SSTs after blocking highs in spring.
www.theguardian.com/uk-news/2025...
This spring has been unusually sunny due to persistent high pressure systems.
Interestingly, UK spring has generally been getting sunnier since the 1980s (likely due to reductions in aerosols) though there’s also some multidecadal variation.
Interestingly, UK spring has generally been getting sunnier since the 1980s (likely due to reductions in aerosols) though there’s also some multidecadal variation.

May 28, 2025 at 11:34 AM
This spring has been unusually sunny due to persistent high pressure systems.
Interestingly, UK spring has generally been getting sunnier since the 1980s (likely due to reductions in aerosols) though there’s also some multidecadal variation.
Interestingly, UK spring has generally been getting sunnier since the 1980s (likely due to reductions in aerosols) though there’s also some multidecadal variation.
This is getting very annoying

May 23, 2025 at 2:23 PM
This is getting very annoying
There is a pretty clear reduction in future blocking occurrence in CMIP models. Very weird how the opposite of this has become established in popular discourse. Figure from Woollings et al 2018 link.springer.com/article/10.1...

April 25, 2025 at 9:02 AM
There is a pretty clear reduction in future blocking occurrence in CMIP models. Very weird how the opposite of this has become established in popular discourse. Figure from Woollings et al 2018 link.springer.com/article/10.1...
You can explore when we might pass this threshold based on extrapolating from obs using this tool
apps.climate.copernicus.eu/global-tempe...
2/
apps.climate.copernicus.eu/global-tempe...
2/

April 22, 2025 at 3:43 PM
You can explore when we might pass this threshold based on extrapolating from obs using this tool
apps.climate.copernicus.eu/global-tempe...
2/
apps.climate.copernicus.eu/global-tempe...
2/
One other key difference is that St Andrews is quite a bit windier due to its location on the east coast.

April 1, 2025 at 1:28 PM
One other key difference is that St Andrews is quite a bit windier due to its location on the east coast.
Temperature is inevitably different, but not as different as you might think.
The average winter Tmax and Tmin are only about 1.5C cooler in Leuchars.
The big difference is in summer when the average Tmax is 3.5C warmer in Reading.
I don't particularly mind slightly cooler summer days!
The average winter Tmax and Tmin are only about 1.5C cooler in Leuchars.
The big difference is in summer when the average Tmax is 3.5C warmer in Reading.
I don't particularly mind slightly cooler summer days!


April 1, 2025 at 1:28 PM
Temperature is inevitably different, but not as different as you might think.
The average winter Tmax and Tmin are only about 1.5C cooler in Leuchars.
The big difference is in summer when the average Tmax is 3.5C warmer in Reading.
I don't particularly mind slightly cooler summer days!
The average winter Tmax and Tmin are only about 1.5C cooler in Leuchars.
The big difference is in summer when the average Tmax is 3.5C warmer in Reading.
I don't particularly mind slightly cooler summer days!
They both receive a very similar amount of rainfall at 658 vs 712mm/year.
There is a striking east-west contrast in rainfall across the UK due to south-westerly winds. Rainfall in the west exacerbated is by mountains.
Glasgow is less than 40 miles west of Edinburgh but receives 60% more rain!
There is a striking east-west contrast in rainfall across the UK due to south-westerly winds. Rainfall in the west exacerbated is by mountains.
Glasgow is less than 40 miles west of Edinburgh but receives 60% more rain!


April 1, 2025 at 1:28 PM
They both receive a very similar amount of rainfall at 658 vs 712mm/year.
There is a striking east-west contrast in rainfall across the UK due to south-westerly winds. Rainfall in the west exacerbated is by mountains.
Glasgow is less than 40 miles west of Edinburgh but receives 60% more rain!
There is a striking east-west contrast in rainfall across the UK due to south-westerly winds. Rainfall in the west exacerbated is by mountains.
Glasgow is less than 40 miles west of Edinburgh but receives 60% more rain!
The nearest Met Office weather station to St Andrews is in Leuchars. Perhaps surprisingly, Reading and Leuchars experience a near identical number of sunshine hours each year at 1574 vs 1577 hours.
(rough locations shown by blue crosses)
(rough locations shown by blue crosses)


April 1, 2025 at 1:28 PM
The nearest Met Office weather station to St Andrews is in Leuchars. Perhaps surprisingly, Reading and Leuchars experience a near identical number of sunshine hours each year at 1574 vs 1577 hours.
(rough locations shown by blue crosses)
(rough locations shown by blue crosses)
I am delighted to say that I have started a new role as a research fellow at @uniofstandrews.bsky.social with @ncas-uk.bsky.social. I'll be working in a team applying ML to climate problems.
As a climate scientist, I was interested in how the climate of St Andrews would differ from Reading...
🧵
As a climate scientist, I was interested in how the climate of St Andrews would differ from Reading...
🧵

April 1, 2025 at 1:28 PM
I am delighted to say that I have started a new role as a research fellow at @uniofstandrews.bsky.social with @ncas-uk.bsky.social. I'll be working in a team applying ML to climate problems.
As a climate scientist, I was interested in how the climate of St Andrews would differ from Reading...
🧵
As a climate scientist, I was interested in how the climate of St Andrews would differ from Reading...
🧵
Good questions!
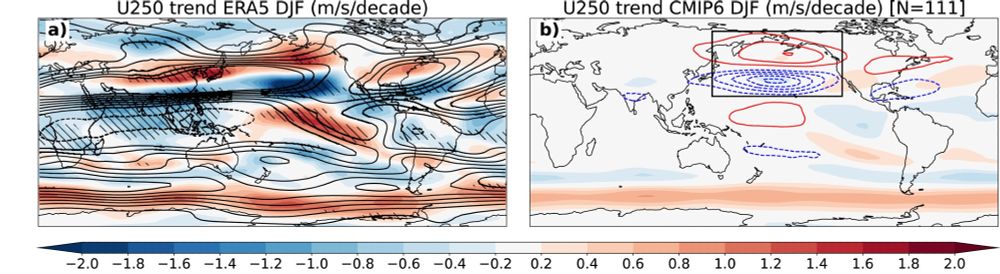
We found that models with a more northward shift in the North Pacific also showed a more northward shift for the Atlantic.
Unfilled contours in the right hand panel show the first EOF of CMIP6 U250 trends for the North Pacific sector.
We found that models with a more northward shift in the North Pacific also showed a more northward shift for the Atlantic.
Unfilled contours in the right hand panel show the first EOF of CMIP6 U250 trends for the North Pacific sector.
February 18, 2025 at 7:57 PM
Good questions!
We found that models with a more northward shift in the North Pacific also showed a more northward shift for the Atlantic.
Unfilled contours in the right hand panel show the first EOF of CMIP6 U250 trends for the North Pacific sector.
We found that models with a more northward shift in the North Pacific also showed a more northward shift for the Atlantic.
Unfilled contours in the right hand panel show the first EOF of CMIP6 U250 trends for the North Pacific sector.