


How To Read This Chart
@howtoreadthisch.art
A weekly newsletter about data, data visualizations and the aggregated weirdness of the world around us. A pbump.com project.
https://howtoreadthisch.art
https://howtoreadthisch.art
In this week’s newsletter, spoke with Yale University’s William Rankin about his new book on rethinking how we draw maps.
www.howtoreadthisch.art/putting-the-...
www.howtoreadthisch.art/putting-the-...


November 15, 2025 at 8:31 PM
In this week’s newsletter, spoke with Yale University’s William Rankin about his new book on rethinking how we draw maps.
www.howtoreadthisch.art/putting-the-...
www.howtoreadthisch.art/putting-the-...
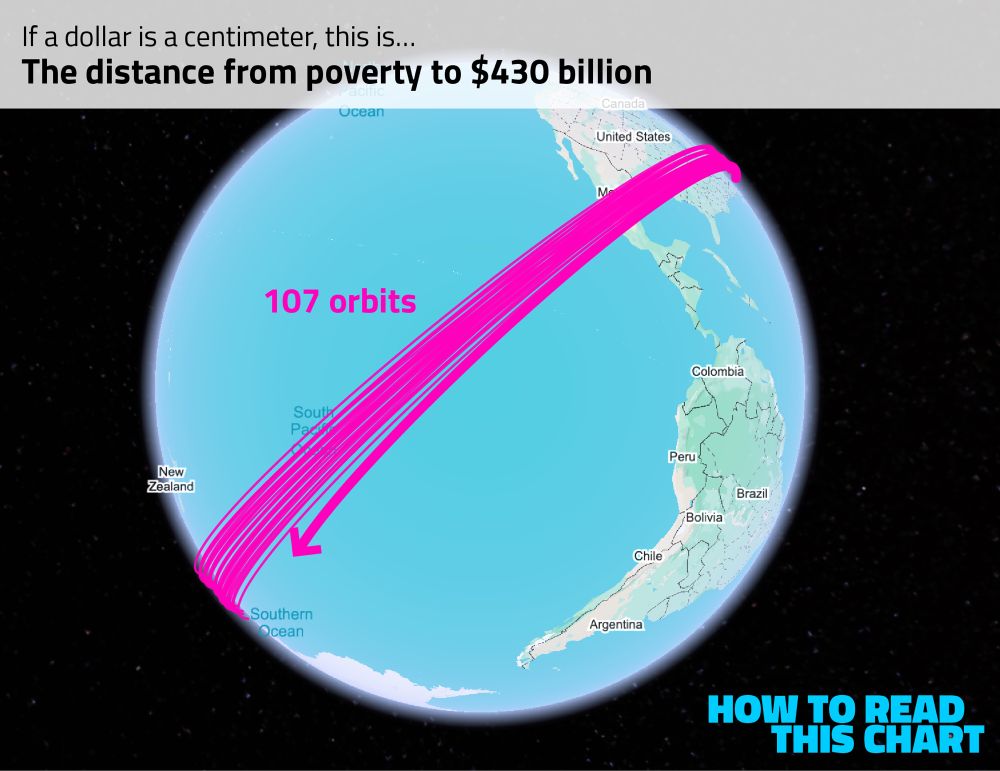
The richest person on that list is Elon Musk. Convert his net worth to centimeters and it’s enough to circle the globe more than 100 times.
It’s not even really comparable.
7/8
It’s not even really comparable.
7/8
November 15, 2025 at 4:55 PM
The richest person on that list is Elon Musk. Convert his net worth to centimeters and it’s enough to circle the globe more than 100 times.
It’s not even really comparable.
7/8
It’s not even really comparable.
7/8
So what happens when you get to the billionaires? Well, Bloomberg has a running list of the wealthiest people in the world.
The poorest of that 500-person list is almost two complete orbits of the globe away from poverty.
6/8
The poorest of that 500-person list is almost two complete orbits of the globe away from poverty.
6/8

November 15, 2025 at 4:55 PM
So what happens when you get to the billionaires? Well, Bloomberg has a running list of the wealthiest people in the world.
The poorest of that 500-person list is almost two complete orbits of the globe away from poverty.
6/8
The poorest of that 500-person list is almost two complete orbits of the globe away from poverty.
6/8
But only relatively. If you make a million dollars, we’re not even talking about blocks anymore. You’re way out in the harbor.
5/8
5/8

November 15, 2025 at 4:55 PM
But only relatively. If you make a million dollars, we’re not even talking about blocks anymore. You’re way out in the harbor.
5/8
5/8
If you make $200,000 a year, quite a bit more than poverty level, you end up more than 20 blocks away. Quite a distance!
4/8
4/8

November 15, 2025 at 4:55 PM
If you make $200,000 a year, quite a bit more than poverty level, you end up more than 20 blocks away. Quite a distance!
4/8
4/8
The distance between poverty and the median income, meanwhile, is slightly further: about seven blocks.
3/8
3/8

November 15, 2025 at 4:55 PM
The distance between poverty and the median income, meanwhile, is slightly further: about seven blocks.
3/8
3/8
I decided to convert dollars to centimeters. That allows us to visualize, for example, the distance between having no money and being at poverty level — about four city blocks.
2/8
2/8

November 15, 2025 at 4:55 PM
I decided to convert dollars to centimeters. That allows us to visualize, for example, the distance between having no money and being at poverty level — about four city blocks.
2/8
2/8
Part of this week’s newsletter was inspired by the post below. Was there a way to show the distance between normal Americans and the super wealthy?
1/8
www.howtoreadthisch.art/putting-the-...
1/8
www.howtoreadthisch.art/putting-the-...

November 15, 2025 at 4:55 PM
Part of this week’s newsletter was inspired by the post below. Was there a way to show the distance between normal Americans and the super wealthy?
1/8
www.howtoreadthisch.art/putting-the-...
1/8
www.howtoreadthisch.art/putting-the-...
Here's how the Senate shutdown vote broke down by state vote in 2024 and senator ideology.
The two pink dots to the left of the Arizona senators are the senators from Nevada.
The two pink dots to the left of the Arizona senators are the senators from Nevada.

November 10, 2025 at 4:02 PM
Here's how the Senate shutdown vote broke down by state vote in 2024 and senator ideology.
The two pink dots to the left of the Arizona senators are the senators from Nevada.
The two pink dots to the left of the Arizona senators are the senators from Nevada.
4. Other good charts, like this look at where and when certain behaviors are acceptable.

November 8, 2025 at 4:01 PM
4. Other good charts, like this look at where and when certain behaviors are acceptable.
3. Prediction markets — or, as they probably should be called, “markets.”

November 8, 2025 at 4:01 PM
3. Prediction markets — or, as they probably should be called, “markets.”
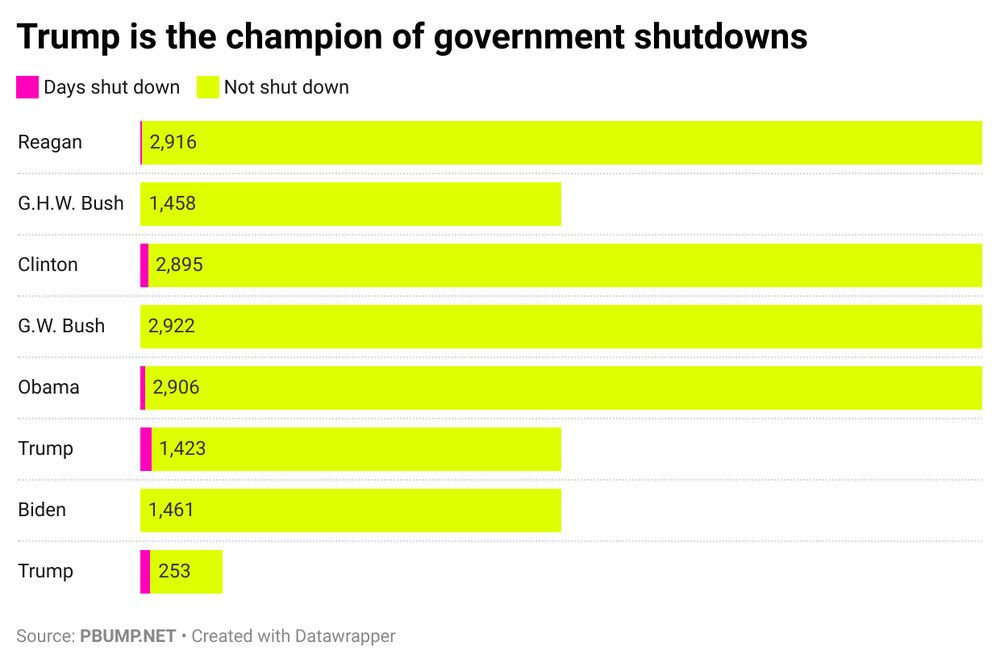
2. Trump and the art of the government shutdown.

November 8, 2025 at 4:01 PM
2. Trump and the art of the government shutdown.
This week, in the free-to-read newsletter:
1. The history of red and blue in TV campaign coverage.
www.howtoreadthisch.art/r/682c3344?m...
1. The history of red and blue in TV campaign coverage.
www.howtoreadthisch.art/r/682c3344?m...

November 8, 2025 at 4:01 PM
This week, in the free-to-read newsletter:
1. The history of red and blue in TV campaign coverage.
www.howtoreadthisch.art/r/682c3344?m...
1. The history of red and blue in TV campaign coverage.
www.howtoreadthisch.art/r/682c3344?m...
Doing some math with the White House.
November 6, 2025 at 7:30 PM
Doing some math with the White House.
Here's how every county in Virginia has voted in gubernatorial and presidential elections since 2012.
www.pbump.net/o/what-chang...
www.pbump.net/o/what-chang...

November 6, 2025 at 3:57 AM
Here's how every county in Virginia has voted in gubernatorial and presidential elections since 2012.
www.pbump.net/o/what-chang...
www.pbump.net/o/what-chang...
The government has been shutdown for more than 4 percent of the days Donald Trump has been president. The runner-up is Clinton, who saw the government shutdown for less than 1 percent.
November 5, 2025 at 6:50 PM
The government has been shutdown for more than 4 percent of the days Donald Trump has been president. The runner-up is Clinton, who saw the government shutdown for less than 1 percent.
4.
Chart attack, including this survey of croissants.
Chart attack, including this survey of croissants.

November 1, 2025 at 4:12 PM
4.
Chart attack, including this survey of croissants.
Chart attack, including this survey of croissants.
3.
The overlap of Tesla and politics.
The overlap of Tesla and politics.

November 1, 2025 at 4:12 PM
3.
The overlap of Tesla and politics.
The overlap of Tesla and politics.
2.
How a senator’s chart became Trump’s disinformation.
How a senator’s chart became Trump’s disinformation.

November 1, 2025 at 4:12 PM
2.
How a senator’s chart became Trump’s disinformation.
How a senator’s chart became Trump’s disinformation.
In the newsletter this week!
www.howtoreadthisch.art/r/46bb4a69?m...
1.
The web of connections revealed in subpoenas issued after Jan. 6.
www.howtoreadthisch.art/r/46bb4a69?m...
1.
The web of connections revealed in subpoenas issued after Jan. 6.

November 1, 2025 at 4:12 PM
In the newsletter this week!
www.howtoreadthisch.art/r/46bb4a69?m...
1.
The web of connections revealed in subpoenas issued after Jan. 6.
www.howtoreadthisch.art/r/46bb4a69?m...
1.
The web of connections revealed in subpoenas issued after Jan. 6.
This is how the organizations and people included in Jack Smith's 2020 subpoenas connect. See more (and close-ups) in this week's newsletter! www.howtoreadthisch.art/the-web-that...

November 1, 2025 at 2:13 PM
This is how the organizations and people included in Jack Smith's 2020 subpoenas connect. See more (and close-ups) in this week's newsletter! www.howtoreadthisch.art/the-web-that...
The last time the House cast any votes was the Friday before Adelita Grijalva won her race. www.pbump.net/o/remember-t...

October 27, 2025 at 5:02 PM
The last time the House cast any votes was the Friday before Adelita Grijalva won her race. www.pbump.net/o/remember-t...
4. Chart Attack!

October 26, 2025 at 3:48 PM
4. Chart Attack!
3. College football’s best and worst seasons!

October 26, 2025 at 3:48 PM
3. College football’s best and worst seasons!
2. A history of documenting dance!

October 26, 2025 at 3:48 PM
2. A history of documenting dance!