


David Johnson
@hockeyanalysis.com
Hockey Analyst and unofficial Keeper of the Cap at http://TheStanleyCap.com. Formerly of the Calgary Flames. Also http://Puckalytics.com http://HockeyAnalysis.com
The 6 month stock market performance is telling the same story. TSX growing nearly twice as fast as S&P 500.

January 9, 2026 at 3:52 PM
The 6 month stock market performance is telling the same story. TSX growing nearly twice as fast as S&P 500.
I don't know how the NHL determines snap vs wrist (shot speed? shot location? shot acceleration?) but the percentage of shots that are either snap or wrist has been incredibly steady, particularly since 2020-21.

January 5, 2026 at 9:28 PM
I don't know how the NHL determines snap vs wrist (shot speed? shot location? shot acceleration?) but the percentage of shots that are either snap or wrist has been incredibly steady, particularly since 2020-21.
Since snap shots historically have a higher shooting percentage this shift would bump up xG for models that use shot type as a component of the xG model (i.e. not mine). It seems this impacts mostly 2024-25 and 2025-26. This is all 5v5 data only.

January 5, 2026 at 9:28 PM
Since snap shots historically have a higher shooting percentage this shift would bump up xG for models that use shot type as a component of the xG model (i.e. not mine). It seems this impacts mostly 2024-25 and 2025-26. This is all 5v5 data only.
These three shots look at the percentage of USAT from each region that are missed shots. Again, the 2023-26 chart is different from the other two in that a higher percentage of shots are missed.


January 4, 2026 at 7:47 PM
These three shots look at the percentage of USAT from each region that are missed shots. Again, the 2023-26 chart is different from the other two in that a higher percentage of shots are missed.
Looks like the change starts in 2023-24. Three charts here showing % of USAT by region, one for 2017-20 (3yrs), one for 2020-23 (3yrs) and one for 2023-26 (2.5yrs). You'll notice 2023-26 is different from the other two. More crease shots, fewer shots up the middle, more on the wings.


January 4, 2026 at 7:47 PM
Looks like the change starts in 2023-24. Three charts here showing % of USAT by region, one for 2017-20 (3yrs), one for 2020-23 (3yrs) and one for 2023-26 (2.5yrs). You'll notice 2023-26 is different from the other two. More crease shots, fewer shots up the middle, more on the wings.
My own model seems to be working fine but mine is calibrated only using data only after shot locations were automated (using player and puck tracking data) and I chose to exclude some of the new stuff (short and failed bank for consistency) so either of those could be contributing factors.

January 2, 2026 at 7:11 PM
My own model seems to be working fine but mine is calibrated only using data only after shot locations were automated (using player and puck tracking data) and I chose to exclude some of the new stuff (short and failed bank for consistency) so either of those could be contributing factors.
Also, the first tariffs on Canada kicked in March 4th. Prior to the tariffs the TSX/S&P500 performance closely mirrored each other. Since then the TSX has significantly out performed.

December 16, 2025 at 8:27 PM
Also, the first tariffs on Canada kicked in March 4th. Prior to the tariffs the TSX/S&P500 performance closely mirrored each other. Since then the TSX has significantly out performed.
After working through some more color schemes, I am leaning towards to a uniform light blue-red color scheme which has a cleaner/simpler look and the grey dots representing other teams show up better. Thoughts?

December 15, 2025 at 5:07 PM
After working through some more color schemes, I am leaning towards to a uniform light blue-red color scheme which has a cleaner/simpler look and the grey dots representing other teams show up better. Thoughts?
My concern is Carolina is a pretty good team but shows more red than blue when presented like this.

December 15, 2025 at 3:50 PM
My concern is Carolina is a pretty good team but shows more red than blue when presented like this.
I did try this early on. There are things I like about it but I wasn't sold on it. But it may be growing on me now (I just need to change the red dot to a different color).

December 15, 2025 at 3:50 PM
I did try this early on. There are things I like about it but I wasn't sold on it. But it may be growing on me now (I just need to change the red dot to a different color).
Working on some team stats cards for TheStanleyCap. First draft here. Is the format intuitive without explanation? Any thoughts (besides Colorado being really good)?

December 15, 2025 at 5:41 AM
Working on some team stats cards for TheStanleyCap. First draft here. Is the format intuitive without explanation? Any thoughts (besides Colorado being really good)?
And one NHL standings observation for this morning.
There are 10 NHL teams with precisely 22 points. That's 31.25% of the league with 22 points. Crazy.
There are 10 NHL teams with precisely 22 points. That's 31.25% of the league with 22 points. Crazy.

November 18, 2025 at 12:09 PM
And one NHL standings observation for this morning.
There are 10 NHL teams with precisely 22 points. That's 31.25% of the league with 22 points. Crazy.
There are 10 NHL teams with precisely 22 points. That's 31.25% of the league with 22 points. Crazy.
Todays goal differential observations...
It is a tale of two divisions in the eastern conference. No Atlantic division team has a goal differential above 0. BOS is even, every other team is negative.
In the Metropolitan division, every team has a positive goal differential except NYI who are -1.
It is a tale of two divisions in the eastern conference. No Atlantic division team has a goal differential above 0. BOS is even, every other team is negative.
In the Metropolitan division, every team has a positive goal differential except NYI who are -1.


November 18, 2025 at 12:09 PM
Todays goal differential observations...
It is a tale of two divisions in the eastern conference. No Atlantic division team has a goal differential above 0. BOS is even, every other team is negative.
In the Metropolitan division, every team has a positive goal differential except NYI who are -1.
It is a tale of two divisions in the eastern conference. No Atlantic division team has a goal differential above 0. BOS is even, every other team is negative.
In the Metropolitan division, every team has a positive goal differential except NYI who are -1.
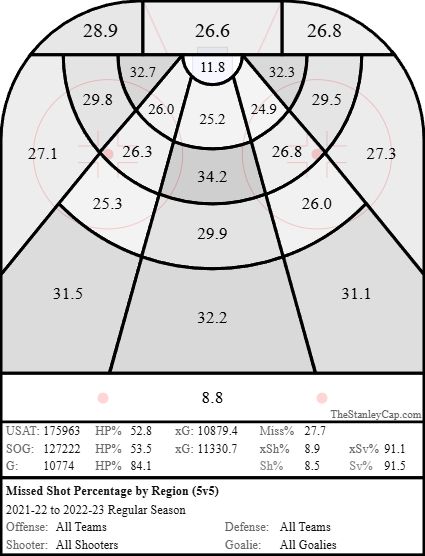
So I looked at missed shot % (missed shots / all unblocked shots) by shot location and it seems fairly uniform. First image is 2023-24 and 2024-25 combined and the second image 2021-22 and 2022-23 combined.

November 4, 2025 at 4:25 AM
So I looked at missed shot % (missed shots / all unblocked shots) by shot location and it seems fairly uniform. First image is 2023-24 and 2024-25 combined and the second image 2021-22 and 2022-23 combined.
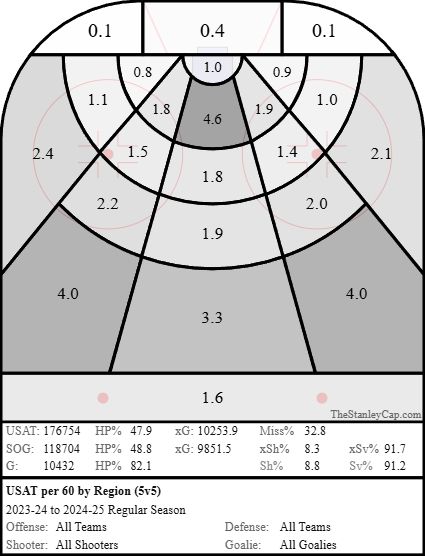
Even if you look at USAT per 60 you also see a similar push towards the wings from up the middle. Again, these show 2023-24 to 2024-25 combine and 2021-22 and 2022-23 combined.

November 3, 2025 at 9:16 PM
Even if you look at USAT per 60 you also see a similar push towards the wings from up the middle. Again, these show 2023-24 to 2024-25 combine and 2021-22 and 2022-23 combined.
Even if we go back further and look at 2017-18 to 2020-21 combined data (prior to NHL Edge) we see similar data to 2021-22 and 2022-23.

November 3, 2025 at 9:16 PM
Even if we go back further and look at 2017-18 to 2020-21 combined data (prior to NHL Edge) we see similar data to 2021-22 and 2022-23.
There seems to be a shift in shot on goal locations out towards the wings from the center ice. These show the percentage of shots on goal from each shot zone, first for 2023-24 and 2024-25 combined and the second for 2021-22 and 2022-23 combined.


November 3, 2025 at 9:16 PM
There seems to be a shift in shot on goal locations out towards the wings from the center ice. These show the percentage of shots on goal from each shot zone, first for 2023-24 and 2024-25 combined and the second for 2021-22 and 2022-23 combined.
I don't really understand why a dozen other teams weren't interested in Reichel at a cost of a 4th round pick. His career has been mixed so far but he has some skill and there is still upside. Good skater, not a hard shot but a good shot. He just never found his role on the re-building Blackhawks.

October 24, 2025 at 8:14 PM
I don't really understand why a dozen other teams weren't interested in Reichel at a cost of a 4th round pick. His career has been mixed so far but he has some skill and there is still upside. Good skater, not a hard shot but a good shot. He just never found his role on the re-building Blackhawks.

For completeness I'll show the the shots against chart for when Jake Bean is on the ice. It's a little more evenly distributed left and right.

October 23, 2025 at 3:05 PM
For completeness I'll show the the shots against chart for when Jake Bean is on the ice. It's a little more evenly distributed left and right.
There was also no right side bias when Hanley was on the ice in his Dallas years either so it seems unique to the early part of this season. Furthermore, his player card doesn't indicate he is a bad defensive player (though he doesn't play tough minutes either).

October 23, 2025 at 3:05 PM
There was also no right side bias when Hanley was on the ice in his Dallas years either so it seems unique to the early part of this season. Furthermore, his player card doesn't indicate he is a bad defensive player (though he doesn't play tough minutes either).
Now, you might be thinking that Hanley is the problem and should be benched. Maybe this is true. However shots from the right side when he was on the ice last year wasn't an issue. The team actually gave up relatively fewer shots from the right side (shooter perspective) when Hanley was on the ice.

October 23, 2025 at 3:05 PM
Now, you might be thinking that Hanley is the problem and should be benched. Maybe this is true. However shots from the right side when he was on the ice last year wasn't an issue. The team actually gave up relatively fewer shots from the right side (shooter perspective) when Hanley was on the ice.
Now lets look at the same chart for Hanley. When Hanley is on the ice CGY is giving more than their average number of shots from the right side.

October 23, 2025 at 3:05 PM
Now lets look at the same chart for Hanley. When Hanley is on the ice CGY is giving more than their average number of shots from the right side.
This chart shows where the shots against are coming from when Bahl is on the ice compared to the team average. When Bahl is on the ice more shots (than the CGY average) come from the left side and fewer from the right side. Teams seem less effective at generating shots from the right side vs Bahl.

October 23, 2025 at 3:05 PM
This chart shows where the shots against are coming from when Bahl is on the ice compared to the team average. When Bahl is on the ice more shots (than the CGY average) come from the left side and fewer from the right side. Teams seem less effective at generating shots from the right side vs Bahl.
The defensive side of the game is interesting too. Here are their shots against (as a percentage of all shots against) by location relative to league average. A high % of shots against are inside shots but most telling is they are coming from the right side of the ice (shooter perspective).

October 23, 2025 at 3:05 PM
The defensive side of the game is interesting too. Here are their shots against (as a percentage of all shots against) by location relative to league average. A high % of shots against are inside shots but most telling is they are coming from the right side of the ice (shooter perspective).