


Eli Holder
@elibryan.bsky.social
Raleigh. How might we visualize people, fairly and equitably? Data / dataviz / design / psychology / research geek. He / him. Chaotic good. Follows Fizzlethorpe Bristlebane. Design / research / writing at https://3iap.com.
Reposted by Eli Holder

Turn off your phone’s “advertising ID” to make it harder for location data brokers to track you. (2/4)


October 2, 2025 at 11:13 PM
Turn off your phone’s “advertising ID” to make it harder for location data brokers to track you. (2/4)
Reposted by Eli Holder

Last year I wrote about the NCGOP leaderships multi-decade obsession with erasing LGBT people from UNC’s campus life for @triangleblogblog.bsky.social. Might need to update soon unfortunately. triangleblogblog.com/2024/05/05/t...

The long and eventful history of Tim Moore and Peter Hans’ animosity towards marginalized people - Triangle Blog Blog
A group civics blog covering town council, education, transportation, and recreation in Chapel Hill and Carrboro, NC.
triangleblogblog.com
September 18, 2025 at 1:45 PM
Last year I wrote about the NCGOP leaderships multi-decade obsession with erasing LGBT people from UNC’s campus life for @triangleblogblog.bsky.social. Might need to update soon unfortunately. triangleblogblog.com/2024/05/05/t...
Kinda like pufferfish sushi... good if you get it right, but one wrong slice and ☠️☠️☠️!!
September 15, 2025 at 1:58 PM
Kinda like pufferfish sushi... good if you get it right, but one wrong slice and ☠️☠️☠️!!
Appreciate this analysis! Is the trend related to any particular component of the deprivation index more than others? Not sure from this dataset if that's an easy thing to break out, but I'd be curious how this tracks with housing?
September 9, 2025 at 2:27 PM
Appreciate this analysis! Is the trend related to any particular component of the deprivation index more than others? Not sure from this dataset if that's an easy thing to break out, but I'd be curious how this tracks with housing?
Reposted by Eli Holder

Rosling’s insistance on looking beyond averages to see the world as it really is reminds me of the work of @elibryan.bsky.social and Cindy Xiong. 📊
nightingaledvs.com/unfair-compa...
nightingaledvs.com/unfair-compa...

September 1, 2025 at 11:40 AM
Rosling’s insistance on looking beyond averages to see the world as it really is reminds me of the work of @elibryan.bsky.social and Cindy Xiong. 📊
nightingaledvs.com/unfair-compa...
nightingaledvs.com/unfair-compa...
Go for broke! Log scaling!
September 4, 2025 at 6:51 PM
Go for broke! Log scaling!
Thanks for sharing RJ!
August 25, 2025 at 3:00 PM
Thanks for sharing RJ!
Appreciate it! This specific talk wasn't recorded, but...
My last public talk for "R Ladies" covered similar material: 3iap.com/rladies2025/
I'm also generally available for team workshops, if that's helpful: 3iap.com/workshops/eq...
The SIGGRAPH abstract has notes: doi.org/10.1145/3721...
My last public talk for "R Ladies" covered similar material: 3iap.com/rladies2025/
I'm also generally available for team workshops, if that's helpful: 3iap.com/workshops/eq...
The SIGGRAPH abstract has notes: doi.org/10.1145/3721...

R Ladies Rome Talk: Deathly Dataviz
Deathly Dataviz: How Public Health Dashboards Can Backfire, and What We Can Do Instead. A presentation for R Ladies Rome.
3iap.com
August 25, 2025 at 2:59 PM
Appreciate it! This specific talk wasn't recorded, but...
My last public talk for "R Ladies" covered similar material: 3iap.com/rladies2025/
I'm also generally available for team workshops, if that's helpful: 3iap.com/workshops/eq...
The SIGGRAPH abstract has notes: doi.org/10.1145/3721...
My last public talk for "R Ladies" covered similar material: 3iap.com/rladies2025/
I'm also generally available for team workshops, if that's helpful: 3iap.com/workshops/eq...
The SIGGRAPH abstract has notes: doi.org/10.1145/3721...
What can we do here?
@elijfinkel.bsky.social speed dating work suggests a much less bleak dating world, vs Tinder's 80/20 dynamic: doi.org/10.70400/NEL...
@jamieamemiya.bsky.social & co suggest counterfactuals to blame systems, not people: doi.org/10.1177/1745...
Which maybe looks like this...
@elijfinkel.bsky.social speed dating work suggests a much less bleak dating world, vs Tinder's 80/20 dynamic: doi.org/10.70400/NEL...
@jamieamemiya.bsky.social & co suggest counterfactuals to blame systems, not people: doi.org/10.1177/1745...
Which maybe looks like this...


August 24, 2025 at 6:29 PM
What can we do here?
@elijfinkel.bsky.social speed dating work suggests a much less bleak dating world, vs Tinder's 80/20 dynamic: doi.org/10.70400/NEL...
@jamieamemiya.bsky.social & co suggest counterfactuals to blame systems, not people: doi.org/10.1177/1745...
Which maybe looks like this...
@elijfinkel.bsky.social speed dating work suggests a much less bleak dating world, vs Tinder's 80/20 dynamic: doi.org/10.70400/NEL...
@jamieamemiya.bsky.social & co suggest counterfactuals to blame systems, not people: doi.org/10.1177/1745...
Which maybe looks like this...
Genetic determinism also shows up in incel belief systems, tangled up with some wild takes on online dating statistics... (e.g. women's suspected urge to "trade up" beyond their "looksmatch").
Preston & co: doi.org/10.1177/1097...
Vallerga & Zurbriggen: doi.org/10.1111/asap...
Preston & co: doi.org/10.1177/1097...
Vallerga & Zurbriggen: doi.org/10.1111/asap...


August 24, 2025 at 6:29 PM
Genetic determinism also shows up in incel belief systems, tangled up with some wild takes on online dating statistics... (e.g. women's suspected urge to "trade up" beyond their "looksmatch").
Preston & co: doi.org/10.1177/1097...
Vallerga & Zurbriggen: doi.org/10.1111/asap...
Preston & co: doi.org/10.1177/1097...
Vallerga & Zurbriggen: doi.org/10.1111/asap...
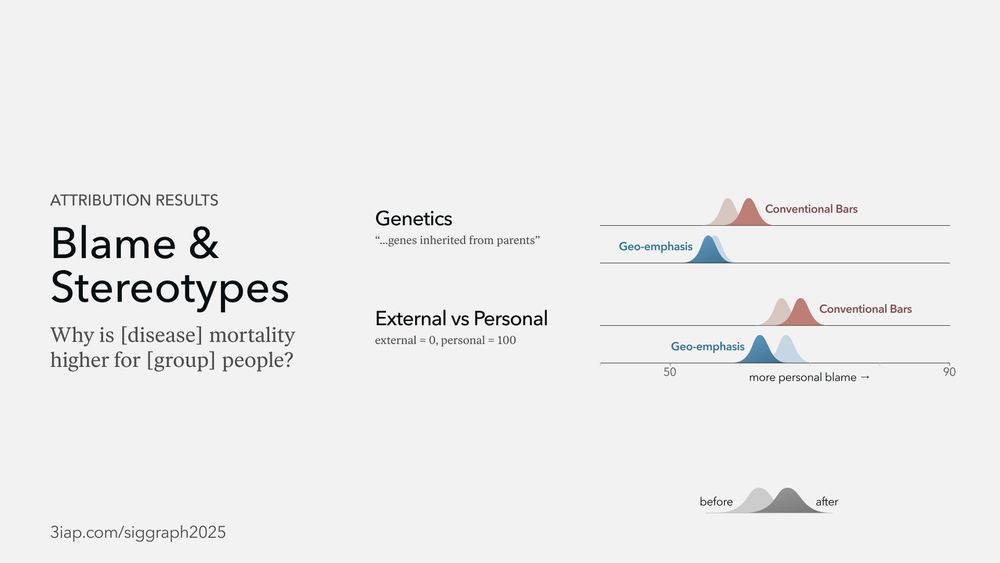
What can we do (for the charts)? Part of the misattributions stem from design choices.
❌ Bar charts increased genetic and personal blame for health disparities.
✅ These "geo-emphasized" jitter plots shifted blame toward systemic explanations.
Links + videos from our last paper: 3iap.com/mbat/
❌ Bar charts increased genetic and personal blame for health disparities.
✅ These "geo-emphasized" jitter plots shifted blame toward systemic explanations.
Links + videos from our last paper: 3iap.com/mbat/


August 22, 2025 at 4:30 PM
What can we do (for the charts)? Part of the misattributions stem from design choices.
❌ Bar charts increased genetic and personal blame for health disparities.
✅ These "geo-emphasized" jitter plots shifted blame toward systemic explanations.
Links + videos from our last paper: 3iap.com/mbat/
❌ Bar charts increased genetic and personal blame for health disparities.
✅ These "geo-emphasized" jitter plots shifted blame toward systemic explanations.
Links + videos from our last paper: 3iap.com/mbat/
Similar stories here:
Good outcomes = good genes
→ "Do Black people really need vaccines or anesthesia?"
Bad outcomes = bad genes
→ "There's nothing we can do to help!"
These charts are obviously well-intended, but ours + other studies find that viewers often misattribute these disparities.
Good outcomes = good genes
→ "Do Black people really need vaccines or anesthesia?"
Bad outcomes = bad genes
→ "There's nothing we can do to help!"
These charts are obviously well-intended, but ours + other studies find that viewers often misattribute these disparities.


August 22, 2025 at 4:30 PM
Similar stories here:
Good outcomes = good genes
→ "Do Black people really need vaccines or anesthesia?"
Bad outcomes = bad genes
→ "There's nothing we can do to help!"
These charts are obviously well-intended, but ours + other studies find that viewers often misattribute these disparities.
Good outcomes = good genes
→ "Do Black people really need vaccines or anesthesia?"
Bad outcomes = bad genes
→ "There's nothing we can do to help!"
These charts are obviously well-intended, but ours + other studies find that viewers often misattribute these disparities.
Similar story here:
Good outcomes = good behavior (us)
→ Bad outcomes = bad behavior (others)
→ "Should we spend so much $$$ vaccinating people who don't deserve it?"
Good outcomes = good behavior (us)
→ Bad outcomes = bad behavior (others)
→ "Should we spend so much $$$ vaccinating people who don't deserve it?"


August 22, 2025 at 4:30 PM
Similar story here:
Good outcomes = good behavior (us)
→ Bad outcomes = bad behavior (others)
→ "Should we spend so much $$$ vaccinating people who don't deserve it?"
Good outcomes = good behavior (us)
→ Bad outcomes = bad behavior (others)
→ "Should we spend so much $$$ vaccinating people who don't deserve it?"