


David Munro
@dmunro.bsky.social
Academic Economist, Middlebury College
And the Insured Unemployment Rate ticked up slightly to 1.26%. Overall unemployment picture during the shutdown points towards a gradually weakening labor market. Hopefully signing off! 🫡 @josephpolitano.bsky.social @estruby.bsky.social

November 14, 2025 at 3:34 PM
And the Insured Unemployment Rate ticked up slightly to 1.26%. Overall unemployment picture during the shutdown points towards a gradually weakening labor market. Hopefully signing off! 🫡 @josephpolitano.bsky.social @estruby.bsky.social
Initial Claims (week ending Nov. 8th) up 12k or 5.6% (SA) and up 22k or 10% (NSA).

November 14, 2025 at 3:34 PM
Initial Claims (week ending Nov. 8th) up 12k or 5.6% (SA) and up 22k or 10% (NSA).
Since we don't yet have new official claims data, my last (?) rogue report (I missed last week!), for week ending Nov. 1st. CC increased 20k (SA) or 7k (NSA) last week.

November 14, 2025 at 3:34 PM
Since we don't yet have new official claims data, my last (?) rogue report (I missed last week!), for week ending Nov. 1st. CC increased 20k (SA) or 7k (NSA) last week.
And the Insured Unemployment Rate ticked up slightly: 1.24 to 1.26% over the week. @josephpolitano.bsky.social

October 31, 2025 at 1:11 PM
And the Insured Unemployment Rate ticked up slightly: 1.24 to 1.26% over the week. @josephpolitano.bsky.social
Initial claims down slightly: 3k or 1.4% (NSA), 3k or 1.6% (SA). Thus, the rise in insured unemployment likely driven from lower job finding (people hanging out in the claims pool longer) not new layoffs.

October 31, 2025 at 1:11 PM
Initial claims down slightly: 3k or 1.4% (NSA), 3k or 1.6% (SA). Thus, the rise in insured unemployment likely driven from lower job finding (people hanging out in the claims pool longer) not new layoffs.
Week #5 Rogue Unemployment Report, Halloween Edition 🎃 (hoping we won't have a Christmas Edition...). Data up to week ending Oct. 18th. Insured Unemployment ticked up slightly: +34k or 2.2% (NSA), +28k or 1.5% (SA)

October 31, 2025 at 1:11 PM
Week #5 Rogue Unemployment Report, Halloween Edition 🎃 (hoping we won't have a Christmas Edition...). Data up to week ending Oct. 18th. Insured Unemployment ticked up slightly: +34k or 2.2% (NSA), +28k or 1.5% (SA)
New this week, Insured Unemployment Rate (CC/cov. emp.) (worth noting cov. emp. is, by construction, a pretty lagging measure of employment). Stayed relatively constant week-to-week (around ~1.25%), but has been trending upwards over the past year. @josephpolitano.bsky.social @mchinn.bsky.social

October 24, 2025 at 3:15 PM
New this week, Insured Unemployment Rate (CC/cov. emp.) (worth noting cov. emp. is, by construction, a pretty lagging measure of employment). Stayed relatively constant week-to-week (around ~1.25%), but has been trending upwards over the past year. @josephpolitano.bsky.social @mchinn.bsky.social
Initial Claims also pretty steady: -5k or -2.7% (NSA). -8.5k or -4% (SA).

October 24, 2025 at 3:15 PM
Initial Claims also pretty steady: -5k or -2.7% (NSA). -8.5k or -4% (SA).
Week #4 Rogue Unemployment Report (compiled from state data). Insured Unemployment relatively steady (+18k or 1.2% (NSA). -6k or -0.3% (SA). (excl. CO, MA, TN, not reported yet)

October 24, 2025 at 3:15 PM
Week #4 Rogue Unemployment Report (compiled from state data). Insured Unemployment relatively steady (+18k or 1.2% (NSA). -6k or -0.3% (SA). (excl. CO, MA, TN, not reported yet)
Initial claims (again, excl. AZ, MA, NV, TN), ticked up: increased 12.5K (SA), or about 6% increase, but nothing too crazy.
@josephpolitano.bsky.social we're not totally in the dark about the US labor market!
@josephpolitano.bsky.social we're not totally in the dark about the US labor market!

October 17, 2025 at 1:13 PM
Initial claims (again, excl. AZ, MA, NV, TN), ticked up: increased 12.5K (SA), or about 6% increase, but nothing too crazy.
@josephpolitano.bsky.social we're not totally in the dark about the US labor market!
@josephpolitano.bsky.social we're not totally in the dark about the US labor market!
Week #3 Rogue Unemployment Report: Insured unemployment (Continued Claims) (excl. AZ, MA, NV, TN: not reported yet) declined by 8k (SA), so pretty steady.

October 17, 2025 at 1:10 PM
Week #3 Rogue Unemployment Report: Insured unemployment (Continued Claims) (excl. AZ, MA, NV, TN: not reported yet) declined by 8k (SA), so pretty steady.
And here's the same for initial claims. Again, relatively steady.

October 10, 2025 at 1:58 PM
And here's the same for initial claims. Again, relatively steady.
My second rogue jobs report (compiled from state claims). Here's insured unemployment (excl. HI and MA (no release yet)) and NSA and SA (weekly SA is giving me a bit of a headache, but anyway). Not much change.

October 10, 2025 at 1:56 PM
My second rogue jobs report (compiled from state claims). Here's insured unemployment (excl. HI and MA (no release yet)) and NSA and SA (weekly SA is giving me a bit of a headache, but anyway). Not much change.
I'm going rogue! Looks like state-level claims data is still being updated on FRED (7 hrs ago). I think this is because it's produced by states, and not the ETA. All states have new data, except AZ and MA. Below is the updated (NSA) insured unemployment series aggregated (minus AZ and MA).

October 3, 2025 at 8:41 PM
I'm going rogue! Looks like state-level claims data is still being updated on FRED (7 hrs ago). I think this is because it's produced by states, and not the ETA. All states have new data, except AZ and MA. Below is the updated (NSA) insured unemployment series aggregated (minus AZ and MA).
@stlouisfed.bsky.social Modest suggestion for FRED: can you add a sort by "time series length" option? When teaching I often like to show long time series. When I sort by "observation start" I often have to wade through pages of time series that start early but end in, e.g., 1948.

September 24, 2025 at 1:26 PM
@stlouisfed.bsky.social Modest suggestion for FRED: can you add a sort by "time series length" option? When teaching I often like to show long time series. When I sort by "observation start" I often have to wade through pages of time series that start early but end in, e.g., 1948.
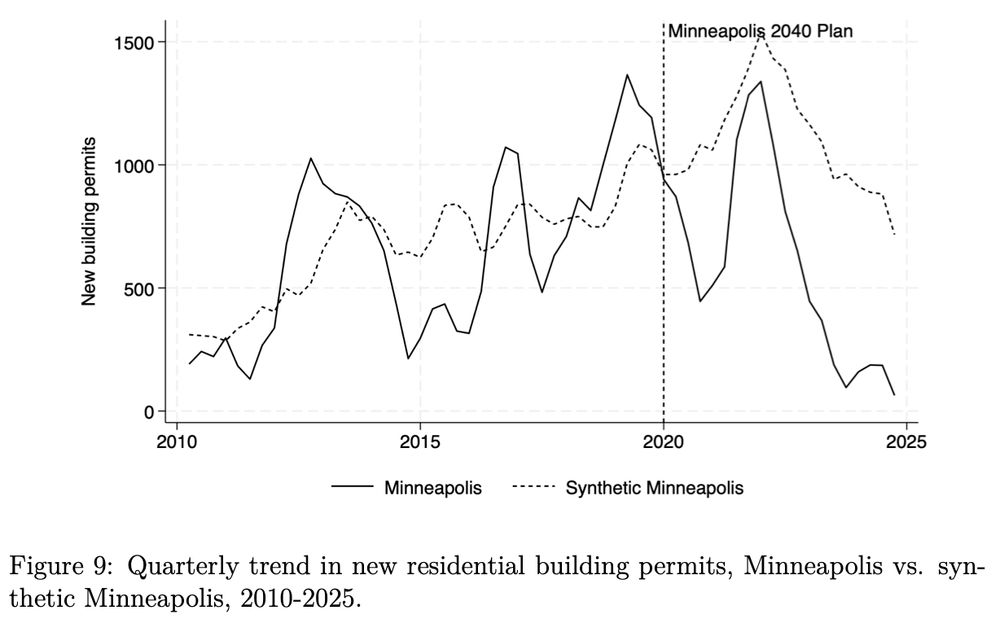
We don't find evidence of an increase in housing supply (building permits). If anything, the data suggests a relative decline in building permits. (Possible cause was legal dispute on 2040 plan in 2023/24). Regardless, housing prices declined without a noticeable supply increase.
July 29, 2025 at 7:11 PM
We don't find evidence of an increase in housing supply (building permits). If anything, the data suggests a relative decline in building permits. (Possible cause was legal dispute on 2040 plan in 2023/24). Regardless, housing prices declined without a noticeable supply increase.
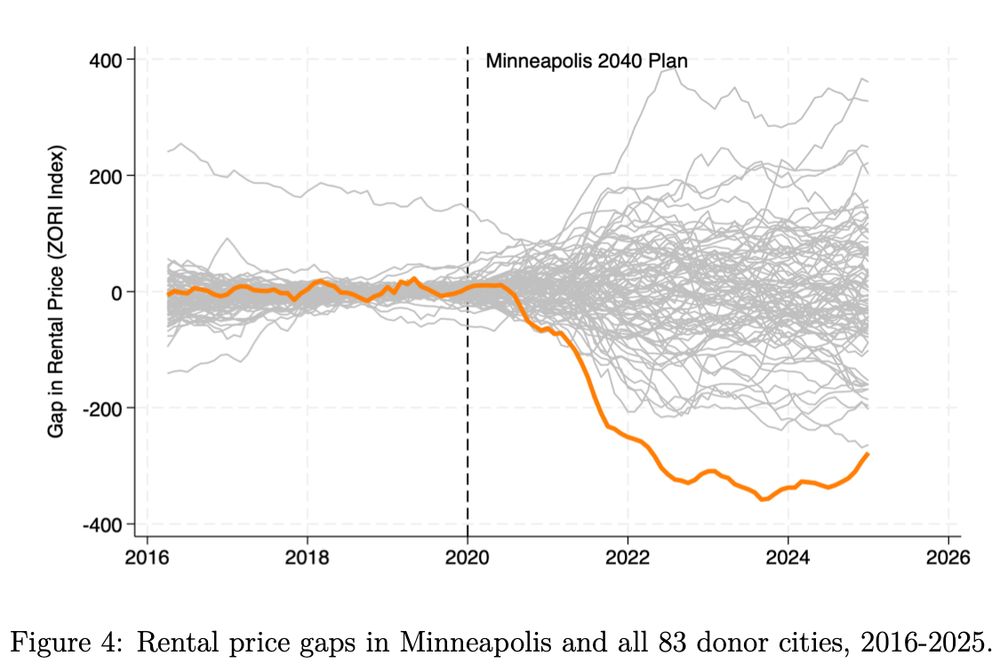
The effects for Minneapolis are quite significant. Here's the placebo test for rental prices (similar for home prices):
July 29, 2025 at 7:11 PM
The effects for Minneapolis are quite significant. Here's the placebo test for rental prices (similar for home prices):
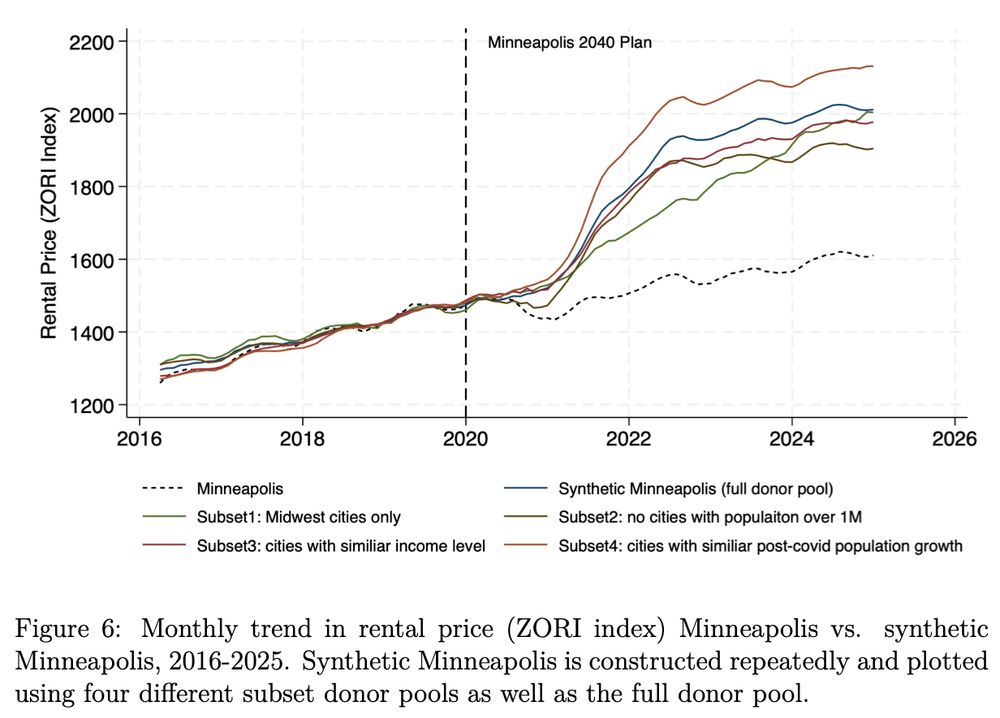
The results from the synthetic control are robust to different criteria for cities in the donor pool: Midwest cities only, <1 million population, similar income levels, similar post covid population growth:
July 29, 2025 at 7:11 PM
The results from the synthetic control are robust to different criteria for cities in the donor pool: Midwest cities only, <1 million population, similar income levels, similar post covid population growth:
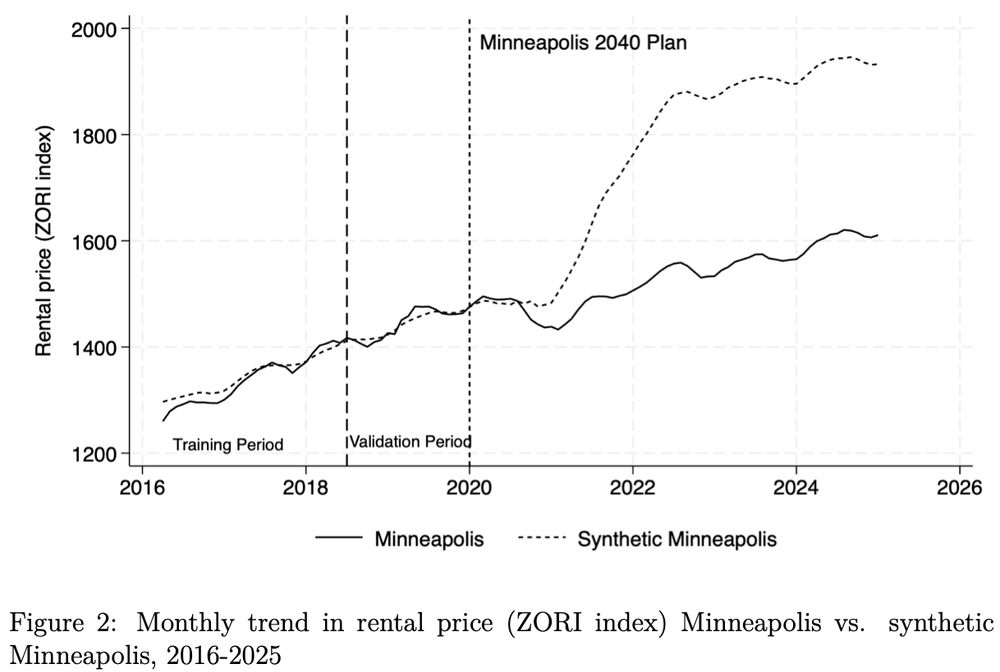
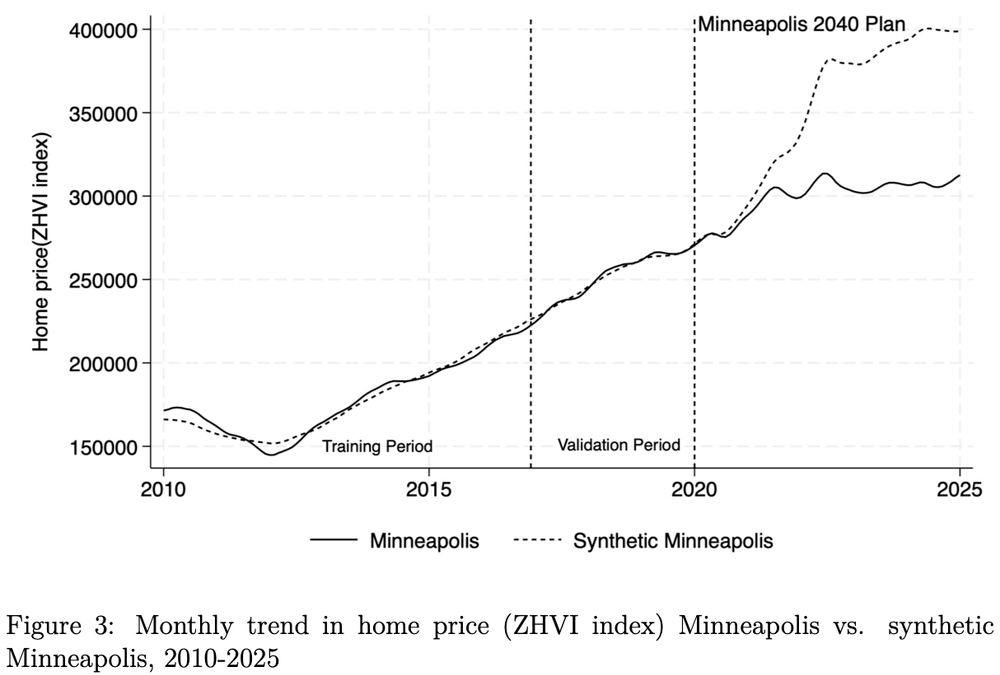
🚨 Excited to share a new working paper with an exceptional former student of mine, Helena Gu. The paper looks at the impact of one of the largest zoning reforms in US history: the Minneapolis 2040 plan. We find significant impacts on home prices:
(1/N)
ideas.repec.org/p/zbw/glodps...
(1/N)
ideas.repec.org/p/zbw/glodps...
July 29, 2025 at 7:11 PM
🚨 Excited to share a new working paper with an exceptional former student of mine, Helena Gu. The paper looks at the impact of one of the largest zoning reforms in US history: the Minneapolis 2040 plan. We find significant impacts on home prices:
(1/N)
ideas.repec.org/p/zbw/glodps...
(1/N)
ideas.repec.org/p/zbw/glodps...
For all the admins hand-wringing about trade deficits, they are currently blowing a hole in one of the US's largest export categories: Tourism (~10% of total exports, ~25% of service exports). Of course, it's not really about trade deficits, but anyway...

April 16, 2025 at 1:06 PM
For all the admins hand-wringing about trade deficits, they are currently blowing a hole in one of the US's largest export categories: Tourism (~10% of total exports, ~25% of service exports). Of course, it's not really about trade deficits, but anyway...
We plot average inflation computed using different trailing windows, from 1 to 6 years. The 1 and 2 year windows exceed 2% before Q4 2021, suggesting they are too short. All of the 3-5 year windows cross 2% in Q4, while the 6 year window crosses after. Suggesting an implicit window of 3-5 years. 4/

February 18, 2025 at 3:09 PM
We plot average inflation computed using different trailing windows, from 1 to 6 years. The 1 and 2 year windows exceed 2% before Q4 2021, suggesting they are too short. All of the 3-5 year windows cross 2% in Q4, while the 6 year window crosses after. Suggesting an implicit window of 3-5 years. 4/
In the paper we document an abrupt abandonment in AIT framing of the Fed's inflation objectives in Q4 2021 across various mediums of Fed communication. 3/

February 18, 2025 at 3:09 PM
In the paper we document an abrupt abandonment in AIT framing of the Fed's inflation objectives in Q4 2021 across various mediums of Fed communication. 3/
A proper winter day in VT!

February 17, 2025 at 6:28 PM
A proper winter day in VT!
Yes, important to be clear, but I don't see overwhelming evidence of that argument in the data. I think the growth rates, and including the pandemic recovery, biases his numbers. It's hard to argue that real wages in 2012-2020 were higher than they are now. We can argue about sub-groups, but still.

November 12, 2024 at 7:06 PM
Yes, important to be clear, but I don't see overwhelming evidence of that argument in the data. I think the growth rates, and including the pandemic recovery, biases his numbers. It's hard to argue that real wages in 2012-2020 were higher than they are now. We can argue about sub-groups, but still.