


Dave Osmond
@davidosmond.bsky.social
Weekly renewable simulation of Australia's NEM
Keen on renewables, efficiency, EVs, bikes, the outdoors, running & cycling
Keen on renewables, efficiency, EVs, bikes, the outdoors, running & cycling
The following article contains many more details, assumptions & FAQs about my simulation, including what is ‘Other’, estimates of cost ($107/MWh), emissions, required capacity, scale factors, analysis of the most challenging days & much more (end)
reneweconomy.com.au/a-near-100-p...
reneweconomy.com.au/a-near-100-p...
reneweconomy.com.au
November 12, 2025 at 3:30 AM
The following article contains many more details, assumptions & FAQs about my simulation, including what is ‘Other’, estimates of cost ($107/MWh), emissions, required capacity, scale factors, analysis of the most challenging days & much more (end)
reneweconomy.com.au/a-near-100-p...
reneweconomy.com.au/a-near-100-p...
The simulation has used wind, rooftop & utility solar data from
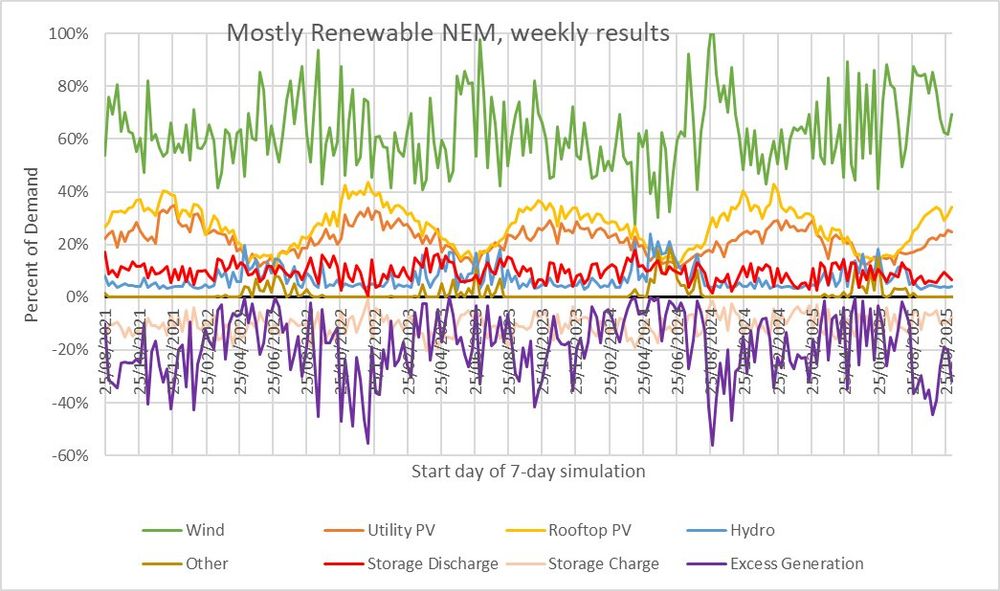
OpenNEM, rescaled to supply ~60%, 25% & 20% respectively over the year. It uses the storage & existing hydro to match demand. If there remains a shortfall then the model supplements generation with ‘Other’ (4/5)
OpenNEM, rescaled to supply ~60%, 25% & 20% respectively over the year. It uses the storage & existing hydro to match demand. If there remains a shortfall then the model supplements generation with ‘Other’ (4/5)


November 12, 2025 at 3:30 AM
The simulation has used wind, rooftop & utility solar data from
OpenNEM, rescaled to supply ~60%, 25% & 20% respectively over the year. It uses the storage & existing hydro to match demand. If there remains a shortfall then the model supplements generation with ‘Other’ (4/5)
OpenNEM, rescaled to supply ~60%, 25% & 20% respectively over the year. It uses the storage & existing hydro to match demand. If there remains a shortfall then the model supplements generation with ‘Other’ (4/5)
Here is the simulation from weeks 217 to 220. It was 100% renewable (3/5)

November 12, 2025 at 3:29 AM
Here is the simulation from weeks 217 to 220. It was 100% renewable (3/5)
Last week had:
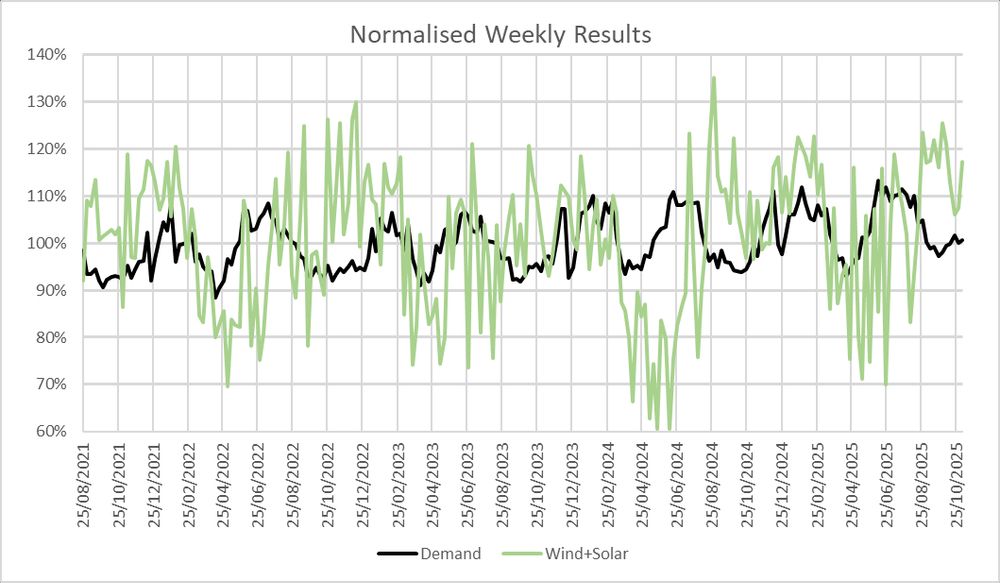
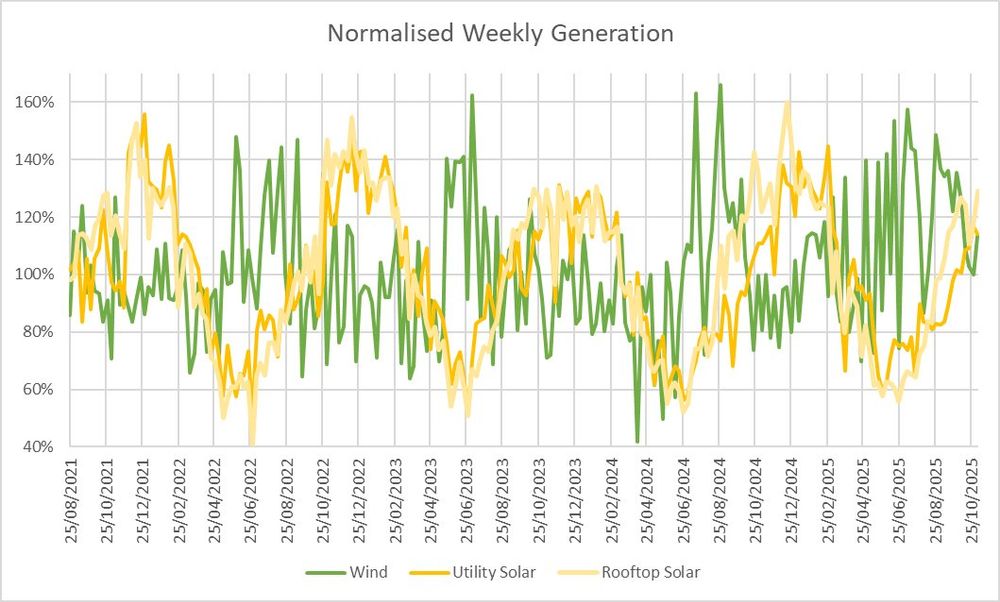
- average demand (101% of long-term average)
- above average wind (113%)
- well above average solar (122%) (2/5)
- average demand (101% of long-term average)
- above average wind (113%)
- well above average solar (122%) (2/5)
November 12, 2025 at 3:28 AM
Last week had:
- average demand (101% of long-term average)
- above average wind (113%)
- well above average solar (122%) (2/5)
- average demand (101% of long-term average)
- above average wind (113%)
- well above average solar (122%) (2/5)
The following article contains many more details, assumptions & FAQs about my simulation, including what is ‘Other’, estimates of cost ($107/MWh), emissions, required capacity, scale factors, analysis of the most challenging days & much more (end)
reneweconomy.com.au/a-near-100-p...
reneweconomy.com.au/a-near-100-p...
reneweconomy.com.au
November 5, 2025 at 10:08 PM
The following article contains many more details, assumptions & FAQs about my simulation, including what is ‘Other’, estimates of cost ($107/MWh), emissions, required capacity, scale factors, analysis of the most challenging days & much more (end)
reneweconomy.com.au/a-near-100-p...
reneweconomy.com.au/a-near-100-p...
The simulation has used wind, rooftop & utility solar data from
@OpenNEM
, rescaled to supply ~60%, 25% & 20% respectively over the year. It uses the storage & existing hydro to match demand. If there remains a shortfall then the model supplements generation with ‘Other’ (4/5)
@OpenNEM
, rescaled to supply ~60%, 25% & 20% respectively over the year. It uses the storage & existing hydro to match demand. If there remains a shortfall then the model supplements generation with ‘Other’ (4/5)


November 5, 2025 at 10:07 PM
The simulation has used wind, rooftop & utility solar data from
@OpenNEM
, rescaled to supply ~60%, 25% & 20% respectively over the year. It uses the storage & existing hydro to match demand. If there remains a shortfall then the model supplements generation with ‘Other’ (4/5)
@OpenNEM
, rescaled to supply ~60%, 25% & 20% respectively over the year. It uses the storage & existing hydro to match demand. If there remains a shortfall then the model supplements generation with ‘Other’ (4/5)
Here is the simulation from weeks 216 to 219. It was 100% renewable (3/5)

November 5, 2025 at 10:07 PM
Here is the simulation from weeks 216 to 219. It was 100% renewable (3/5)
Last week had:
- average demand (100% of long-term average)
- average wind (100%)
- well above average solar (117%) (2/5)
- average demand (100% of long-term average)
- average wind (100%)
- well above average solar (117%) (2/5)


November 5, 2025 at 10:06 PM
Last week had:
- average demand (100% of long-term average)
- average wind (100%)
- well above average solar (117%) (2/5)
- average demand (100% of long-term average)
- average wind (100%)
- well above average solar (117%) (2/5)
You can download 30-minute data in 3 month chunks here:
www.v-nem.org
www.v-nem.org
V-NEM | VEPC
www.v-nem.org
November 4, 2025 at 8:55 PM
You can download 30-minute data in 3 month chunks here:
www.v-nem.org
www.v-nem.org
not great reductions in SA in the last couple of years. 191kgCO2/MWh is the latest, down from 198kg a year ago and 199kg two years ago.
But we're starting to see improvements again as new wind farms come online & ramp up and also as batteries start to displace gas.
But we're starting to see improvements again as new wind farms come online & ramp up and also as batteries start to displace gas.
November 4, 2025 at 1:45 AM
not great reductions in SA in the last couple of years. 191kgCO2/MWh is the latest, down from 198kg a year ago and 199kg two years ago.
But we're starting to see improvements again as new wind farms come online & ramp up and also as batteries start to displace gas.
But we're starting to see improvements again as new wind farms come online & ramp up and also as batteries start to displace gas.
The following article contains many more details, assumptions & FAQs about my simulation, including what is ‘Other’, estimates of cost ($107/MWh), emissions, required capacity, scale factors, analysis of the most challenging days & much more (end)
reneweconomy.com.au/a-near-100-p...
reneweconomy.com.au/a-near-100-p...
reneweconomy.com.au
October 29, 2025 at 2:33 AM
The following article contains many more details, assumptions & FAQs about my simulation, including what is ‘Other’, estimates of cost ($107/MWh), emissions, required capacity, scale factors, analysis of the most challenging days & much more (end)
reneweconomy.com.au/a-near-100-p...
reneweconomy.com.au/a-near-100-p...
The simulation has used wind, rooftop & utility solar data from
OpenNEM, rescaled to supply ~60%, 25% & 20% respectively over the year. It uses the storage & existing hydro to match demand. If there remains a shortfall then the model supplements generation with ‘Other’ (4/5)
OpenNEM, rescaled to supply ~60%, 25% & 20% respectively over the year. It uses the storage & existing hydro to match demand. If there remains a shortfall then the model supplements generation with ‘Other’ (4/5)


October 29, 2025 at 2:33 AM
The simulation has used wind, rooftop & utility solar data from
OpenNEM, rescaled to supply ~60%, 25% & 20% respectively over the year. It uses the storage & existing hydro to match demand. If there remains a shortfall then the model supplements generation with ‘Other’ (4/5)
OpenNEM, rescaled to supply ~60%, 25% & 20% respectively over the year. It uses the storage & existing hydro to match demand. If there remains a shortfall then the model supplements generation with ‘Other’ (4/5)
Here is the simulation from weeks 215 to 218. It was 100% renewable (3/5)

October 29, 2025 at 2:32 AM
Here is the simulation from weeks 215 to 218. It was 100% renewable (3/5)
Last week had:
- average demand (102% of long-term average)
- average wind (103%)
- above average solar (110%) (2/5)
- average demand (102% of long-term average)
- average wind (103%)
- above average solar (110%) (2/5)


October 29, 2025 at 2:32 AM
Last week had:
- average demand (102% of long-term average)
- average wind (103%)
- above average solar (110%) (2/5)
- average demand (102% of long-term average)
- average wind (103%)
- above average solar (110%) (2/5)
The following article contains many more details, assumptions & FAQs about my simulation, including what is ‘Other’, estimates of cost ($107/MWh), emissions, required capacity, scale factors, analysis of the most challenging days & much more (end)
reneweconomy.com.au/a-near-100-p...
reneweconomy.com.au/a-near-100-p...
reneweconomy.com.au
October 22, 2025 at 2:59 AM
The following article contains many more details, assumptions & FAQs about my simulation, including what is ‘Other’, estimates of cost ($107/MWh), emissions, required capacity, scale factors, analysis of the most challenging days & much more (end)
reneweconomy.com.au/a-near-100-p...
reneweconomy.com.au/a-near-100-p...
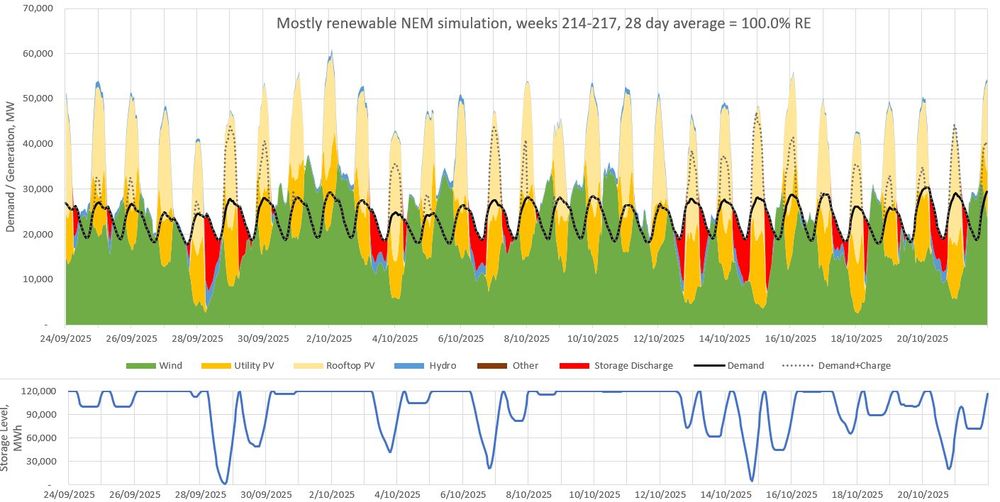
The simulation has used wind, rooftop & utility solar data from
OpenNEM, rescaled to supply ~60%, 25% & 20% respectively over the year. It uses the storage & existing hydro to match demand. If there remains a shortfall then the model supplements generation with ‘Other’ (4/5)
OpenNEM, rescaled to supply ~60%, 25% & 20% respectively over the year. It uses the storage & existing hydro to match demand. If there remains a shortfall then the model supplements generation with ‘Other’ (4/5)


October 22, 2025 at 2:59 AM
The simulation has used wind, rooftop & utility solar data from
OpenNEM, rescaled to supply ~60%, 25% & 20% respectively over the year. It uses the storage & existing hydro to match demand. If there remains a shortfall then the model supplements generation with ‘Other’ (4/5)
OpenNEM, rescaled to supply ~60%, 25% & 20% respectively over the year. It uses the storage & existing hydro to match demand. If there remains a shortfall then the model supplements generation with ‘Other’ (4/5)
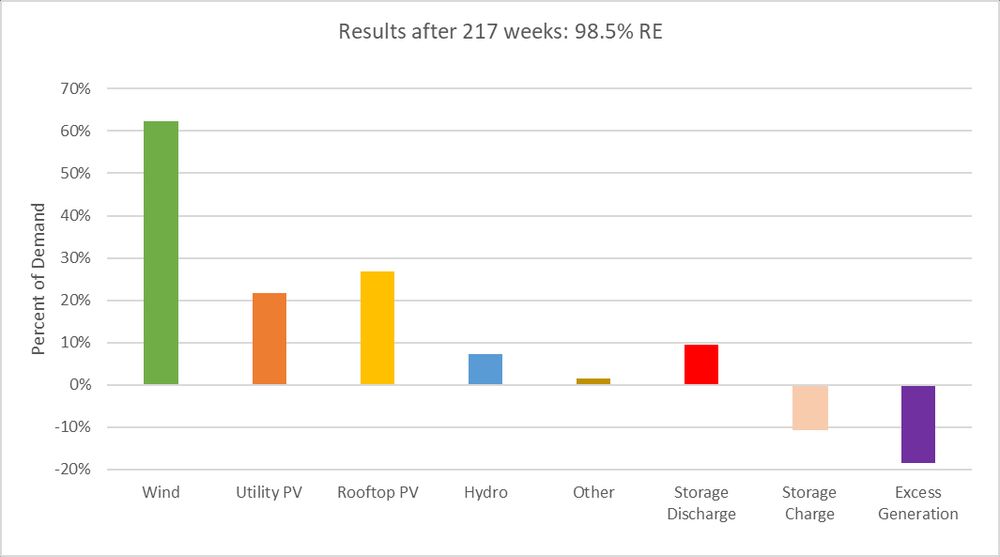
Here is the simulation from weeks 214 to 217. It was 100% renewable.
For earlier weeks, see the following thread (3/5)
For earlier weeks, see the following thread (3/5)
October 22, 2025 at 2:58 AM
Here is the simulation from weeks 214 to 217. It was 100% renewable.
For earlier weeks, see the following thread (3/5)
For earlier weeks, see the following thread (3/5)
Last week had:
- average demand (100% of long-term average)
- above average wind (110%)
- well above average solar (117%) (2/5)
- average demand (100% of long-term average)
- above average wind (110%)
- well above average solar (117%) (2/5)


October 22, 2025 at 2:58 AM
Last week had:
- average demand (100% of long-term average)
- above average wind (110%)
- well above average solar (117%) (2/5)
- average demand (100% of long-term average)
- above average wind (110%)
- well above average solar (117%) (2/5)