


Dave Osmond
@davidosmond.bsky.social
Weekly renewable simulation of Australia's NEM
Keen on renewables, efficiency, EVs, bikes, the outdoors, running & cycling
Keen on renewables, efficiency, EVs, bikes, the outdoors, running & cycling
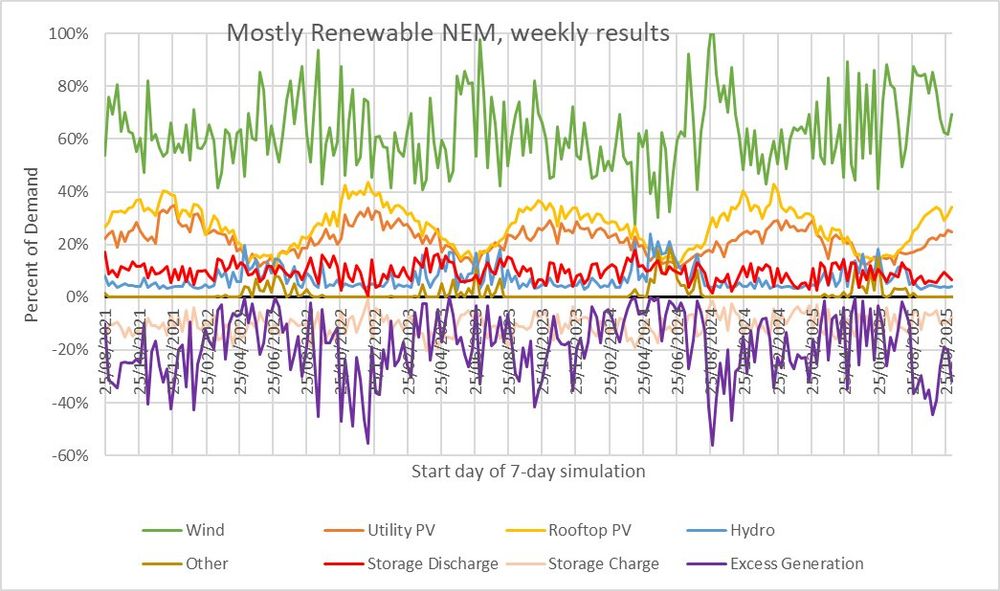
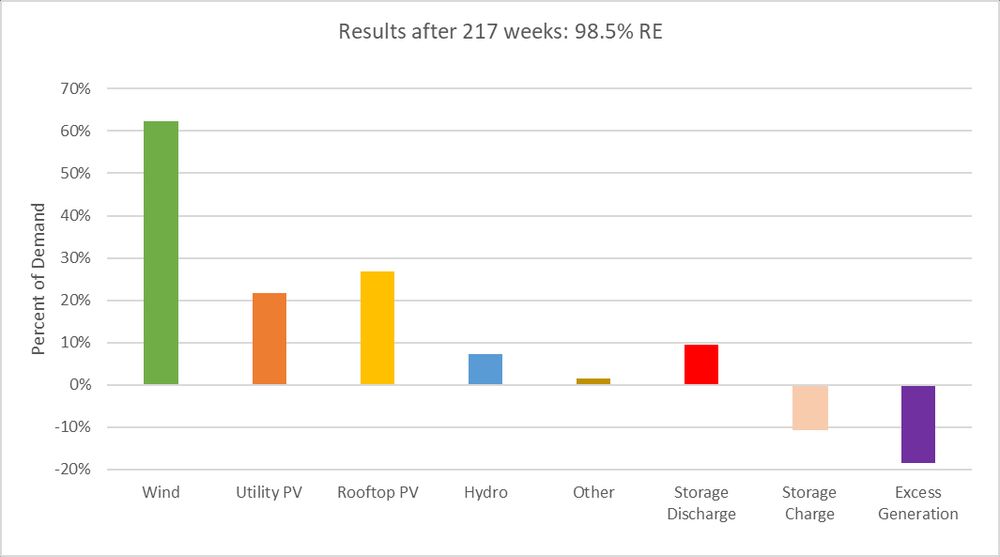
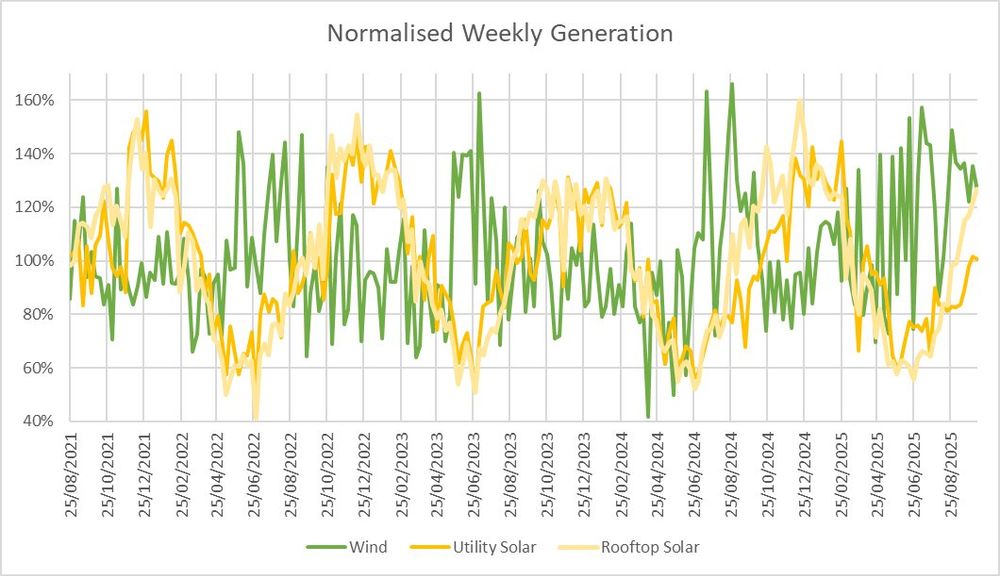
The simulation has used wind, rooftop & utility solar data from
OpenNEM, rescaled to supply ~60%, 25% & 20% respectively over the year. It uses the storage & existing hydro to match demand. If there remains a shortfall then the model supplements generation with ‘Other’ (4/5)
OpenNEM, rescaled to supply ~60%, 25% & 20% respectively over the year. It uses the storage & existing hydro to match demand. If there remains a shortfall then the model supplements generation with ‘Other’ (4/5)


November 12, 2025 at 3:30 AM
The simulation has used wind, rooftop & utility solar data from
OpenNEM, rescaled to supply ~60%, 25% & 20% respectively over the year. It uses the storage & existing hydro to match demand. If there remains a shortfall then the model supplements generation with ‘Other’ (4/5)
OpenNEM, rescaled to supply ~60%, 25% & 20% respectively over the year. It uses the storage & existing hydro to match demand. If there remains a shortfall then the model supplements generation with ‘Other’ (4/5)
Here is the simulation from weeks 217 to 220. It was 100% renewable (3/5)

November 12, 2025 at 3:29 AM
Here is the simulation from weeks 217 to 220. It was 100% renewable (3/5)
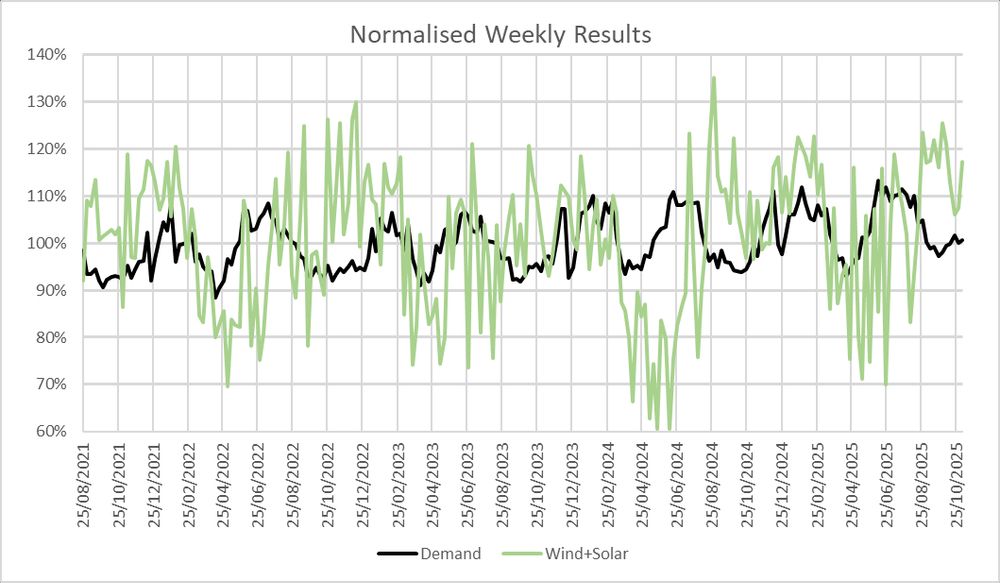
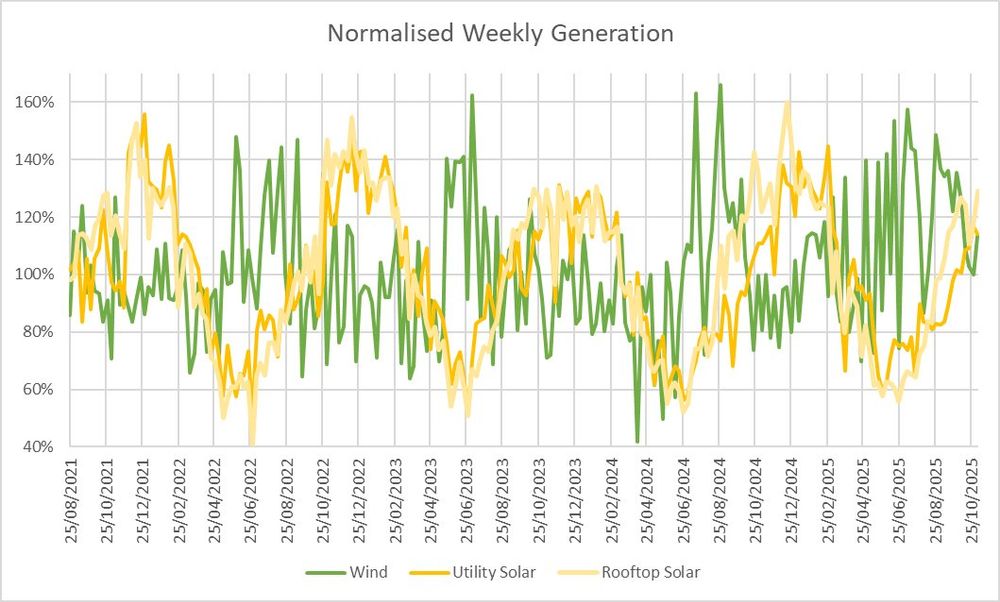
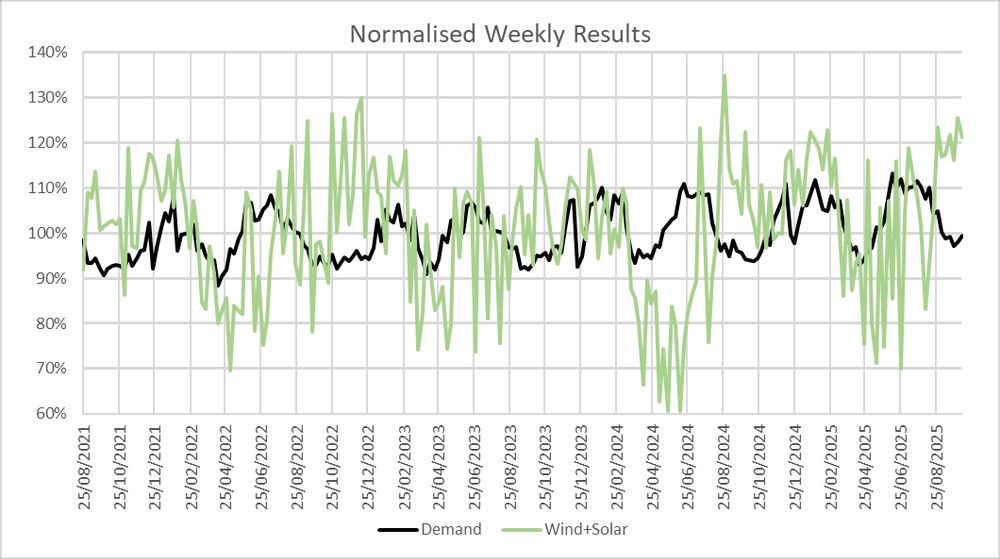
Last week had:
- average demand (101% of long-term average)
- above average wind (113%)
- well above average solar (122%) (2/5)
- average demand (101% of long-term average)
- above average wind (113%)
- well above average solar (122%) (2/5)
November 12, 2025 at 3:28 AM
Last week had:
- average demand (101% of long-term average)
- above average wind (113%)
- well above average solar (122%) (2/5)
- average demand (101% of long-term average)
- above average wind (113%)
- well above average solar (122%) (2/5)
Thread: Each week I run a simulation of Australia’s main electricity grid using rescaled generation data to show that it can get very close to 100% renewable electricity with 24GW/120GWh of storage (5 hrs at av demand)
Results:
Last week: 100% RE
Last 220 weeks: 98.6% RE (1/5)
Results:
Last week: 100% RE
Last 220 weeks: 98.6% RE (1/5)

November 12, 2025 at 3:28 AM
Thread: Each week I run a simulation of Australia’s main electricity grid using rescaled generation data to show that it can get very close to 100% renewable electricity with 24GW/120GWh of storage (5 hrs at av demand)
Results:
Last week: 100% RE
Last 220 weeks: 98.6% RE (1/5)
Results:
Last week: 100% RE
Last 220 weeks: 98.6% RE (1/5)
The simulation has used wind, rooftop & utility solar data from
@OpenNEM
, rescaled to supply ~60%, 25% & 20% respectively over the year. It uses the storage & existing hydro to match demand. If there remains a shortfall then the model supplements generation with ‘Other’ (4/5)
@OpenNEM
, rescaled to supply ~60%, 25% & 20% respectively over the year. It uses the storage & existing hydro to match demand. If there remains a shortfall then the model supplements generation with ‘Other’ (4/5)


November 5, 2025 at 10:07 PM
The simulation has used wind, rooftop & utility solar data from
@OpenNEM
, rescaled to supply ~60%, 25% & 20% respectively over the year. It uses the storage & existing hydro to match demand. If there remains a shortfall then the model supplements generation with ‘Other’ (4/5)
@OpenNEM
, rescaled to supply ~60%, 25% & 20% respectively over the year. It uses the storage & existing hydro to match demand. If there remains a shortfall then the model supplements generation with ‘Other’ (4/5)
Here is the simulation from weeks 216 to 219. It was 100% renewable (3/5)

November 5, 2025 at 10:07 PM
Here is the simulation from weeks 216 to 219. It was 100% renewable (3/5)
Last week had:
- average demand (100% of long-term average)
- average wind (100%)
- well above average solar (117%) (2/5)
- average demand (100% of long-term average)
- average wind (100%)
- well above average solar (117%) (2/5)


November 5, 2025 at 10:06 PM
Last week had:
- average demand (100% of long-term average)
- average wind (100%)
- well above average solar (117%) (2/5)
- average demand (100% of long-term average)
- average wind (100%)
- well above average solar (117%) (2/5)
Thread: Each week I run a simulation of Australia’s main electricity grid using rescaled generation data to show that it can get very close to 100% renewable electricity with 24GW/120GWh of storage (5 hrs at av demand)
Results:
Last week: 100.0% RE
Last 219 weeks: 98.6% RE (1/5)
Results:
Last week: 100.0% RE
Last 219 weeks: 98.6% RE (1/5)

November 5, 2025 at 10:05 PM
Thread: Each week I run a simulation of Australia’s main electricity grid using rescaled generation data to show that it can get very close to 100% renewable electricity with 24GW/120GWh of storage (5 hrs at av demand)
Results:
Last week: 100.0% RE
Last 219 weeks: 98.6% RE (1/5)
Results:
Last week: 100.0% RE
Last 219 weeks: 98.6% RE (1/5)
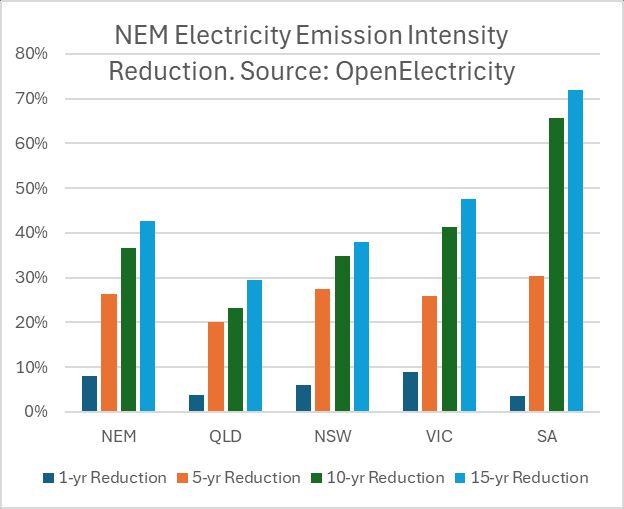
Australian Electricity Emission Intensity Update:
Average NEM emission intensity over last 12 months: 529 kg CO2-e/MWh
(down 26% in 5-yrs, down 37% in 10-yrs)
Sth Australia leading the way reductions thanks to its increase in wind & solar generation.
Down 30% in 5-yrs, 66% in 10-yrs)
Average NEM emission intensity over last 12 months: 529 kg CO2-e/MWh
(down 26% in 5-yrs, down 37% in 10-yrs)
Sth Australia leading the way reductions thanks to its increase in wind & solar generation.
Down 30% in 5-yrs, 66% in 10-yrs)

November 2, 2025 at 11:26 PM
Australian Electricity Emission Intensity Update:
Average NEM emission intensity over last 12 months: 529 kg CO2-e/MWh
(down 26% in 5-yrs, down 37% in 10-yrs)
Sth Australia leading the way reductions thanks to its increase in wind & solar generation.
Down 30% in 5-yrs, 66% in 10-yrs)
Average NEM emission intensity over last 12 months: 529 kg CO2-e/MWh
(down 26% in 5-yrs, down 37% in 10-yrs)
Sth Australia leading the way reductions thanks to its increase in wind & solar generation.
Down 30% in 5-yrs, 66% in 10-yrs)
The simulation has used wind, rooftop & utility solar data from
OpenNEM, rescaled to supply ~60%, 25% & 20% respectively over the year. It uses the storage & existing hydro to match demand. If there remains a shortfall then the model supplements generation with ‘Other’ (4/5)
OpenNEM, rescaled to supply ~60%, 25% & 20% respectively over the year. It uses the storage & existing hydro to match demand. If there remains a shortfall then the model supplements generation with ‘Other’ (4/5)


October 29, 2025 at 2:33 AM
The simulation has used wind, rooftop & utility solar data from
OpenNEM, rescaled to supply ~60%, 25% & 20% respectively over the year. It uses the storage & existing hydro to match demand. If there remains a shortfall then the model supplements generation with ‘Other’ (4/5)
OpenNEM, rescaled to supply ~60%, 25% & 20% respectively over the year. It uses the storage & existing hydro to match demand. If there remains a shortfall then the model supplements generation with ‘Other’ (4/5)
Here is the simulation from weeks 215 to 218. It was 100% renewable (3/5)

October 29, 2025 at 2:32 AM
Here is the simulation from weeks 215 to 218. It was 100% renewable (3/5)
Last week had:
- average demand (102% of long-term average)
- average wind (103%)
- above average solar (110%) (2/5)
- average demand (102% of long-term average)
- average wind (103%)
- above average solar (110%) (2/5)


October 29, 2025 at 2:32 AM
Last week had:
- average demand (102% of long-term average)
- average wind (103%)
- above average solar (110%) (2/5)
- average demand (102% of long-term average)
- average wind (103%)
- above average solar (110%) (2/5)
Thread: Each week I run a simulation of Australia’s main electricity grid using rescaled generation data to show that it can get very close to 100% renewable electricity with 24GW/120GWh of storage (5 hrs at av demand)
Results:
Last week: 100% RE
Last 218 weeks: 98.5% RE (1/5)
Results:
Last week: 100% RE
Last 218 weeks: 98.5% RE (1/5)

October 29, 2025 at 2:31 AM
Thread: Each week I run a simulation of Australia’s main electricity grid using rescaled generation data to show that it can get very close to 100% renewable electricity with 24GW/120GWh of storage (5 hrs at av demand)
Results:
Last week: 100% RE
Last 218 weeks: 98.5% RE (1/5)
Results:
Last week: 100% RE
Last 218 weeks: 98.5% RE (1/5)
The simulation has used wind, rooftop & utility solar data from
OpenNEM, rescaled to supply ~60%, 25% & 20% respectively over the year. It uses the storage & existing hydro to match demand. If there remains a shortfall then the model supplements generation with ‘Other’ (4/5)
OpenNEM, rescaled to supply ~60%, 25% & 20% respectively over the year. It uses the storage & existing hydro to match demand. If there remains a shortfall then the model supplements generation with ‘Other’ (4/5)


October 22, 2025 at 2:59 AM
The simulation has used wind, rooftop & utility solar data from
OpenNEM, rescaled to supply ~60%, 25% & 20% respectively over the year. It uses the storage & existing hydro to match demand. If there remains a shortfall then the model supplements generation with ‘Other’ (4/5)
OpenNEM, rescaled to supply ~60%, 25% & 20% respectively over the year. It uses the storage & existing hydro to match demand. If there remains a shortfall then the model supplements generation with ‘Other’ (4/5)
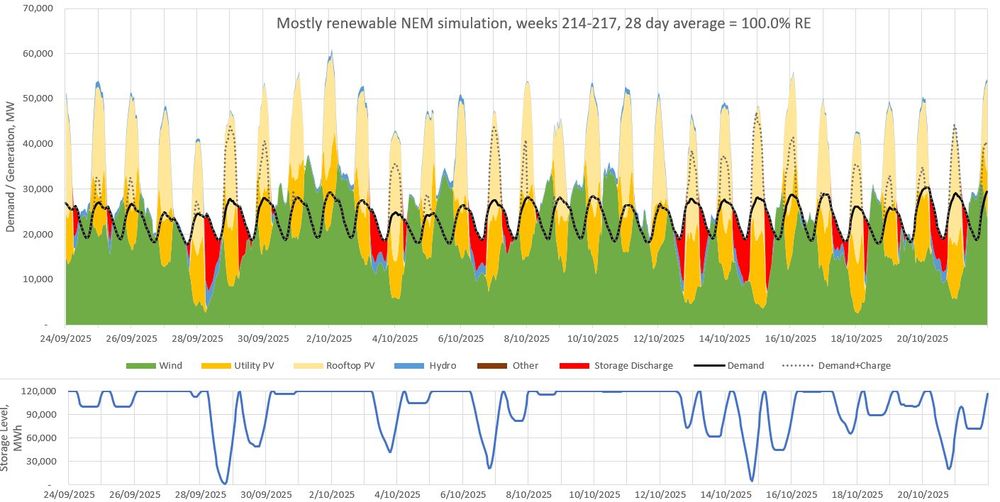
Here is the simulation from weeks 214 to 217. It was 100% renewable.
For earlier weeks, see the following thread (3/5)
For earlier weeks, see the following thread (3/5)
October 22, 2025 at 2:58 AM
Here is the simulation from weeks 214 to 217. It was 100% renewable.
For earlier weeks, see the following thread (3/5)
For earlier weeks, see the following thread (3/5)
Last week had:
- average demand (100% of long-term average)
- above average wind (110%)
- well above average solar (117%) (2/5)
- average demand (100% of long-term average)
- above average wind (110%)
- well above average solar (117%) (2/5)


October 22, 2025 at 2:58 AM
Last week had:
- average demand (100% of long-term average)
- above average wind (110%)
- well above average solar (117%) (2/5)
- average demand (100% of long-term average)
- above average wind (110%)
- well above average solar (117%) (2/5)
Thread: Each week I run a simulation of Australia’s main electricity grid using rescaled generation data to show that it can get very close to 100% renewable electricity with 24GW/120GWh of storage (5 hrs at av demand)
Results:
Last week: 100.0% RE
Last 217 weeks: 98.5% RE (1/5)
Results:
Last week: 100.0% RE
Last 217 weeks: 98.5% RE (1/5)

October 22, 2025 at 2:57 AM
Thread: Each week I run a simulation of Australia’s main electricity grid using rescaled generation data to show that it can get very close to 100% renewable electricity with 24GW/120GWh of storage (5 hrs at av demand)
Results:
Last week: 100.0% RE
Last 217 weeks: 98.5% RE (1/5)
Results:
Last week: 100.0% RE
Last 217 weeks: 98.5% RE (1/5)
Cheers Jason, storage installations are absolutely booming at the moment, both utility and residential.
It's the build of wind and solar which is the limiting factor now. See also this post
bsky.app/profile/davi...
It's the build of wind and solar which is the limiting factor now. See also this post
bsky.app/profile/davi...

October 16, 2025 at 12:08 AM
Cheers Jason, storage installations are absolutely booming at the moment, both utility and residential.
It's the build of wind and solar which is the limiting factor now. See also this post
bsky.app/profile/davi...
It's the build of wind and solar which is the limiting factor now. See also this post
bsky.app/profile/davi...
My latest estimate:

October 15, 2025 at 11:22 PM
My latest estimate:
The simulation has used wind, rooftop & utility solar data from
OpenNEM, rescaled to supply ~60%, 25% & 20% respectively over the year. It uses the storage & existing hydro to match demand. If there remains a shortfall then the model supplements generation with ‘Other’ (4/5)
OpenNEM, rescaled to supply ~60%, 25% & 20% respectively over the year. It uses the storage & existing hydro to match demand. If there remains a shortfall then the model supplements generation with ‘Other’ (4/5)


October 15, 2025 at 10:30 PM
The simulation has used wind, rooftop & utility solar data from
OpenNEM, rescaled to supply ~60%, 25% & 20% respectively over the year. It uses the storage & existing hydro to match demand. If there remains a shortfall then the model supplements generation with ‘Other’ (4/5)
OpenNEM, rescaled to supply ~60%, 25% & 20% respectively over the year. It uses the storage & existing hydro to match demand. If there remains a shortfall then the model supplements generation with ‘Other’ (4/5)
Here is the simulation from weeks 213 to 216. It was 100% renewable.
For earlier weeks, see the following thread (3/5)
For earlier weeks, see the following thread (3/5)

October 15, 2025 at 10:29 PM
Here is the simulation from weeks 213 to 216. It was 100% renewable.
For earlier weeks, see the following thread (3/5)
For earlier weeks, see the following thread (3/5)
Last week had:
- average demand (99% of long-term average)
- well above average wind (126%)
- well above average solar (115%) (2/5)
- average demand (99% of long-term average)
- well above average wind (126%)
- well above average solar (115%) (2/5)
October 15, 2025 at 10:28 PM
Last week had:
- average demand (99% of long-term average)
- well above average wind (126%)
- well above average solar (115%) (2/5)
- average demand (99% of long-term average)
- well above average wind (126%)
- well above average solar (115%) (2/5)
Thread: Each week I run a simulation of Australia’s main electricity grid using rescaled generation data to show that it can get very close to 100% renewable electricity with 24GW/120GWh of storage (5 hrs at av demand)
Results:
Last week: 100% RE
Last 216 weeks: 98.5% RE (1/5)
Results:
Last week: 100% RE
Last 216 weeks: 98.5% RE (1/5)

October 15, 2025 at 10:27 PM
Thread: Each week I run a simulation of Australia’s main electricity grid using rescaled generation data to show that it can get very close to 100% renewable electricity with 24GW/120GWh of storage (5 hrs at av demand)
Results:
Last week: 100% RE
Last 216 weeks: 98.5% RE (1/5)
Results:
Last week: 100% RE
Last 216 weeks: 98.5% RE (1/5)
Some greater detail here: www.linkedin.com/posts/david-...


October 14, 2025 at 12:59 AM
Some greater detail here: www.linkedin.com/posts/david-...
The simulation has used wind, rooftop & utility solar data from
OpenNEM, rescaled to supply ~60%, 25% & 20% respectively over the year. It uses the storage & existing hydro to match demand. If there remains a shortfall then the model supplements generation with ‘Other’ (4/5)
OpenNEM, rescaled to supply ~60%, 25% & 20% respectively over the year. It uses the storage & existing hydro to match demand. If there remains a shortfall then the model supplements generation with ‘Other’ (4/5)


October 8, 2025 at 2:12 AM
The simulation has used wind, rooftop & utility solar data from
OpenNEM, rescaled to supply ~60%, 25% & 20% respectively over the year. It uses the storage & existing hydro to match demand. If there remains a shortfall then the model supplements generation with ‘Other’ (4/5)
OpenNEM, rescaled to supply ~60%, 25% & 20% respectively over the year. It uses the storage & existing hydro to match demand. If there remains a shortfall then the model supplements generation with ‘Other’ (4/5)