@daghj.bsky.social
Reposted

Extremely disappointed to hear that #Viljandi & the Estonian War Museum have decided to go ahead with the exhumation and plan to finish it already this week (sic!). A massive loss to Estonian #history & #archaeology 1/2
July 15, 2025 at 6:27 AM
Extremely disappointed to hear that #Viljandi & the Estonian War Museum have decided to go ahead with the exhumation and plan to finish it already this week (sic!). A massive loss to Estonian #history & #archaeology 1/2
Reposted

Land does not vote.
Sharing the #rstats code for my animation which blends a choropleth map showing the party of the winning candidates by first votes in the German Federal Election 2025 by colour to a map of equally sized dots for each constituency:
github.com/bydata/btw-2...
#dataviz 📊
Sharing the #rstats code for my animation which blends a choropleth map showing the party of the winning candidates by first votes in the German Federal Election 2025 by colour to a map of equally sized dots for each constituency:
github.com/bydata/btw-2...
#dataviz 📊
March 4, 2025 at 11:52 AM
Land does not vote.
Sharing the #rstats code for my animation which blends a choropleth map showing the party of the winning candidates by first votes in the German Federal Election 2025 by colour to a map of equally sized dots for each constituency:
github.com/bydata/btw-2...
#dataviz 📊
Sharing the #rstats code for my animation which blends a choropleth map showing the party of the winning candidates by first votes in the German Federal Election 2025 by colour to a map of equally sized dots for each constituency:
github.com/bydata/btw-2...
#dataviz 📊
Reposted

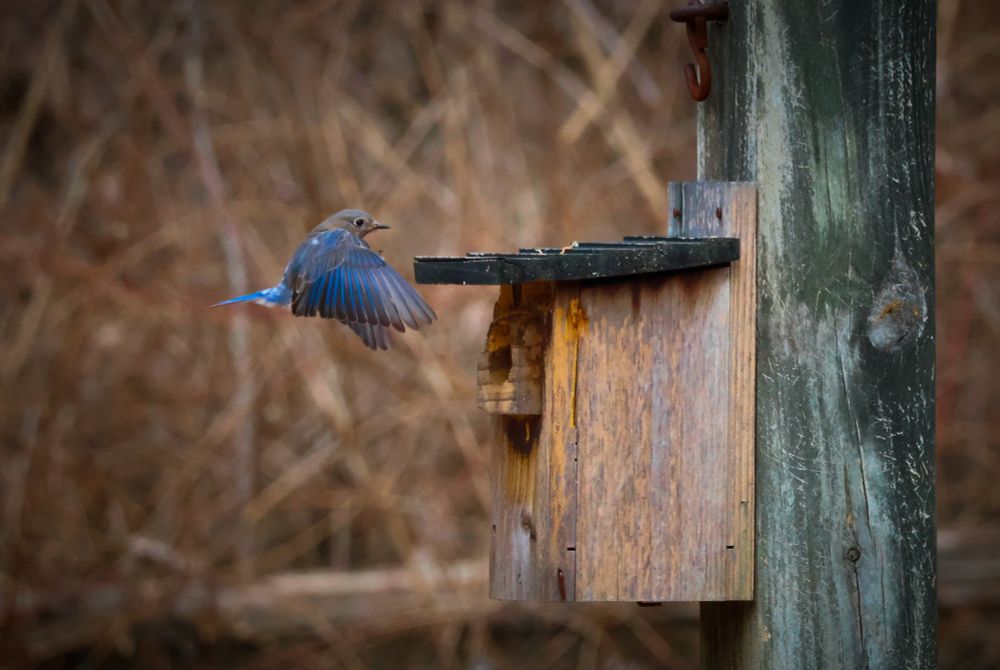
Let's just assume the day is going to be the kind of day where we all need one (1) bird, so here is your bird; feel free to stop here throughout your day and regard this bird
okay good
photo by me
okay good
photo by me
March 5, 2025 at 1:33 PM
Let's just assume the day is going to be the kind of day where we all need one (1) bird, so here is your bird; feel free to stop here throughout your day and regard this bird
okay good
photo by me
okay good
photo by me
Reposted

Attention data journalists (and others 😃) who want to use geospatial data with R for story telling: #RStats #RSpatial #DDJ #RShiny #GIS
⬇️⬇️⬇️
⬇️⬇️⬇️

The latest version of the {mapgl} #rstats package is now released, supporting scrollytelling-style story maps!
Build richly interactive map stories from your R data pipelines using @Mapbox or @maplibre as your backend.
Learn how in the new vignette: walker-data.com/mapg...
Build richly interactive map stories from your R data pipelines using @Mapbox or @maplibre as your backend.
Learn how in the new vignette: walker-data.com/mapg...
January 14, 2025 at 3:06 PM