
climatecentral.org
Climate Matters: www.climatecentral.org/climate-matt...
Graphic: www.climatecentral.org/graphic/nove...
Video: www.climatecentral.org/graphic/nove...

Climate Matters: www.climatecentral.org/climate-matt...
Graphic: www.climatecentral.org/graphic/nove...
Video: www.climatecentral.org/graphic/nove...
coastal.climatecentral.org/toxic-tides
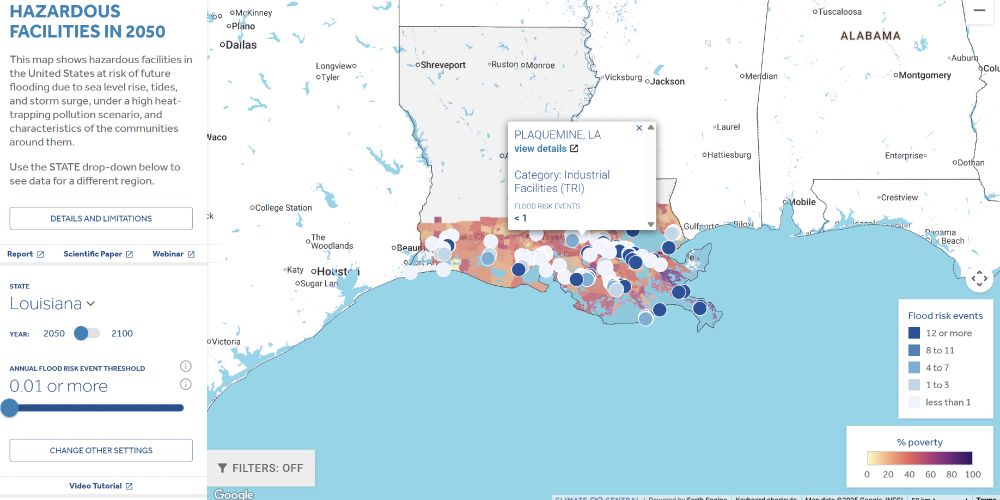
coastal.climatecentral.org/toxic-tides
• Interactive Climate Shift Index to click through the data | csi.climatecentral.org
• Climate Change + Warmer Fall | www.climatecentral.org/climate-matt...
• Recent Records Map | sercc.oasis.unc.edu/Map.php?regi...
• Interactive Climate Shift Index to click through the data | csi.climatecentral.org
• Climate Change + Warmer Fall | www.climatecentral.org/climate-matt...
• Recent Records Map | sercc.oasis.unc.edu/Map.php?regi...
Every county in the Lower 48 has seen warming from September to November, mostly due to climate change.
Since 1970, fall has warmed by 2.8°F on average across 237 U.S. cities.
Cooler days still happen, but warmer-than-average days are happening more often.
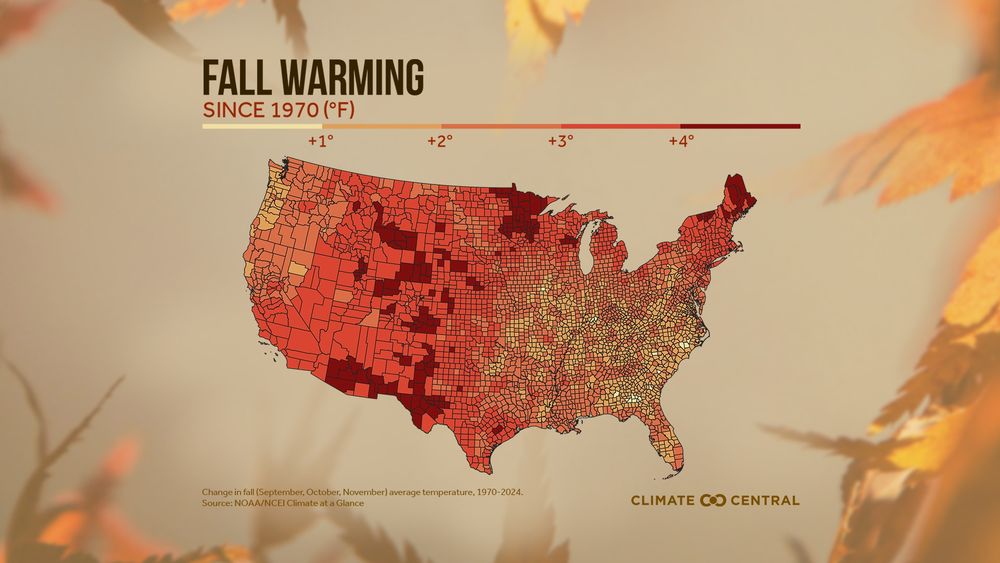
Every county in the Lower 48 has seen warming from September to November, mostly due to climate change.
Since 1970, fall has warmed by 2.8°F on average across 237 U.S. cities.
Cooler days still happen, but warmer-than-average days are happening more often.
For areas in South Texas and northern Florida, warmth like this would be rare or almost impossible without heat-trapping pollution.
For areas in South Texas and northern Florida, warmth like this would be rare or almost impossible without heat-trapping pollution.

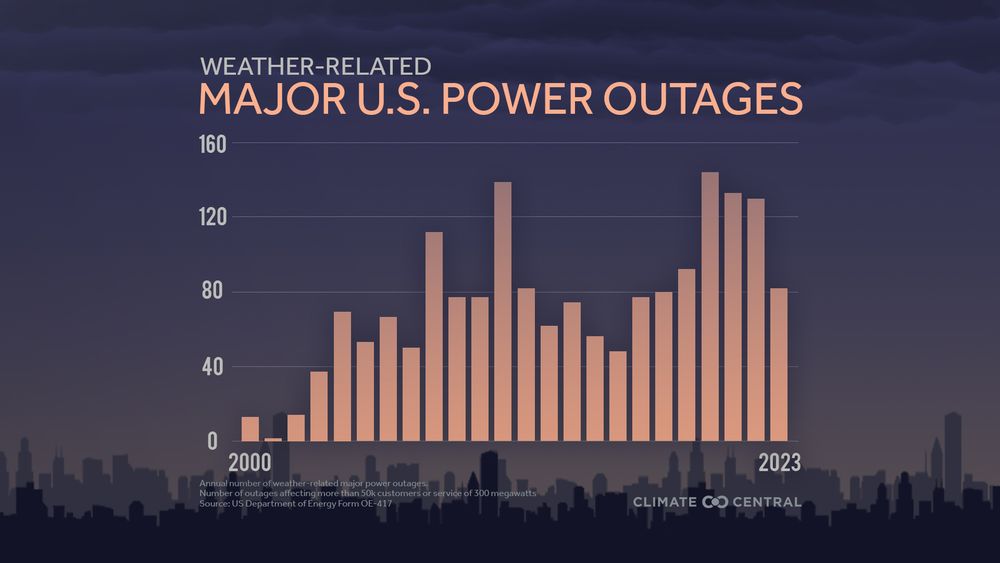
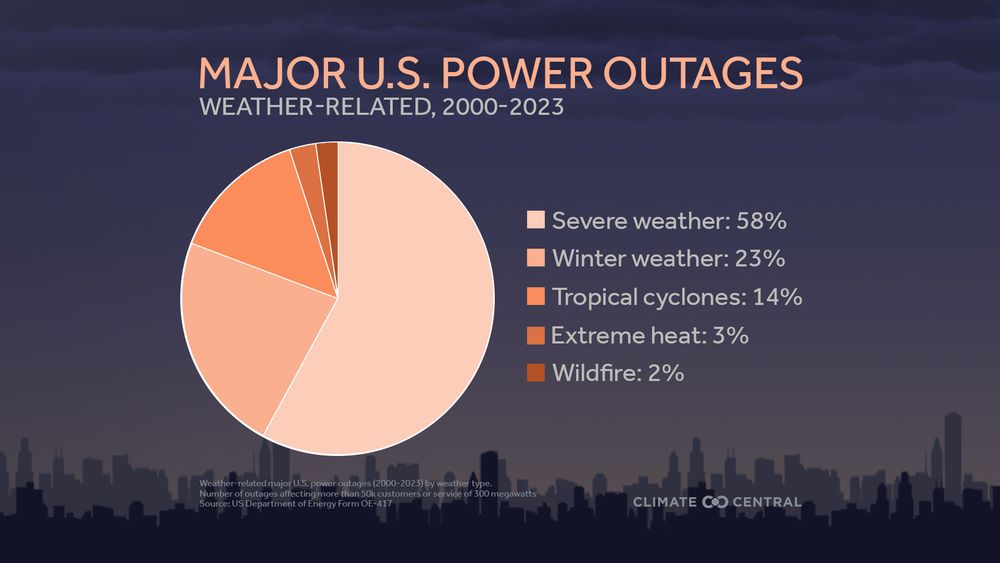
About 80% of major U.S. power outages are now tied to weather:
• Severe storms: 58%
• Winter storms: 23%
• Tropical cyclones: 14%
• Extreme Heat (3%)
• Wildfires (2%)
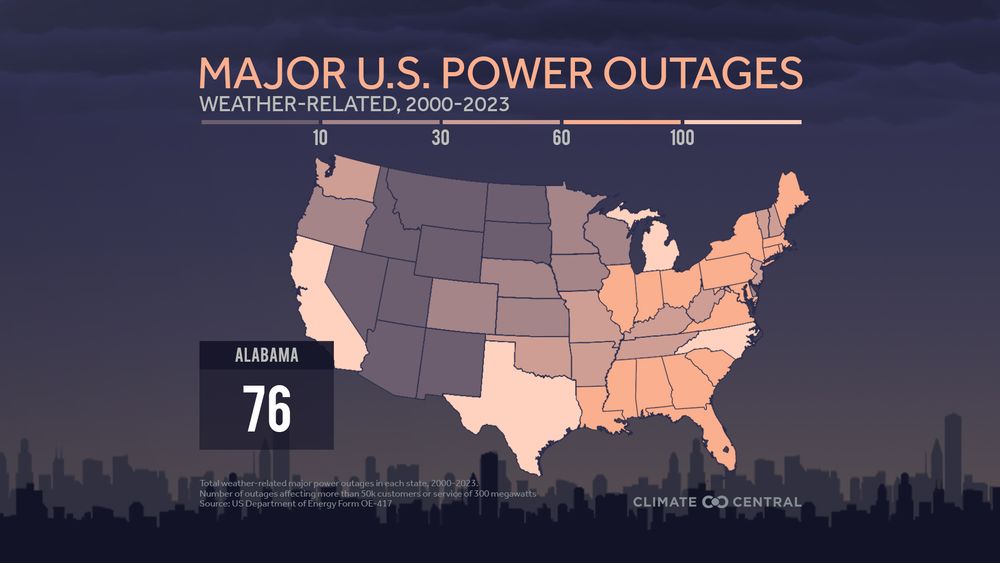
About 80% of major U.S. power outages are now tied to weather:
• Severe storms: 58%
• Winter storms: 23%
• Tropical cyclones: 14%
• Extreme Heat (3%)
• Wildfires (2%)

