


Climate Central
@climatecentral.org
Researching and reporting the science and impacts of climate change 🌎
climatecentral.org
climatecentral.org
Happy Thanksgiving 🦃! Learn how November temperatures are rising across the U.S. as well as the hottest, coldest and wettest Thanksgiving in 245 U.S. cities in this week's Climate Matters.
buff.ly/qUf7XoR
buff.ly/qUf7XoR

November 27, 2025 at 5:02 PM
Happy Thanksgiving 🦃! Learn how November temperatures are rising across the U.S. as well as the hottest, coldest and wettest Thanksgiving in 245 U.S. cities in this week's Climate Matters.
buff.ly/qUf7XoR
buff.ly/qUf7XoR
Headed back home this Thanksgiving🦃? Climate Central can help you find out your hometown's climate story. Find data, visuals and relevant climate information available for over 240 U.S. cities and every state at the link below.
buff.ly/81lOb0Z
#WhatsYourClimateStory
buff.ly/81lOb0Z
#WhatsYourClimateStory

November 26, 2025 at 4:00 PM
Headed back home this Thanksgiving🦃? Climate Central can help you find out your hometown's climate story. Find data, visuals and relevant climate information available for over 240 U.S. cities and every state at the link below.
buff.ly/81lOb0Z
#WhatsYourClimateStory
buff.ly/81lOb0Z
#WhatsYourClimateStory
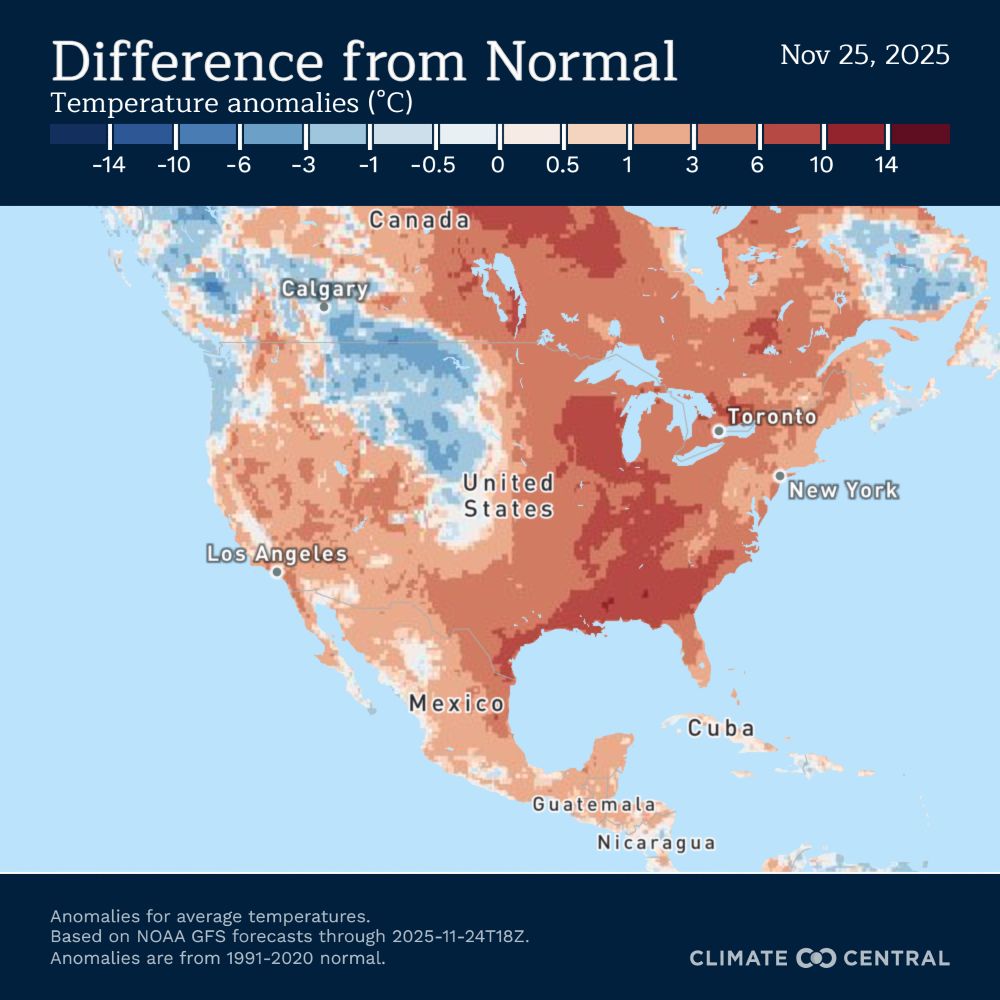
Tracking the weather this Thanksgiving week 🦃?
🌡️Find past and forecast global temperature anomalies using our Climate Shift Index tool. ⬇️
csi.climatecentral.org/climate-shif...
🌡️Find past and forecast global temperature anomalies using our Climate Shift Index tool. ⬇️
csi.climatecentral.org/climate-shif...
November 25, 2025 at 6:59 PM
Tracking the weather this Thanksgiving week 🦃?
🌡️Find past and forecast global temperature anomalies using our Climate Shift Index tool. ⬇️
csi.climatecentral.org/climate-shif...
🌡️Find past and forecast global temperature anomalies using our Climate Shift Index tool. ⬇️
csi.climatecentral.org/climate-shif...
🌡️🦃 🍂November temperatures are rising across the U.S.
Of 247 U.S. cities analyzed, 92% saw November temperatures rise since 1970 — by 2.4°F on average.
Find out more + the hottest/coldest/rainiest Thanksgiving on record in this week's Climate Matters
www.climatecentral.org/climate-matt...
Of 247 U.S. cities analyzed, 92% saw November temperatures rise since 1970 — by 2.4°F on average.
Find out more + the hottest/coldest/rainiest Thanksgiving on record in this week's Climate Matters
www.climatecentral.org/climate-matt...

November 24, 2025 at 6:23 PM
🌡️🦃 🍂November temperatures are rising across the U.S.
Of 247 U.S. cities analyzed, 92% saw November temperatures rise since 1970 — by 2.4°F on average.
Find out more + the hottest/coldest/rainiest Thanksgiving on record in this week's Climate Matters
www.climatecentral.org/climate-matt...
Of 247 U.S. cities analyzed, 92% saw November temperatures rise since 1970 — by 2.4°F on average.
Find out more + the hottest/coldest/rainiest Thanksgiving on record in this week's Climate Matters
www.climatecentral.org/climate-matt...
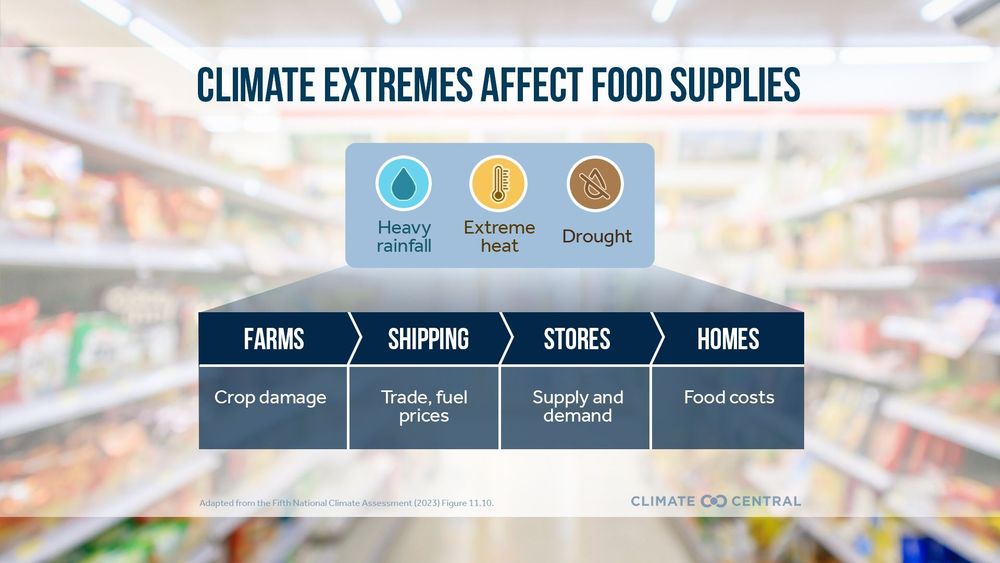
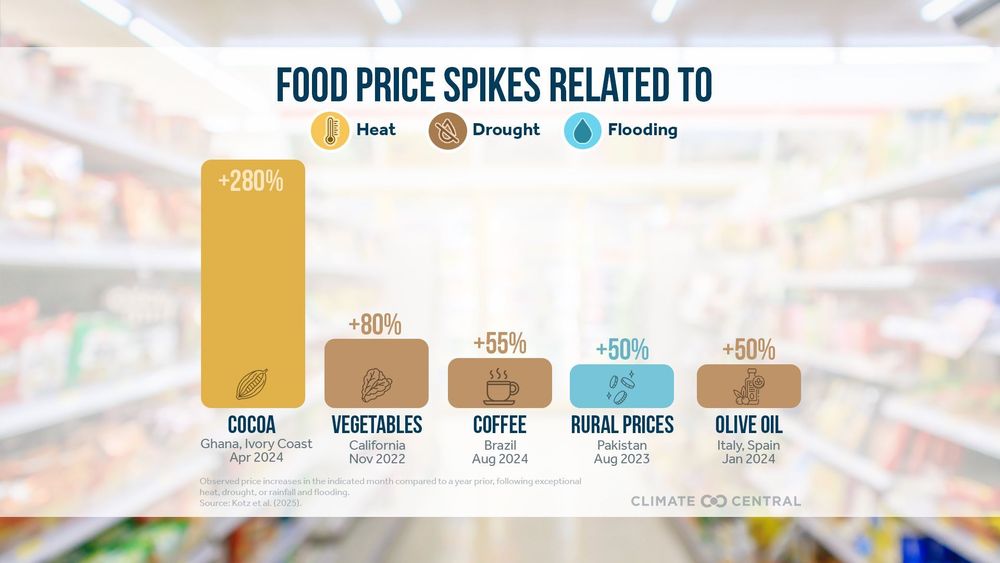
Food and climate change are closely linked. Not only do food systems account for ~1/4 of all heat-trapping pollution but extreme events fueled by climate change can damage crops, reduce yields, and disrupt supply chains — all of which can drive food prices higher.
For more:
buff.ly/KHJvS7T
For more:
buff.ly/KHJvS7T
November 20, 2025 at 8:01 PM
Food and climate change are closely linked. Not only do food systems account for ~1/4 of all heat-trapping pollution but extreme events fueled by climate change can damage crops, reduce yields, and disrupt supply chains — all of which can drive food prices higher.
For more:
buff.ly/KHJvS7T
For more:
buff.ly/KHJvS7T
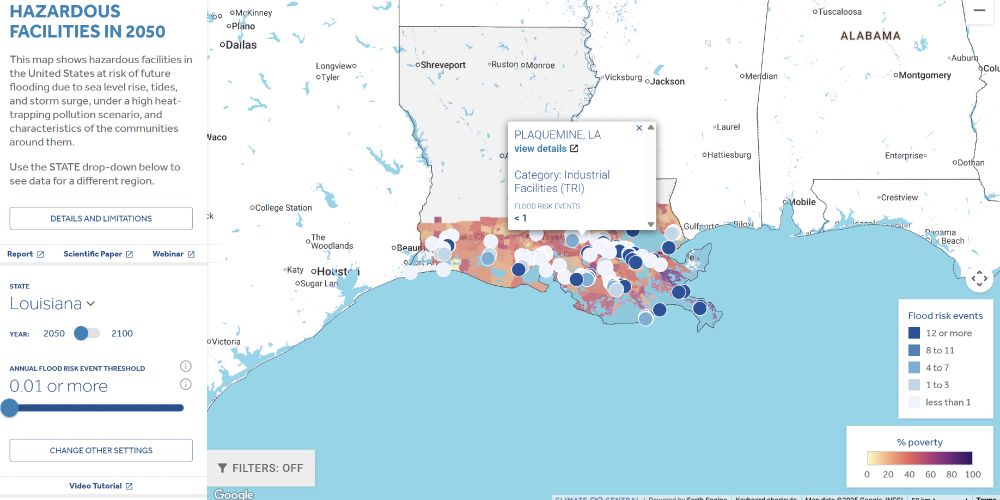
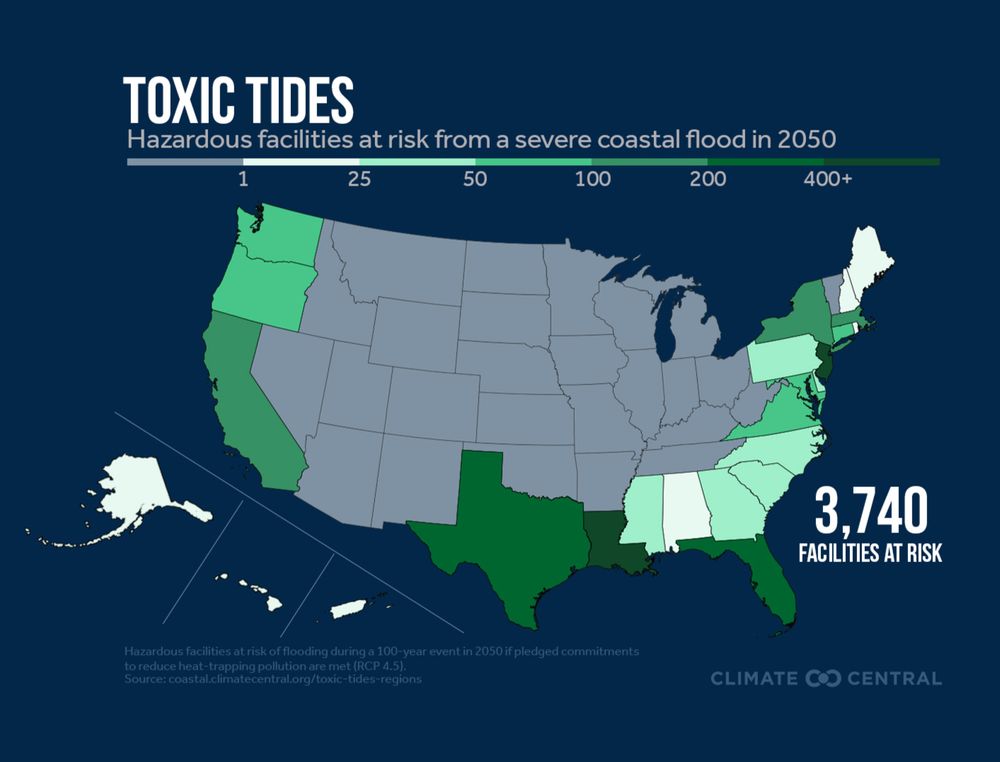
Climate Central’s new Toxic Tides report includes maps to find what toxic facilities are at risk in your community, how often and when they could flood, and who lives nearby. Check out the interactive below.⬇️
coastal.climatecentral.org/toxic-tides
coastal.climatecentral.org/toxic-tides
November 20, 2025 at 4:14 PM
Climate Central’s new Toxic Tides report includes maps to find what toxic facilities are at risk in your community, how often and when they could flood, and who lives nearby. Check out the interactive below.⬇️
coastal.climatecentral.org/toxic-tides
coastal.climatecentral.org/toxic-tides
In just 25 years, over 3,700 toxic facilities will be at risk of coastal flooding as seas continue to rise due to climate change. And those most affected will be the most vulnerable among us. Learn more in Climate Central’s new Toxic Tides report.
www.climatecentral.org/report/toxic...
www.climatecentral.org/report/toxic...
November 20, 2025 at 4:14 PM
In just 25 years, over 3,700 toxic facilities will be at risk of coastal flooding as seas continue to rise due to climate change. And those most affected will be the most vulnerable among us. Learn more in Climate Central’s new Toxic Tides report.
www.climatecentral.org/report/toxic...
www.climatecentral.org/report/toxic...
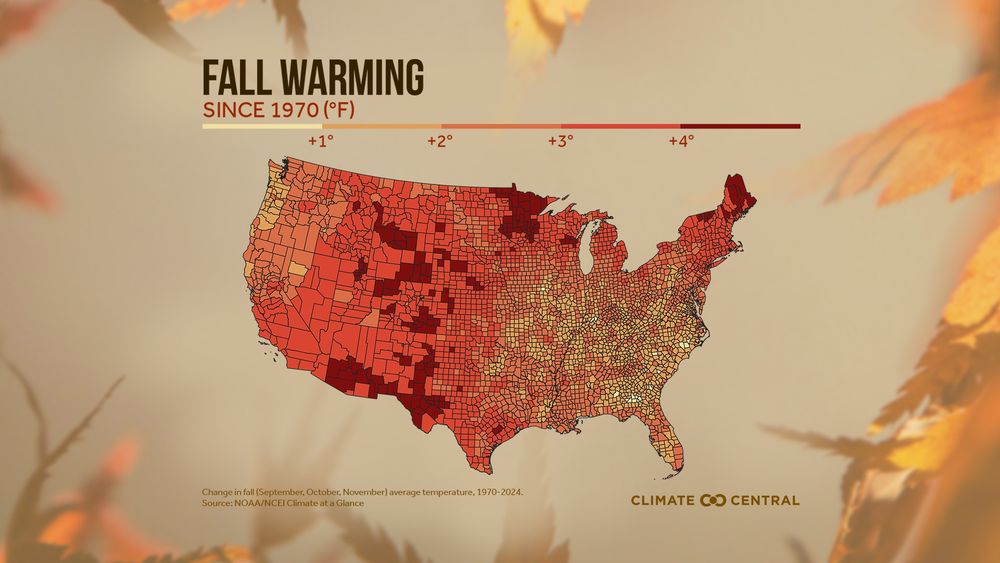
Quick reminder ⤵️
Every county in the Lower 48 has seen warming from September to November, mostly due to climate change.
Since 1970, fall has warmed by 2.8°F on average across 237 U.S. cities.
Cooler days still happen, but warmer-than-average days are happening more often.
Every county in the Lower 48 has seen warming from September to November, mostly due to climate change.
Since 1970, fall has warmed by 2.8°F on average across 237 U.S. cities.
Cooler days still happen, but warmer-than-average days are happening more often.

November 19, 2025 at 11:25 PM
Quick reminder ⤵️
Every county in the Lower 48 has seen warming from September to November, mostly due to climate change.
Since 1970, fall has warmed by 2.8°F on average across 237 U.S. cities.
Cooler days still happen, but warmer-than-average days are happening more often.
Every county in the Lower 48 has seen warming from September to November, mostly due to climate change.
Since 1970, fall has warmed by 2.8°F on average across 237 U.S. cities.
Cooler days still happen, but warmer-than-average days are happening more often.
Climate Shift Index data show temperatures 10° to 25° above average were made 2 to 3 times more likely by human-caused climate change.
For areas in South Texas and northern Florida, warmth like this would be rare or almost impossible without heat-trapping pollution.
For areas in South Texas and northern Florida, warmth like this would be rare or almost impossible without heat-trapping pollution.
November 19, 2025 at 11:25 PM
Climate Shift Index data show temperatures 10° to 25° above average were made 2 to 3 times more likely by human-caused climate change.
For areas in South Texas and northern Florida, warmth like this would be rare or almost impossible without heat-trapping pollution.
For areas in South Texas and northern Florida, warmth like this would be rare or almost impossible without heat-trapping pollution.
Cooler weather is on the way for the Lower 48 as we get closer to December.
But before the pattern shifts, unusual November warmth has been breaking or nearing daily records across the US this week.
🧵Here’s how we know climate change has a clear influence on this fall heat
But before the pattern shifts, unusual November warmth has been breaking or nearing daily records across the US this week.
🧵Here’s how we know climate change has a clear influence on this fall heat
November 19, 2025 at 11:25 PM
Cooler weather is on the way for the Lower 48 as we get closer to December.
But before the pattern shifts, unusual November warmth has been breaking or nearing daily records across the US this week.
🧵Here’s how we know climate change has a clear influence on this fall heat
But before the pattern shifts, unusual November warmth has been breaking or nearing daily records across the US this week.
🧵Here’s how we know climate change has a clear influence on this fall heat

November 18, 2025 at 7:01 PM
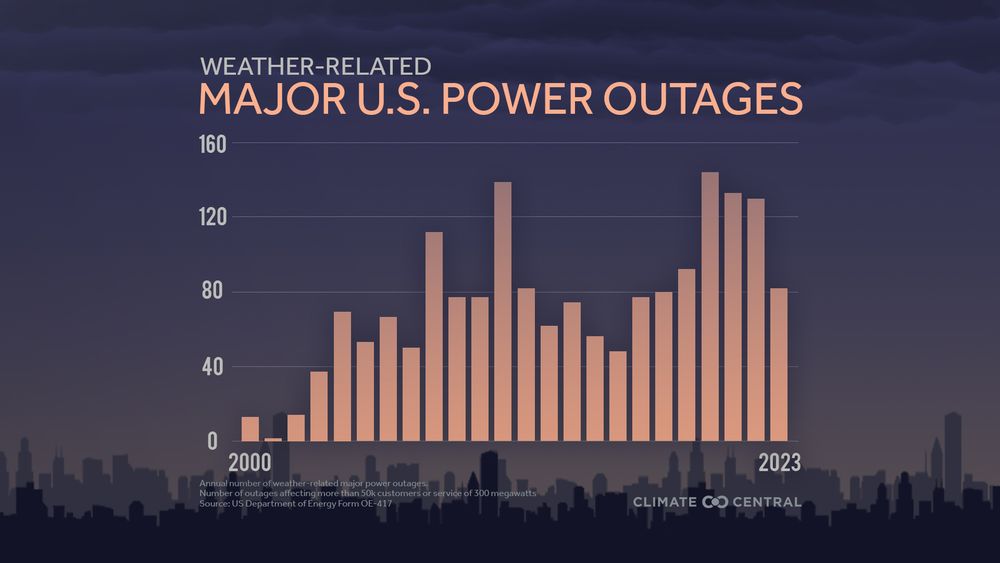
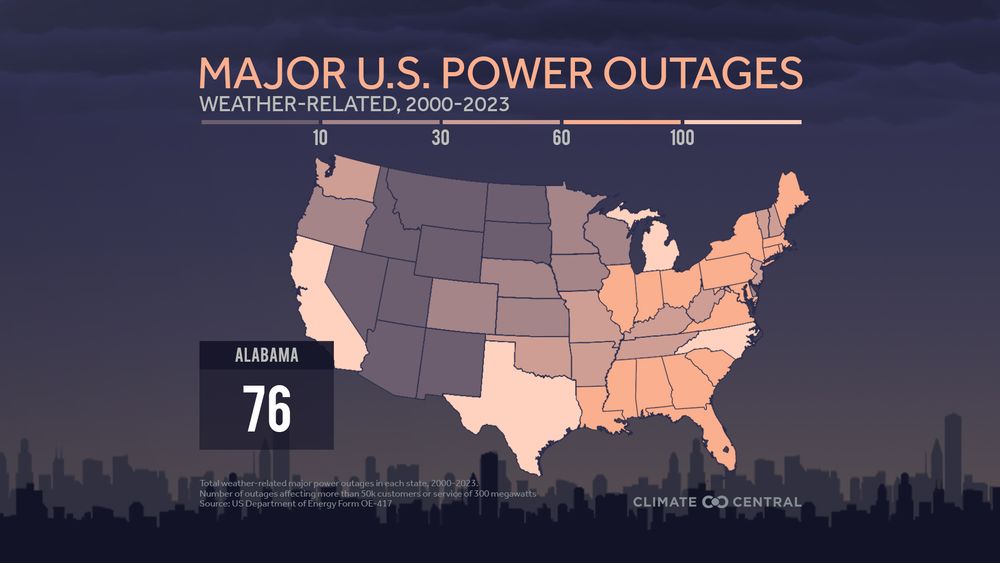
Climate change is making many extreme weather events more frequent or intense, and our aging energy systems are feeling it.
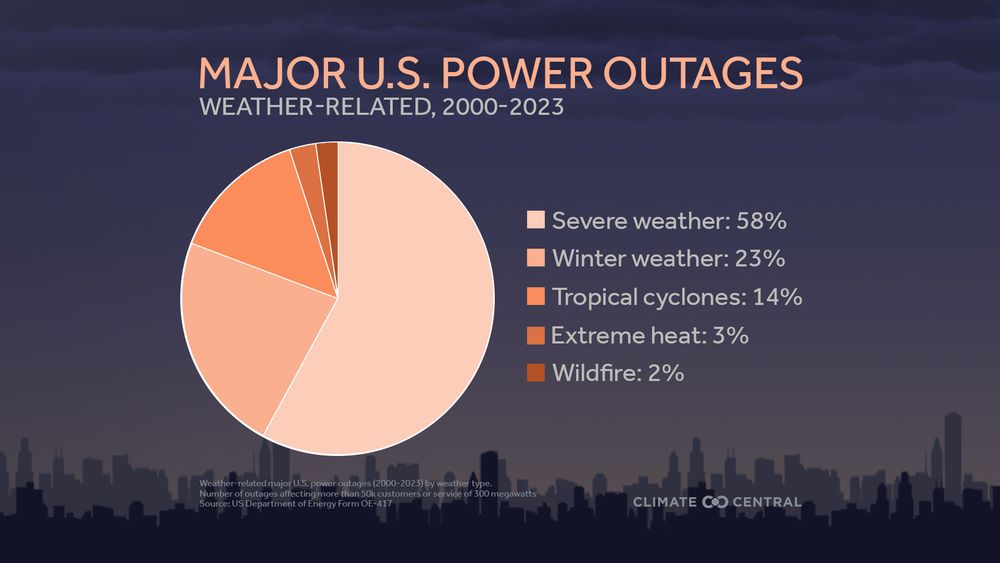
About 80% of major U.S. power outages are now tied to weather:
• Severe storms: 58%
• Winter storms: 23%
• Tropical cyclones: 14%
• Extreme Heat (3%)
• Wildfires (2%)
About 80% of major U.S. power outages are now tied to weather:
• Severe storms: 58%
• Winter storms: 23%
• Tropical cyclones: 14%
• Extreme Heat (3%)
• Wildfires (2%)
November 18, 2025 at 7:01 PM
Climate change is making many extreme weather events more frequent or intense, and our aging energy systems are feeling it.
About 80% of major U.S. power outages are now tied to weather:
• Severe storms: 58%
• Winter storms: 23%
• Tropical cyclones: 14%
• Extreme Heat (3%)
• Wildfires (2%)
About 80% of major U.S. power outages are now tied to weather:
• Severe storms: 58%
• Winter storms: 23%
• Tropical cyclones: 14%
• Extreme Heat (3%)
• Wildfires (2%)
Join @climatecentral.org's Dr. Kristy Dahl and a panel of experts at COP30 for a dialogue on how to balance fast mitigation and dynamic adaptation strategies to stay ahead of accelerating climate risks.

November 17, 2025 at 2:26 PM
Join @climatecentral.org's Dr. Kristy Dahl and a panel of experts at COP30 for a dialogue on how to balance fast mitigation and dynamic adaptation strategies to stay ahead of accelerating climate risks.
📊Learn more + check out the data for your city ⬇️
• Climate Change's Impact on Winter: www.climatecentral.org/climate-matt...
• Explore the Interactive Map: observablehq.com/@climatecent...
• Climate Change's Impact on Winter: www.climatecentral.org/climate-matt...
• Explore the Interactive Map: observablehq.com/@climatecent...
November 12, 2025 at 10:42 PM
📊Learn more + check out the data for your city ⬇️
• Climate Change's Impact on Winter: www.climatecentral.org/climate-matt...
• Explore the Interactive Map: observablehq.com/@climatecent...
• Climate Change's Impact on Winter: www.climatecentral.org/climate-matt...
• Explore the Interactive Map: observablehq.com/@climatecent...
In our warming world, the coldest days aren’t as cold.
The coldest days aren’t as cold, and those deep cold snaps? They don’t last like they used to.
Across 240 U.S. cities, the longest winter cold streaks have shortened by about 6 days since the 1970s.
The coldest days aren’t as cold, and those deep cold snaps? They don’t last like they used to.
Across 240 U.S. cities, the longest winter cold streaks have shortened by about 6 days since the 1970s.

November 12, 2025 at 10:42 PM
In our warming world, the coldest days aren’t as cold.
The coldest days aren’t as cold, and those deep cold snaps? They don’t last like they used to.
Across 240 U.S. cities, the longest winter cold streaks have shortened by about 6 days since the 1970s.
The coldest days aren’t as cold, and those deep cold snaps? They don’t last like they used to.
Across 240 U.S. cities, the longest winter cold streaks have shortened by about 6 days since the 1970s.
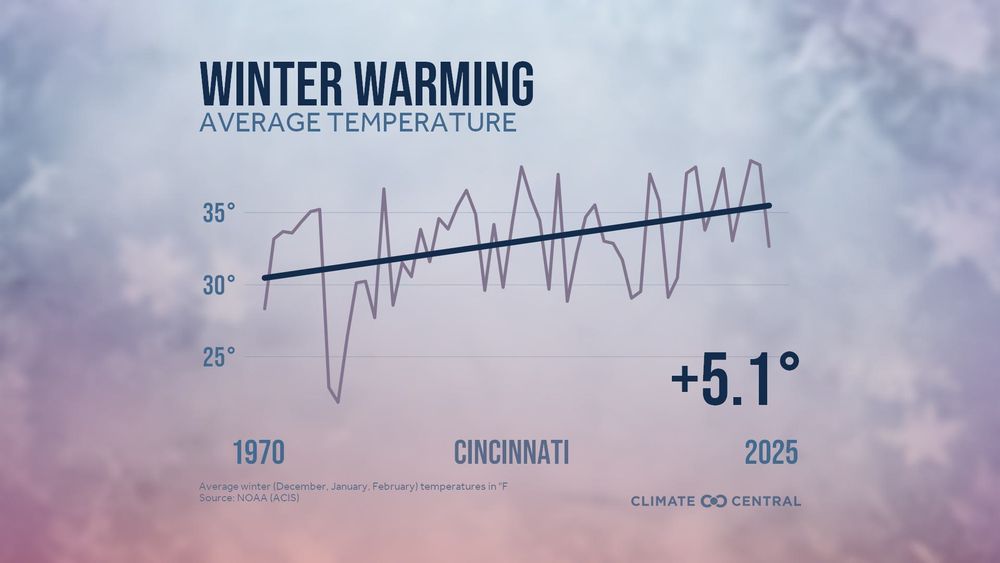
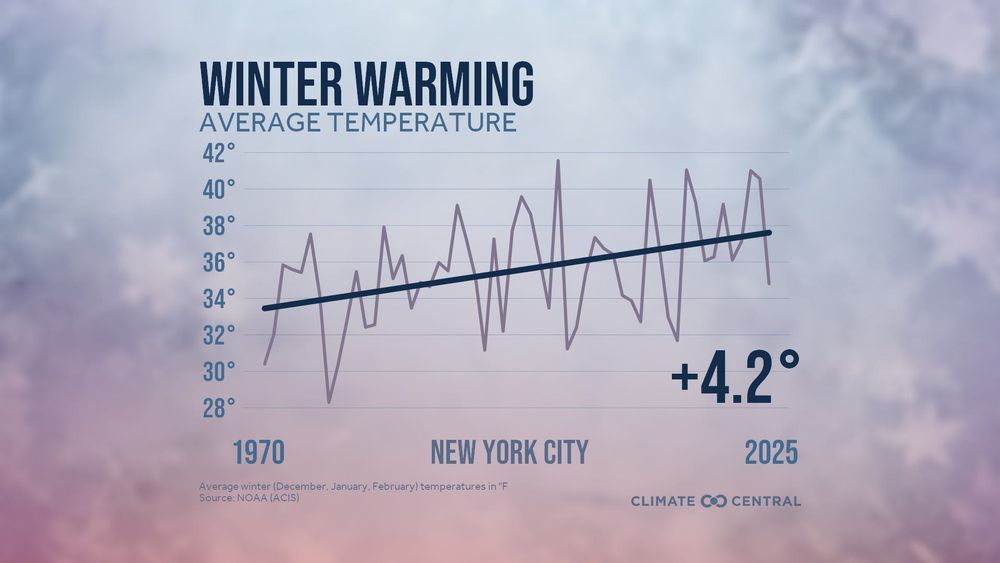
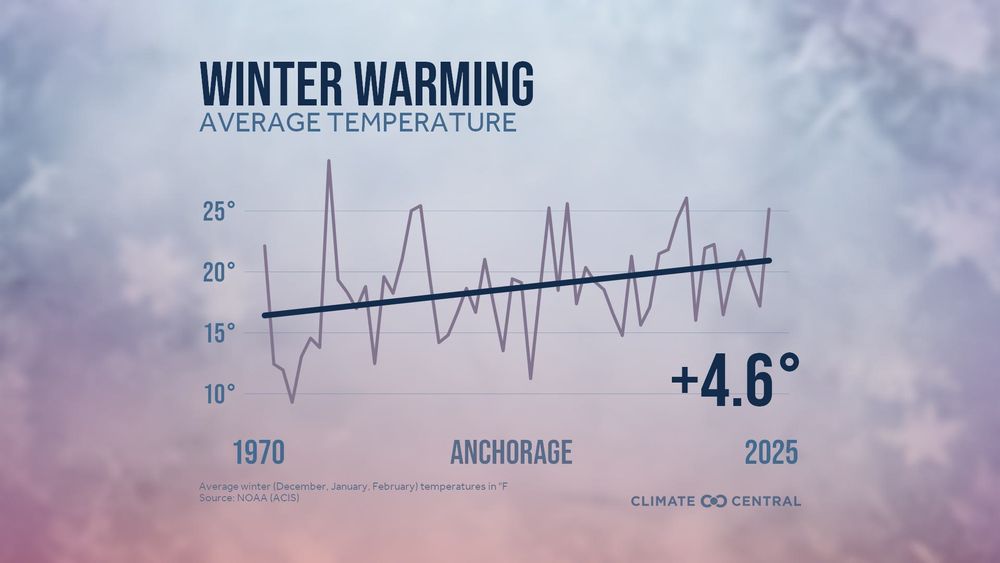
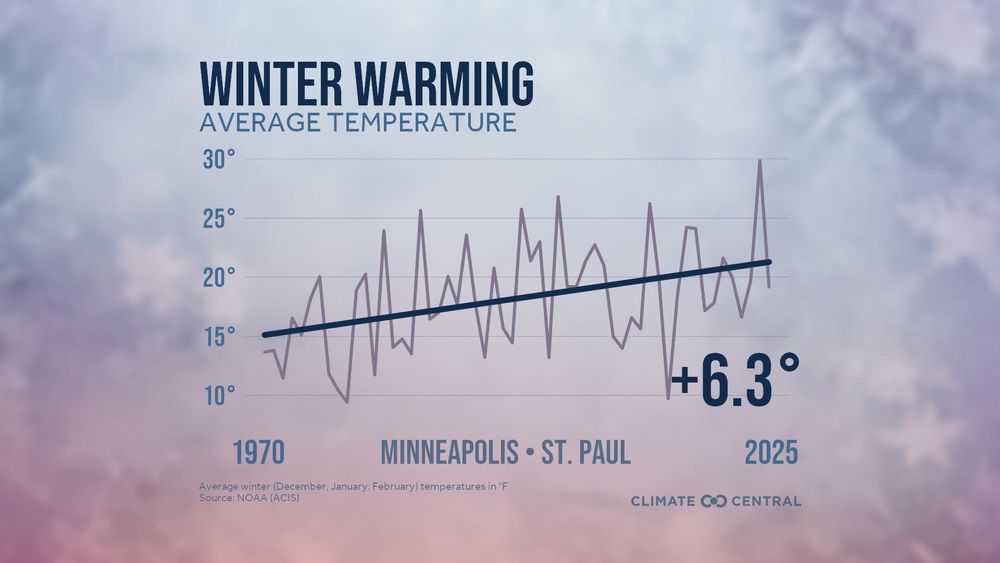
About 88% of U.S. cities now experience at least a full week more of warmer-than-normal winter days than they did in the 1970s.
On average, winters have warmed the most in cities across the:
❄️Upper Midwest: +5.4°F
❄️Alaska: +4.8°F
❄️Northeast: +4.8°F
❄️Ohio Valley: +4.4°F
On average, winters have warmed the most in cities across the:
❄️Upper Midwest: +5.4°F
❄️Alaska: +4.8°F
❄️Northeast: +4.8°F
❄️Ohio Valley: +4.4°F
November 12, 2025 at 10:42 PM
About 88% of U.S. cities now experience at least a full week more of warmer-than-normal winter days than they did in the 1970s.
On average, winters have warmed the most in cities across the:
❄️Upper Midwest: +5.4°F
❄️Alaska: +4.8°F
❄️Northeast: +4.8°F
❄️Ohio Valley: +4.4°F
On average, winters have warmed the most in cities across the:
❄️Upper Midwest: +5.4°F
❄️Alaska: +4.8°F
❄️Northeast: +4.8°F
❄️Ohio Valley: +4.4°F
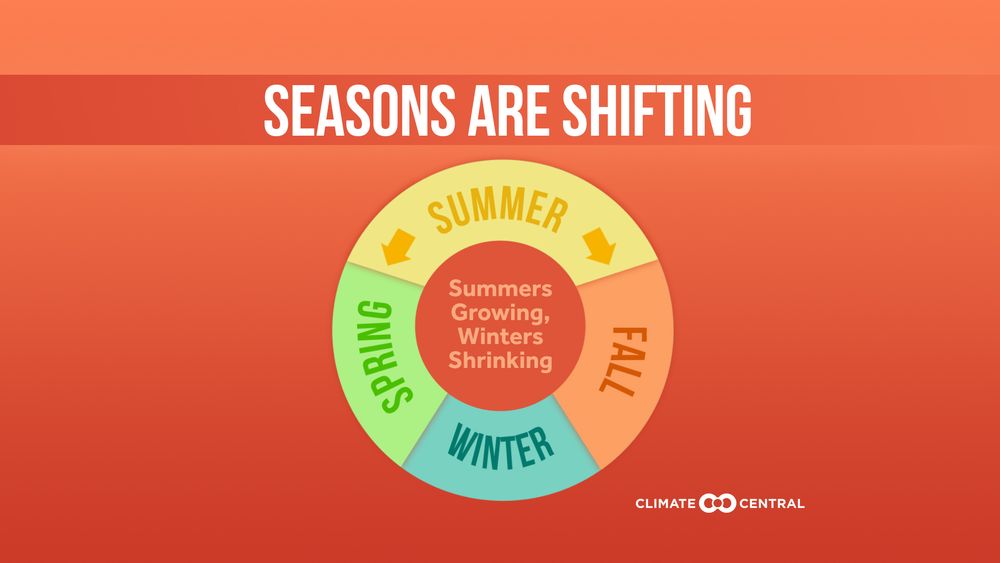
Winter isn't what it used to be.
It's actually the fastest-warming season for much of the U.S.
Since just 1970, winters (December - February) have warmed in 98% of 244 U.S. cities analyzed by 3.9°F on average.
Do you wanna build a snowman with few of the details? 🧵
It's actually the fastest-warming season for much of the U.S.
Since just 1970, winters (December - February) have warmed in 98% of 244 U.S. cities analyzed by 3.9°F on average.
Do you wanna build a snowman with few of the details? 🧵

November 12, 2025 at 10:42 PM
Winter isn't what it used to be.
It's actually the fastest-warming season for much of the U.S.
Since just 1970, winters (December - February) have warmed in 98% of 244 U.S. cities analyzed by 3.9°F on average.
Do you wanna build a snowman with few of the details? 🧵
It's actually the fastest-warming season for much of the U.S.
Since just 1970, winters (December - February) have warmed in 98% of 244 U.S. cities analyzed by 3.9°F on average.
Do you wanna build a snowman with few of the details? 🧵
In fall, when summer fights to keep hold & winter shoulders it's way in, Cold/cool/below-average days are expected
But the data is clear: these chilly days are shrinking, while warmer-than-average days are taking over
Since 1970, the U.S. fall has warmed by an average of 2.8°F.
But the data is clear: these chilly days are shrinking, while warmer-than-average days are taking over
Since 1970, the U.S. fall has warmed by an average of 2.8°F.
November 11, 2025 at 5:55 PM
In fall, when summer fights to keep hold & winter shoulders it's way in, Cold/cool/below-average days are expected
But the data is clear: these chilly days are shrinking, while warmer-than-average days are taking over
Since 1970, the U.S. fall has warmed by an average of 2.8°F.
But the data is clear: these chilly days are shrinking, while warmer-than-average days are taking over
Since 1970, the U.S. fall has warmed by an average of 2.8°F.
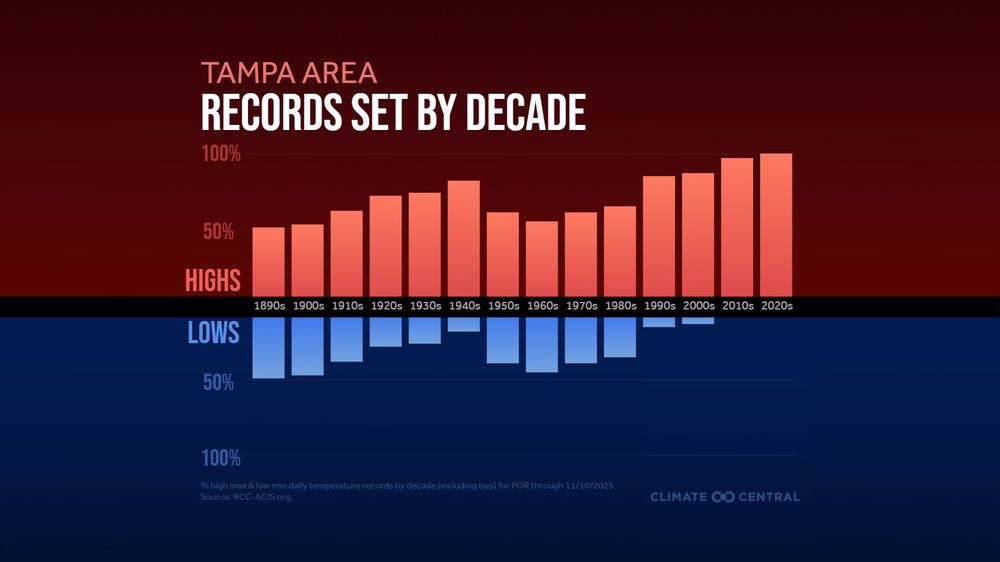
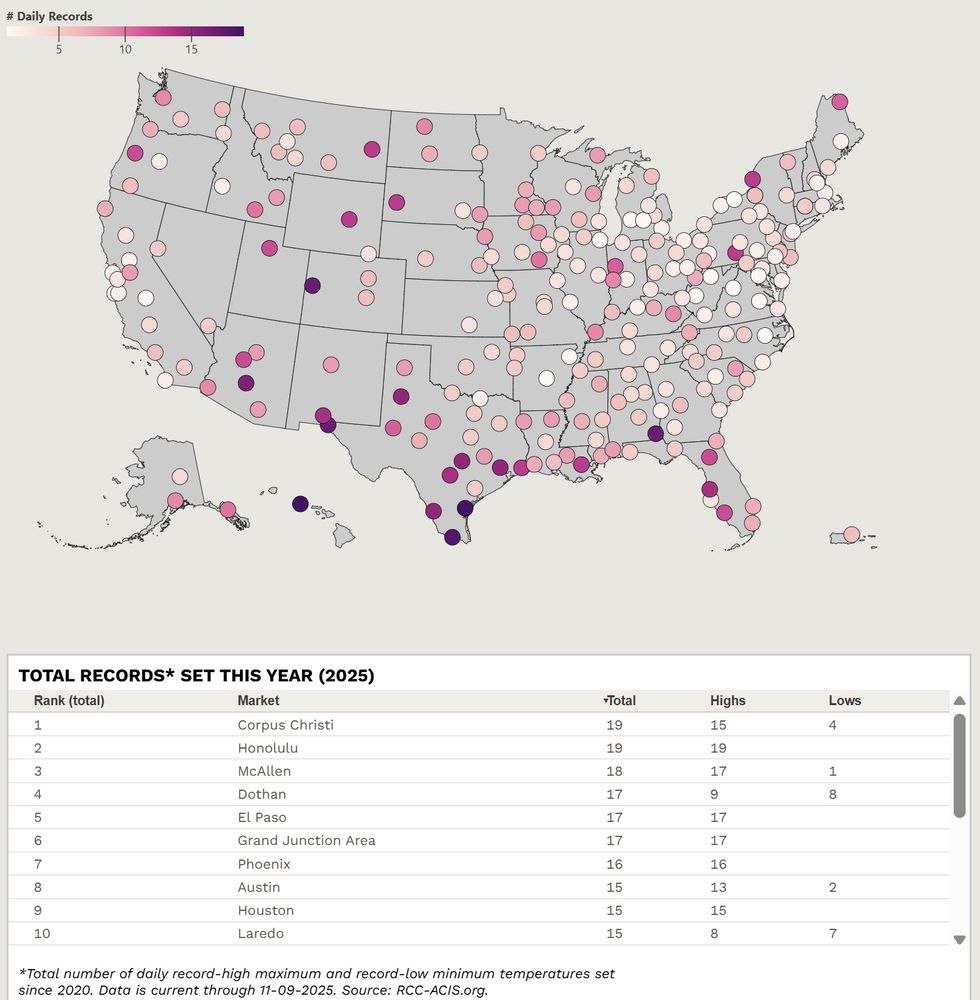
📍Let's use Tampa, Florida, as an example:
1990s — 170 records (85% highs, 15% lows)
2000s — 60 records (87% highs, 13% lows)
2010s — 143 records (97% highs, 3% lows)
2020s — 128 records so far (100% highs)
Today was the FIRST record low temperature recorded here since 2020
1990s — 170 records (85% highs, 15% lows)
2000s — 60 records (87% highs, 13% lows)
2010s — 143 records (97% highs, 3% lows)
2020s — 128 records so far (100% highs)
Today was the FIRST record low temperature recorded here since 2020
November 11, 2025 at 5:55 PM
📍Let's use Tampa, Florida, as an example:
1990s — 170 records (85% highs, 15% lows)
2000s — 60 records (87% highs, 13% lows)
2010s — 143 records (97% highs, 3% lows)
2020s — 128 records so far (100% highs)
Today was the FIRST record low temperature recorded here since 2020
1990s — 170 records (85% highs, 15% lows)
2000s — 60 records (87% highs, 13% lows)
2010s — 143 records (97% highs, 3% lows)
2020s — 128 records so far (100% highs)
Today was the FIRST record low temperature recorded here since 2020
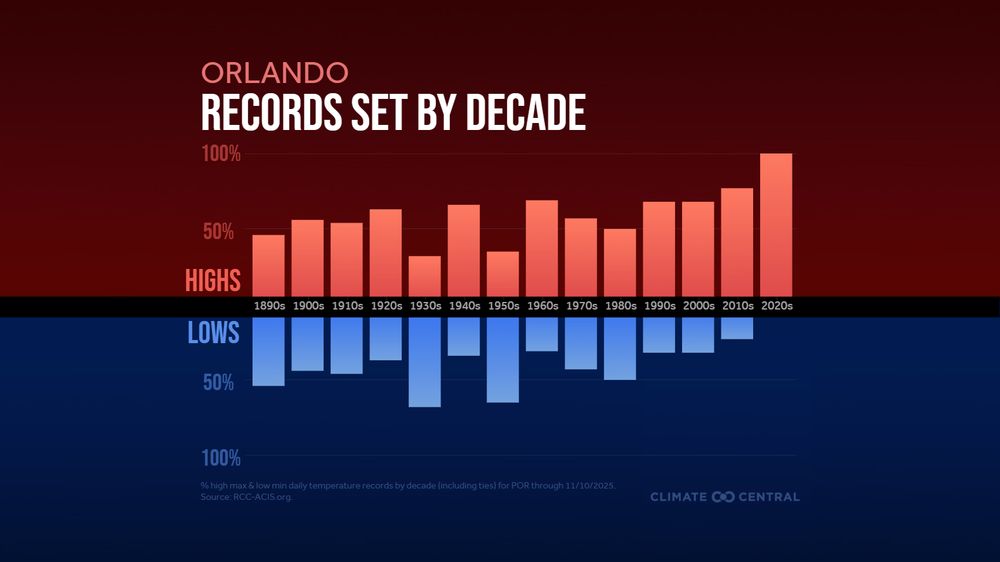
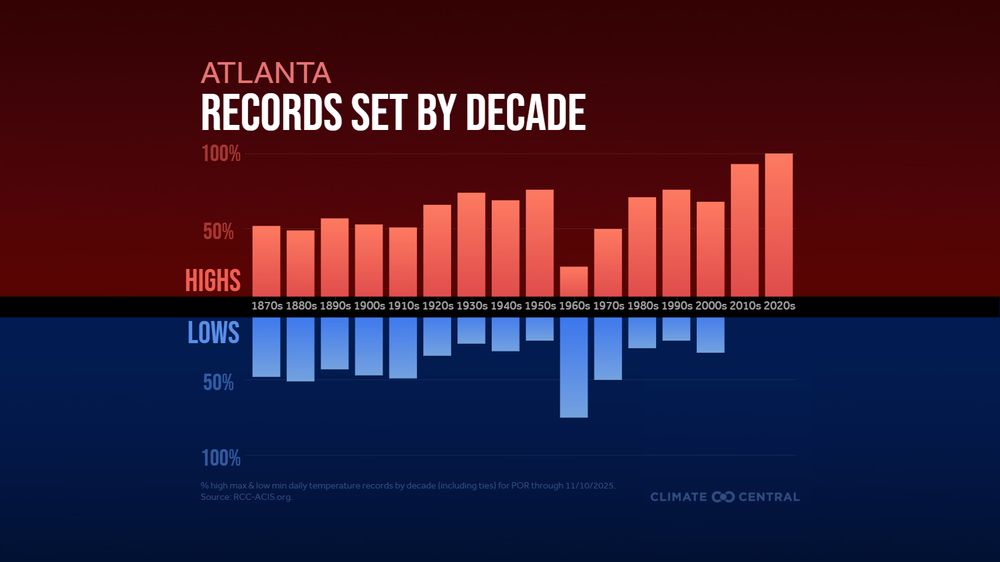
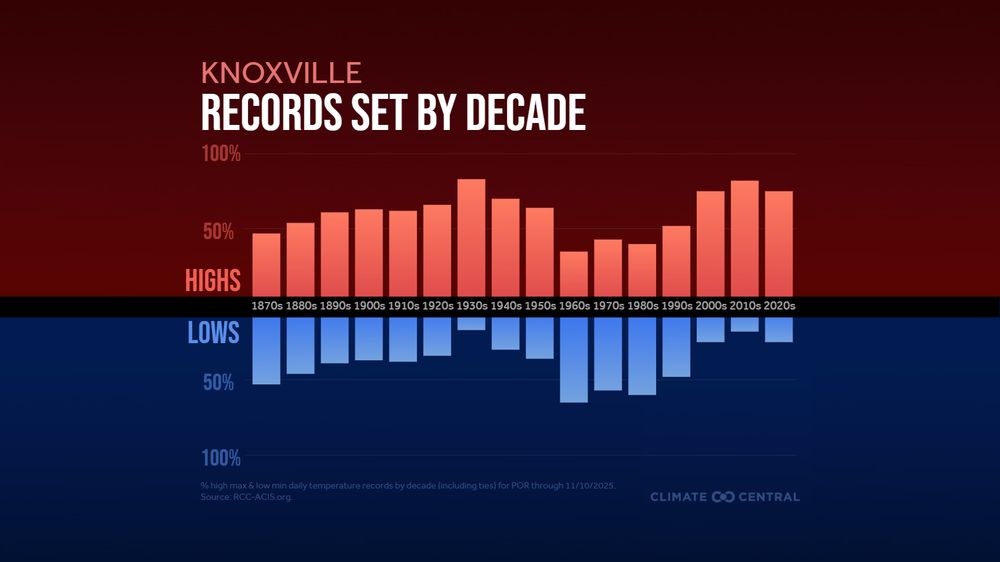
Here’s a big, key reminder: even in a warming world, cold still happens.
But thanks to heat-trapping pollution, record temperatures aren’t balanced anymore.
Short of the long: Record HEAT is FAR OUTPACING record cold
But thanks to heat-trapping pollution, record temperatures aren’t balanced anymore.
Short of the long: Record HEAT is FAR OUTPACING record cold
November 11, 2025 at 5:55 PM
Here’s a big, key reminder: even in a warming world, cold still happens.
But thanks to heat-trapping pollution, record temperatures aren’t balanced anymore.
Short of the long: Record HEAT is FAR OUTPACING record cold
But thanks to heat-trapping pollution, record temperatures aren’t balanced anymore.
Short of the long: Record HEAT is FAR OUTPACING record cold
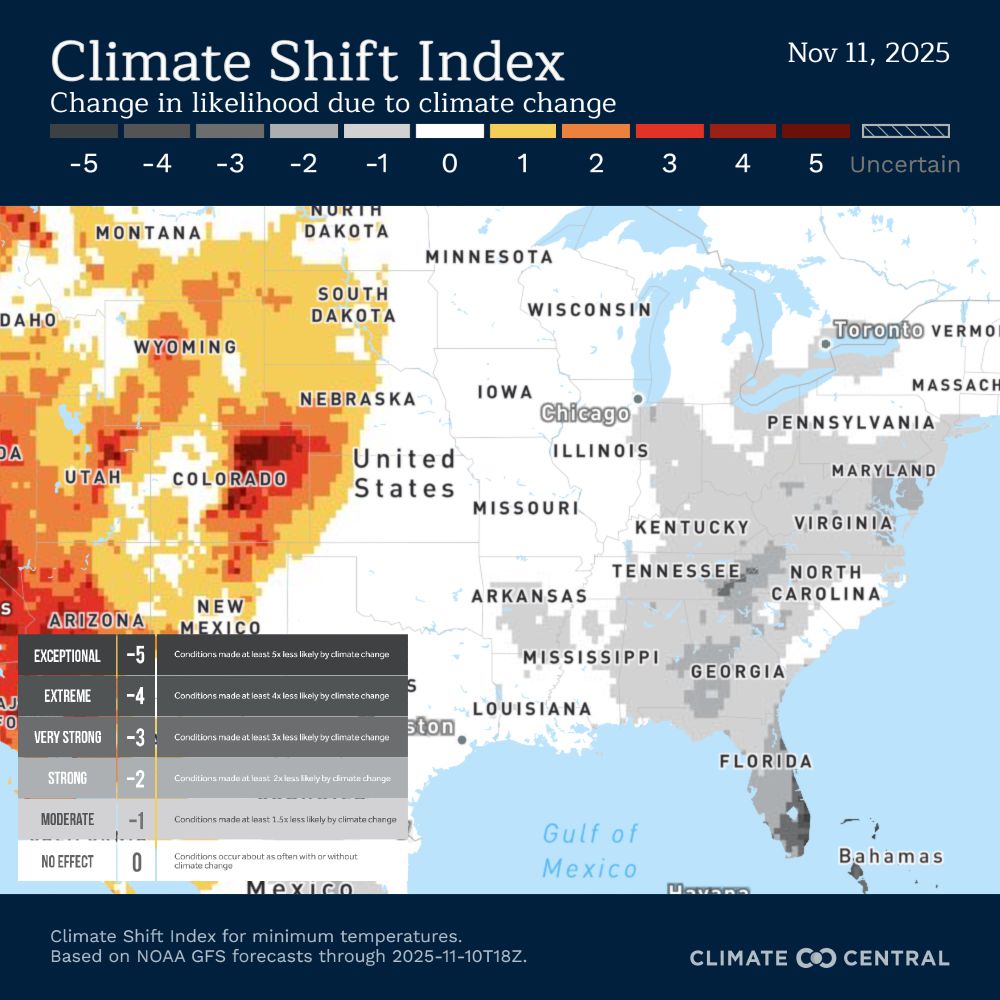
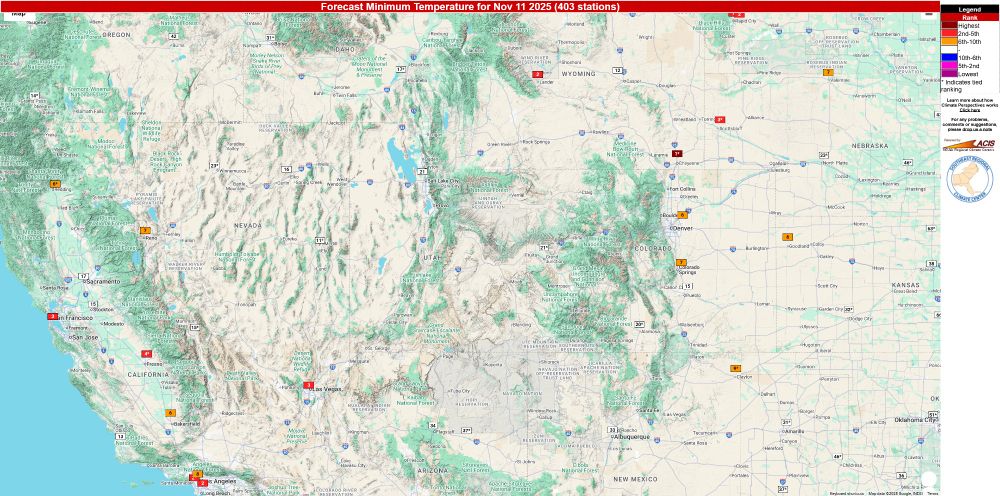
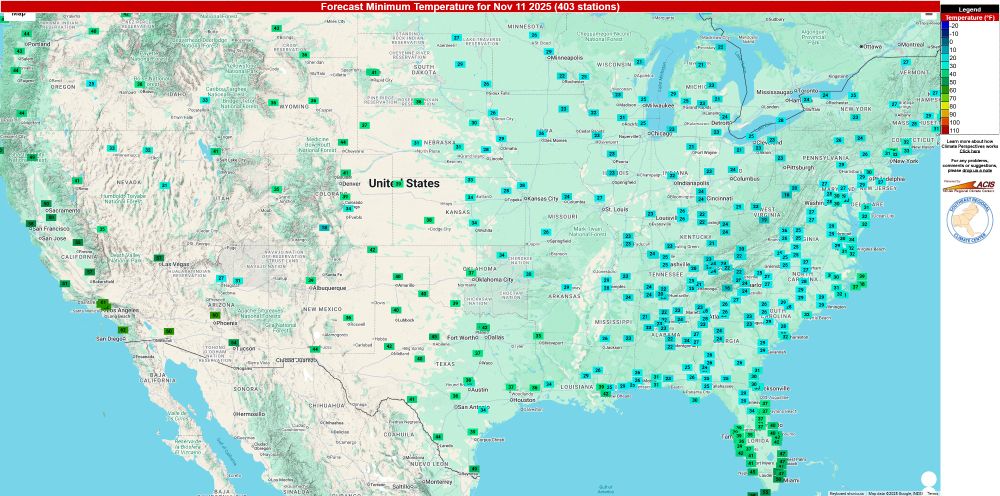
🔵Let's head east:
Big coats were a must with temperatures 15°-25° colder than average...among the coldest, if not record-setting, for Nov. 11 mornings of record.
This kind of early winter cold? Not impossible,it’s becoming less likely as we continue to warm the planet
Big coats were a must with temperatures 15°-25° colder than average...among the coldest, if not record-setting, for Nov. 11 mornings of record.
This kind of early winter cold? Not impossible,it’s becoming less likely as we continue to warm the planet

November 11, 2025 at 5:55 PM
🔵Let's head east:
Big coats were a must with temperatures 15°-25° colder than average...among the coldest, if not record-setting, for Nov. 11 mornings of record.
This kind of early winter cold? Not impossible,it’s becoming less likely as we continue to warm the planet
Big coats were a must with temperatures 15°-25° colder than average...among the coldest, if not record-setting, for Nov. 11 mornings of record.
This kind of early winter cold? Not impossible,it’s becoming less likely as we continue to warm the planet
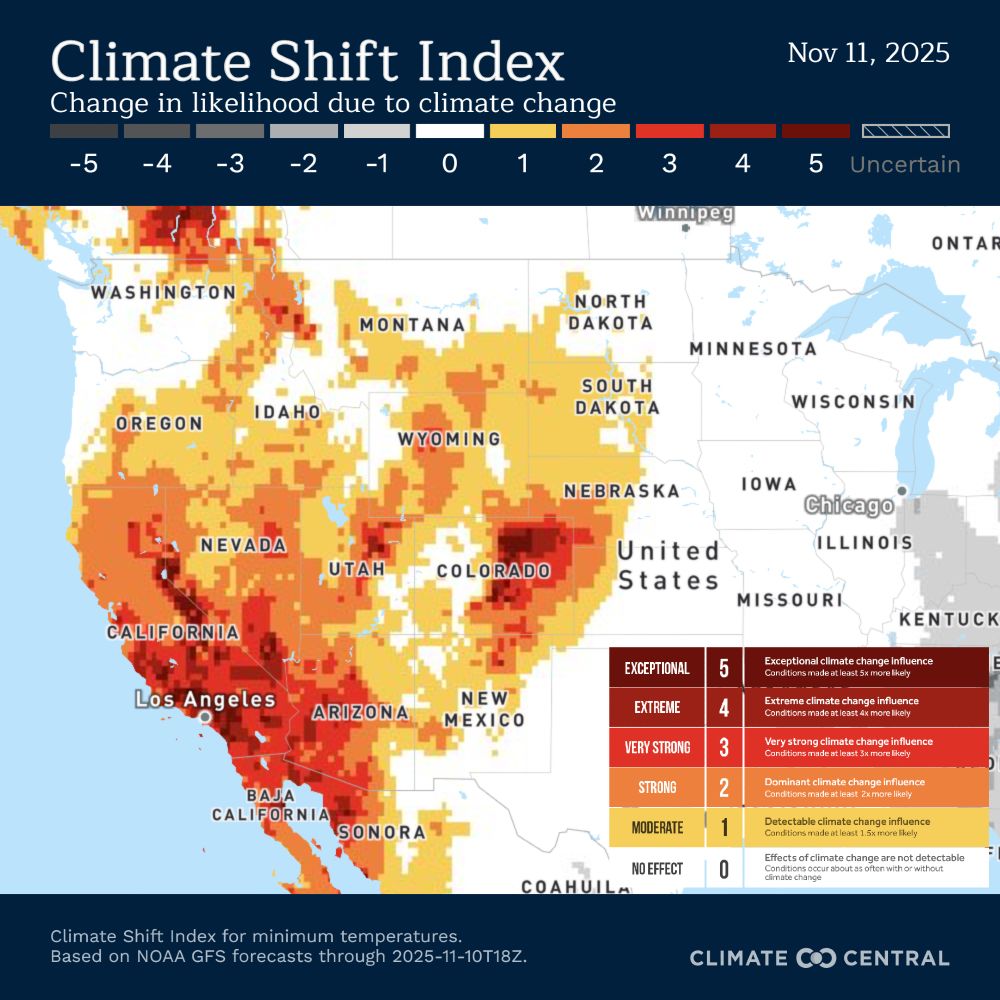
🔴Let’s start in the West:
While comfortable, many woke up to morning temps 5°–15° warmer than average...among the top 5 warmest Nov. 11 mornings on record.
This unusual warmth? Made 3–5x MORE likely by man-made climate change in cities like LA, Denver, Phoenix, and Las Vegas.
While comfortable, many woke up to morning temps 5°–15° warmer than average...among the top 5 warmest Nov. 11 mornings on record.
This unusual warmth? Made 3–5x MORE likely by man-made climate change in cities like LA, Denver, Phoenix, and Las Vegas.
November 11, 2025 at 5:55 PM
🔴Let’s start in the West:
While comfortable, many woke up to morning temps 5°–15° warmer than average...among the top 5 warmest Nov. 11 mornings on record.
This unusual warmth? Made 3–5x MORE likely by man-made climate change in cities like LA, Denver, Phoenix, and Las Vegas.
While comfortable, many woke up to morning temps 5°–15° warmer than average...among the top 5 warmest Nov. 11 mornings on record.
This unusual warmth? Made 3–5x MORE likely by man-made climate change in cities like LA, Denver, Phoenix, and Las Vegas.
The first spill of winter air made for a c-o-l-d start to Tuesday morning across much of the eastern U.S.
...but that is not the whole story. It’s split across the Lower 48 — with climate change playing a role in both the cold and the warmth.
Let's pull this thread 🧵
...but that is not the whole story. It’s split across the Lower 48 — with climate change playing a role in both the cold and the warmth.
Let's pull this thread 🧵
November 11, 2025 at 5:55 PM
The first spill of winter air made for a c-o-l-d start to Tuesday morning across much of the eastern U.S.
...but that is not the whole story. It’s split across the Lower 48 — with climate change playing a role in both the cold and the warmth.
Let's pull this thread 🧵
...but that is not the whole story. It’s split across the Lower 48 — with climate change playing a role in both the cold and the warmth.
Let's pull this thread 🧵
🌡️Want to track breaking temperature records? @climatecentral.org has a tool for that! Visualize local temperature records for 247 U.S. cities, updated daily, at the link below.
app.climatecentral.org/dataviz/loca...
app.climatecentral.org/dataviz/loca...
November 10, 2025 at 8:20 PM
🌡️Want to track breaking temperature records? @climatecentral.org has a tool for that! Visualize local temperature records for 247 U.S. cities, updated daily, at the link below.
app.climatecentral.org/dataviz/loca...
app.climatecentral.org/dataviz/loca...
FRIDAY (11/7): Several cities across Central & South Texas experienced near or all-time record heat for the date.
🔴 Climate Shift Index shows this unusual November warmth was 3–5x more likely due to human-caused climate change.
Explore the data ▶️ csi.climatecentral.org
🔴 Climate Shift Index shows this unusual November warmth was 3–5x more likely due to human-caused climate change.
Explore the data ▶️ csi.climatecentral.org

November 8, 2025 at 4:03 PM
FRIDAY (11/7): Several cities across Central & South Texas experienced near or all-time record heat for the date.
🔴 Climate Shift Index shows this unusual November warmth was 3–5x more likely due to human-caused climate change.
Explore the data ▶️ csi.climatecentral.org
🔴 Climate Shift Index shows this unusual November warmth was 3–5x more likely due to human-caused climate change.
Explore the data ▶️ csi.climatecentral.org