


Alexander Lex
@alex-lex.bsky.social
Data visualization researcher. Associate Prof of CS at the University of Utah. Lab website: https://vdl.sci.utah.edu. Co-founder of
datavisyn: https://datavisyn.io
datavisyn: https://datavisyn.io
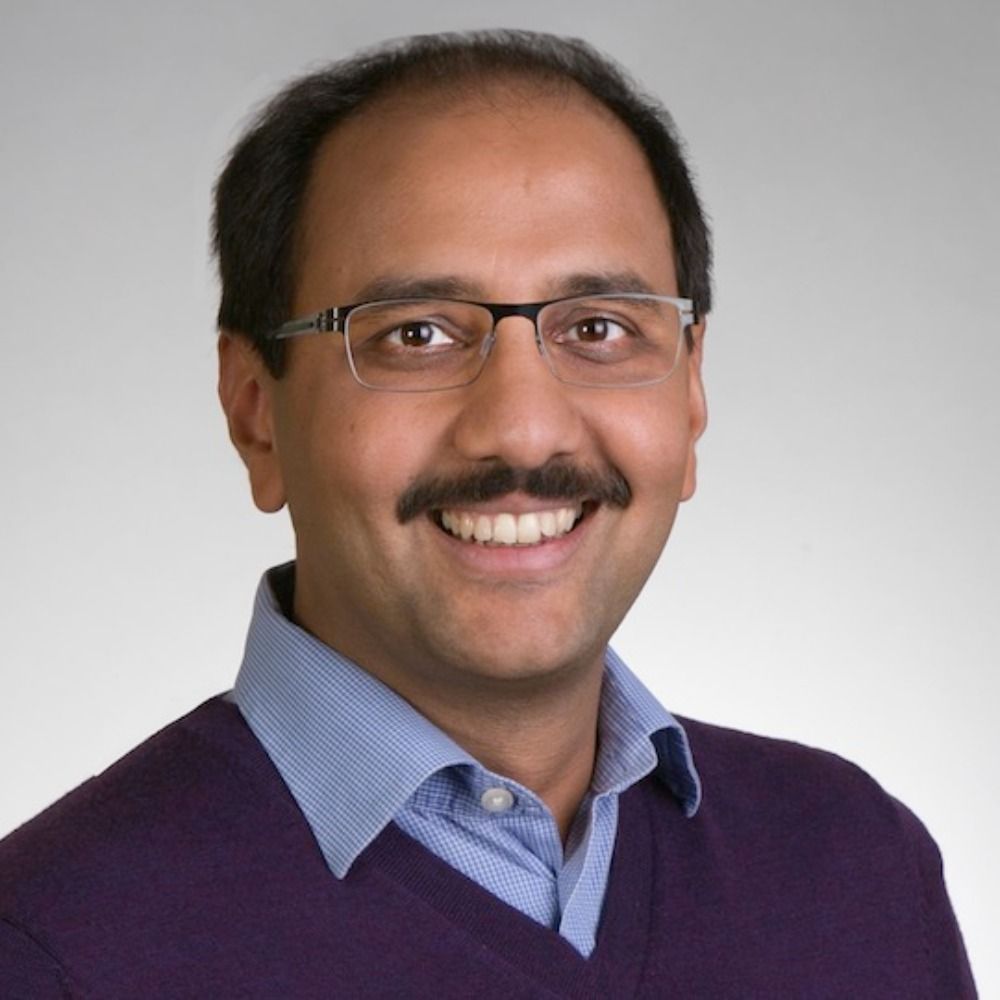
I'm excited to welcome the first member of the Visualization Design Lab @ TU Graz: Abhraneel Sarma. Abhraneel joins us as a PostDoc from Northwestern University in Chicago, where he just recently completed his PhD.

November 5, 2025 at 3:12 PM
I'm excited to welcome the first member of the Visualization Design Lab @ TU Graz: Abhraneel Sarma. Abhraneel joins us as a PostDoc from Northwestern University in Chicago, where he just recently completed his PhD.
We’re excited to announce ReVISit v2.3, along with updates from versions 2.1 and 2.2. These releases introduce major new capabilities that make it easier to design, run, and analyze visualization studies.
Check out what's new:
revisit.dev/blog/2025/10...
Check out what's new:
revisit.dev/blog/2025/10...

October 28, 2025 at 9:33 AM
We’re excited to announce ReVISit v2.3, along with updates from versions 2.1 and 2.2. These releases introduce major new capabilities that make it easier to design, run, and analyze visualization studies.
Check out what's new:
revisit.dev/blog/2025/10...
Check out what's new:
revisit.dev/blog/2025/10...
Reposted by Alexander Lex
Revisit by @laneh.bsky.social and team is an excellent option. It requires some configuration and setup, but it works beautifully and all your data stays on your server. (revisit.dev)

Home | ReVISit
reVISit: Reproducible and Powerful Visualization User Studies
revisit.dev
October 12, 2025 at 6:10 PM
Revisit by @laneh.bsky.social and team is an excellent option. It requires some configuration and setup, but it works beautifully and all your data stays on your server. (revisit.dev)
The reVISit team will be hosting an open hackathon at TU Graz in Austria, immediately after IEEE VIS from Monday November 10 to Wednesday November 13. Anyone interested in contributing to reVISit is invited to participate!

September 10, 2025 at 6:43 PM
The reVISit team will be hosting an open hackathon at TU Graz in Austria, immediately after IEEE VIS from Monday November 10 to Wednesday November 13. Anyone interested in contributing to reVISit is invited to participate!
Can 3D-printed tactile charts help blind and low-vision users understand complex visualizations? Yes, and they are a preferred learning method.
Read Tingying's blog post to see how it works and what we learned: www.visdesignlab.net/blog/2025/08...
Read Tingying's blog post to see how it works and what we learned: www.visdesignlab.net/blog/2025/08...
LinkedIn
This link will take you to a page that’s not on LinkedIn
lnkd.in
August 26, 2025 at 7:17 AM
Can 3D-printed tactile charts help blind and low-vision users understand complex visualizations? Yes, and they are a preferred learning method.
Read Tingying's blog post to see how it works and what we learned: www.visdesignlab.net/blog/2025/08...
Read Tingying's blog post to see how it works and what we learned: www.visdesignlab.net/blog/2025/08...
Reposted by Alexander Lex

My new (and old) university TU Graz interviewed me about my return to Austria. Check it out; available in English and German.
www.tugraz.at/news/artikel...
www.tugraz.at/news/artikel...
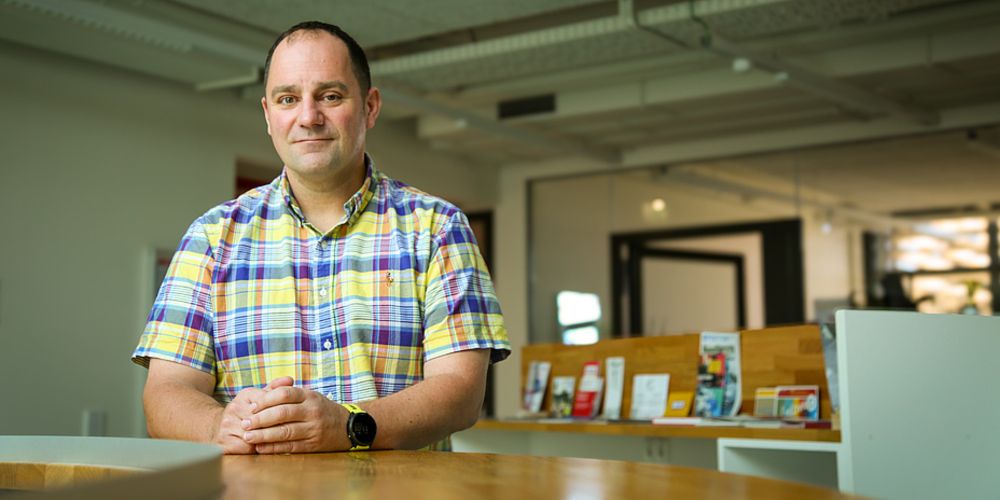
Alexander Lex: Wie können Daten besser kommuniziert werden?
Alexander Lex beschäftigt sich mit der Frage, wie sich die Interaktion zwischen Mensch und Computer verbessern lässt – insbesondere in der Visualisierung und Accessibility.
www.tugraz.at
July 30, 2025 at 11:43 AM
My new (and old) university TU Graz interviewed me about my return to Austria. Check it out; available in English and German.
www.tugraz.at/news/artikel...
www.tugraz.at/news/artikel...
Reposted by Alexander Lex

When I started @neuromadlab.bsky.social in 2017, we decided to publish all empirical papers as preprints. It helped us gain traction in the early days and avoid the kind of gate keeping of less convenient results. The benefits far outweighted any potential risk. I never regretted preprinting.

Hard to remember that just 12 years ago there was no @biorxivpreprint.bsky.social and almost no one in the biology community preprinted their work. What a long way we’ve come. @reinierprosee.bsky.social and I wrote a thing about how @biologists.bsky.social embraced the preprint world
Staying ahead of the curve: a decade of preprints in biology
When Cold Spring Harbor Laboratory announced the launch of bioRxiv in November 2013, only the braver or more radical amongst us would have predicted that it heralded a lasting change within the scienc...
journals.biologists.com
July 2, 2025 at 7:30 AM
When I started @neuromadlab.bsky.social in 2017, we decided to publish all empirical papers as preprints. It helped us gain traction in the early days and avoid the kind of gate keeping of less convenient results. The benefits far outweighted any potential risk. I never regretted preprinting.
Reposted by Alexander Lex

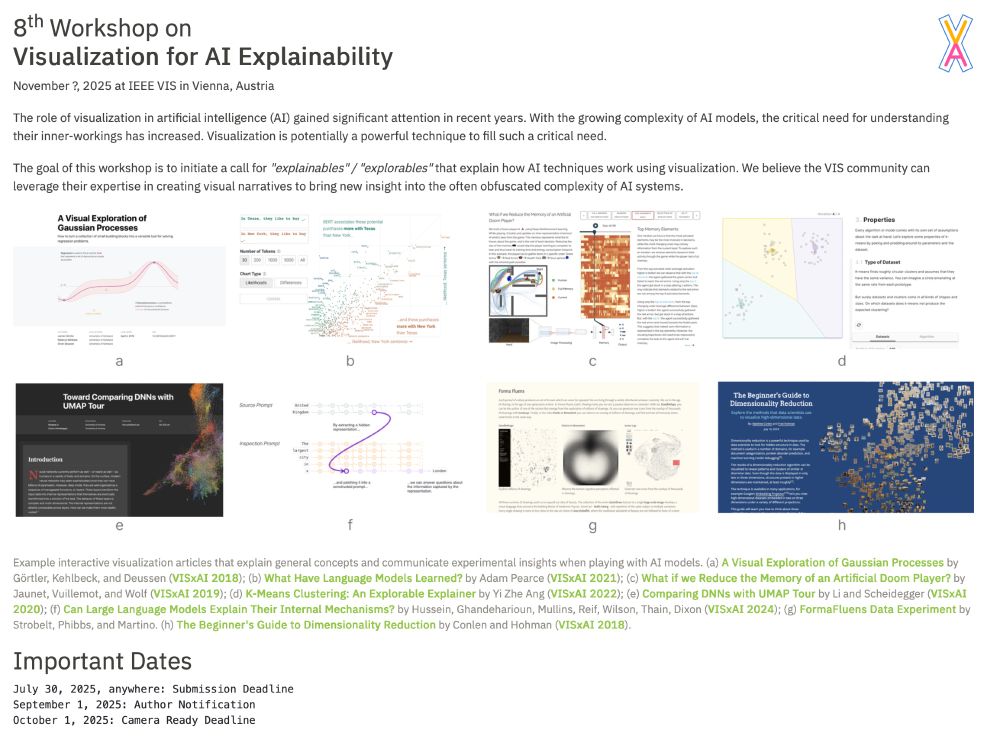
It's on! In its 8th year, the original VISxAI workshop wants your contributions for explaining ML/AI/GenAI principles. Please consider to submit.
Deadline: July 30
webpage: visxai.io
#ML #AI #GenAI #Visualization
Deadline: July 30
webpage: visxai.io
#ML #AI #GenAI #Visualization
June 11, 2025 at 2:07 PM
It's on! In its 8th year, the original VISxAI workshop wants your contributions for explaining ML/AI/GenAI principles. Please consider to submit.
Deadline: July 30
webpage: visxai.io
#ML #AI #GenAI #Visualization
Deadline: July 30
webpage: visxai.io
#ML #AI #GenAI #Visualization
Reposted by Alexander Lex

We all love upset plots (the best way to represent set data), but how do we make them accessible to everyone?
To answer this we { @maggiemccracken.bsky.social, @alex-lex.bsky.social, and others } developed a system (and ran a bunch of studies) to figure it out!
vdl.sci.utah.edu/blog/2025/06...
To answer this we { @maggiemccracken.bsky.social, @alex-lex.bsky.social, and others } developed a system (and ran a bunch of studies) to figure it out!
vdl.sci.utah.edu/blog/2025/06...
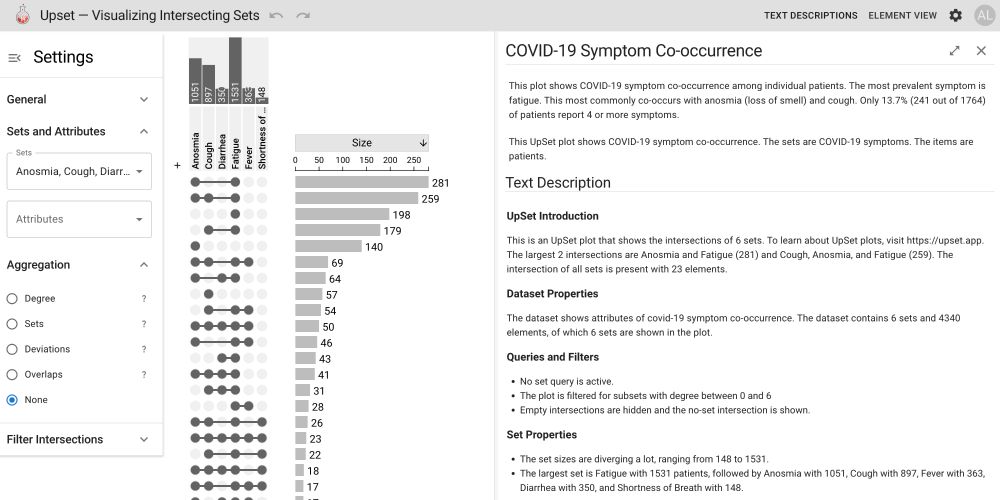
Making Data Visualizations Talk: Accessible Text Descriptions for UpSet Plots
Data visualizations in scientific journals are essential for understanding the content of an article. However, visualizations typically are inaccessible for blind or low-vision users. A common remedy ...
vdl.sci.utah.edu
June 10, 2025 at 10:23 PM
We all love upset plots (the best way to represent set data), but how do we make them accessible to everyone?
To answer this we { @maggiemccracken.bsky.social, @alex-lex.bsky.social, and others } developed a system (and ran a bunch of studies) to figure it out!
vdl.sci.utah.edu/blog/2025/06...
To answer this we { @maggiemccracken.bsky.social, @alex-lex.bsky.social, and others } developed a system (and ran a bunch of studies) to figure it out!
vdl.sci.utah.edu/blog/2025/06...
If you're at EuroVis, join us for our reVISit tutorial tomorrow at 9 to learn about how to make powerful online user studies! diglib.eg.org/items/765579...
Running Online User Studies with the reVISit Framework
There currently are two main approaches for running online user studies: experimenters can use commercial survey tools, which are easy to use but can be costly, hamper reproducibility, and have limita...
diglib.eg.org
June 4, 2025 at 9:58 AM
If you're at EuroVis, join us for our reVISit tutorial tomorrow at 9 to learn about how to make powerful online user studies! diglib.eg.org/items/765579...
Reposted by Alexander Lex

~45% of US corn production is now used to make ethanol, mostly for mixing into gasoline.
That's ~13% of all US crop land already used for energy production.
Using some of the same land for solar panels would capture 50-100 times more energy per acre.
That's ~13% of all US crop land already used for energy production.
Using some of the same land for solar panels would capture 50-100 times more energy per acre.
May 9, 2025 at 2:15 PM
~45% of US corn production is now used to make ethanol, mostly for mixing into gasoline.
That's ~13% of all US crop land already used for energy production.
Using some of the same land for solar panels would capture 50-100 times more energy per acre.
That's ~13% of all US crop land already used for energy production.
Using some of the same land for solar panels would capture 50-100 times more energy per acre.
If you're curios about how reVISit can help you run your user studies, join us for a meetup at #CHI2025 tomorrow from 9:00-10:30 in Room G218!
revisit.dev
revisit.dev
Home | ReVISit
reVISit: Reproducible and Powerful Visualization User Studies
revisit.dev
April 30, 2025 at 3:06 AM
If you're curios about how reVISit can help you run your user studies, join us for a meetup at #CHI2025 tomorrow from 9:00-10:30 in Room G218!
revisit.dev
revisit.dev
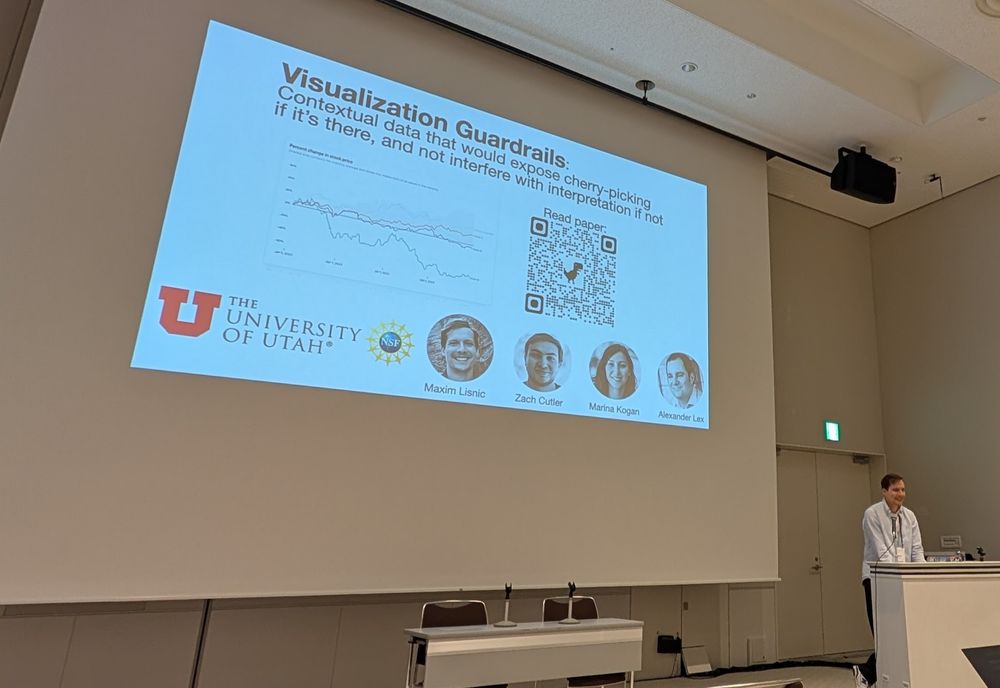
Maxim Lisnic is having a busy day presenting two #chi2025 papers on "guardrails against cherrypicking" and on "composing text in dashboard tools". Max is on the job market for PostDocs and academic positions. Talk to him if you're hiring!
vdl.sci.utah.edu/publications...
dl.acm.org/doi/10.1145/...
vdl.sci.utah.edu/publications...
dl.acm.org/doi/10.1145/...
April 29, 2025 at 3:21 AM
Maxim Lisnic is having a busy day presenting two #chi2025 papers on "guardrails against cherrypicking" and on "composing text in dashboard tools". Max is on the job market for PostDocs and academic positions. Talk to him if you're hiring!
vdl.sci.utah.edu/publications...
dl.acm.org/doi/10.1145/...
vdl.sci.utah.edu/publications...
dl.acm.org/doi/10.1145/...
Reposted by Alexander Lex

good vis design is a lot harder an optimization problem than the data-ink ratio makes it seem, and talking about it as if it were that simple has misled many people into confidently creating bad charts, including Tufte
April 23, 2025 at 5:55 PM
good vis design is a lot harder an optimization problem than the data-ink ratio makes it seem, and talking about it as if it were that simple has misled many people into confidently creating bad charts, including Tufte
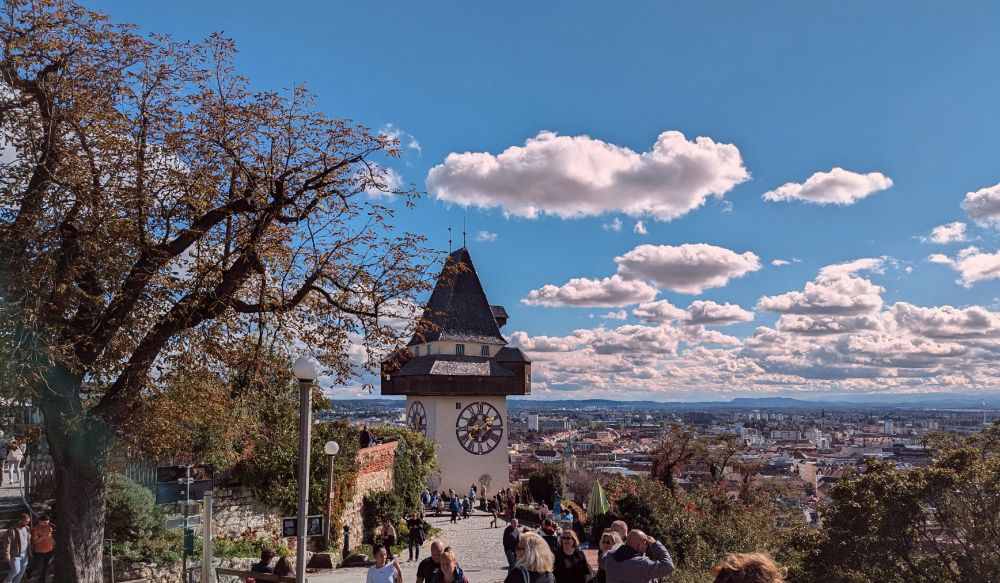
After an incredible decade at the University of Utah, I’m happy to share that I’ll be returning to my alma mater, TU Graz, this fall as a Professor of Human-Computer Interaction.
I’ll be hiring a PhD student and a PostDoc in Graz—if you're interested in HCI and visualization get in touch!
I’ll be hiring a PhD student and a PostDoc in Graz—if you're interested in HCI and visualization get in touch!
April 23, 2025 at 2:55 PM
After an incredible decade at the University of Utah, I’m happy to share that I’ll be returning to my alma mater, TU Graz, this fall as a Professor of Human-Computer Interaction.
I’ll be hiring a PhD student and a PostDoc in Graz—if you're interested in HCI and visualization get in touch!
I’ll be hiring a PhD student and a PostDoc in Graz—if you're interested in HCI and visualization get in touch!
Check out SCI's contributions to #CHI2025 this year, including two papers and a course from our lab.
Can guardrails mitigate cherry picking in data explorers?
vdl.sci.utah.edu/publications...
Can you do Think Aloud studies on crowdsourced platforms?
vdl.sci.utah.edu/publications...
Can guardrails mitigate cherry picking in data explorers?
vdl.sci.utah.edu/publications...
Can you do Think Aloud studies on crowdsourced platforms?
vdl.sci.utah.edu/publications...

SCI has a growing presence at @chi.acm.org, the top conference on human-computer interaction. Our #CHI2025 contributions: 4 papers, 1 of which won hon. mention (kudos to @mcnuttandrew.bsky.social), along with a course & a paper in the boundary-pushing alt.chi forum.
www.sci.utah.edu/the-institut...
www.sci.utah.edu/the-institut...

SCI Marks One of Its Biggest Presences at Top Conference on Human-Computer Interaction
www.sci.utah.edu
April 23, 2025 at 1:10 PM
Check out SCI's contributions to #CHI2025 this year, including two papers and a course from our lab.
Can guardrails mitigate cherry picking in data explorers?
vdl.sci.utah.edu/publications...
Can you do Think Aloud studies on crowdsourced platforms?
vdl.sci.utah.edu/publications...
Can guardrails mitigate cherry picking in data explorers?
vdl.sci.utah.edu/publications...
Can you do Think Aloud studies on crowdsourced platforms?
vdl.sci.utah.edu/publications...
Going to #CHI2025 in Japan? Interested in running user studies?
Sign up for our virtual CHI 2025 course that teaches you how to use reVISit, a new, open-source user study tool reducing the tedium of study design. Come learn through some practical examples.
cvent.me/g5mx2w
revisit.dev
Sign up for our virtual CHI 2025 course that teaches you how to use reVISit, a new, open-source user study tool reducing the tedium of study design. Come learn through some practical examples.
cvent.me/g5mx2w
revisit.dev
April 11, 2025 at 2:02 PM
Going to #CHI2025 in Japan? Interested in running user studies?
Sign up for our virtual CHI 2025 course that teaches you how to use reVISit, a new, open-source user study tool reducing the tedium of study design. Come learn through some practical examples.
cvent.me/g5mx2w
revisit.dev
Sign up for our virtual CHI 2025 course that teaches you how to use reVISit, a new, open-source user study tool reducing the tedium of study design. Come learn through some practical examples.
cvent.me/g5mx2w
revisit.dev
It’s the time of the year when students accepted to graduate programs make decisions on where to go, while others might still be anxiously waiting to hear back. Unfortunately, the grad admissions process is opaque, so I’ve written a post that gives background: vdl.sci.utah.edu/blog/2025/04...

Reading Between the Lines: The US Computer Science Graduate Admission Process
It’s the time of the year that prospective graduate students have to commit to a particular computer science graduate program. Those that got multiple offers are in the envious position to be able to ...
vdl.sci.utah.edu
April 9, 2025 at 12:55 PM
It’s the time of the year when students accepted to graduate programs make decisions on where to go, while others might still be anxiously waiting to hear back. Unfortunately, the grad admissions process is opaque, so I’ve written a post that gives background: vdl.sci.utah.edu/blog/2025/04...
Reposted by Alexander Lex

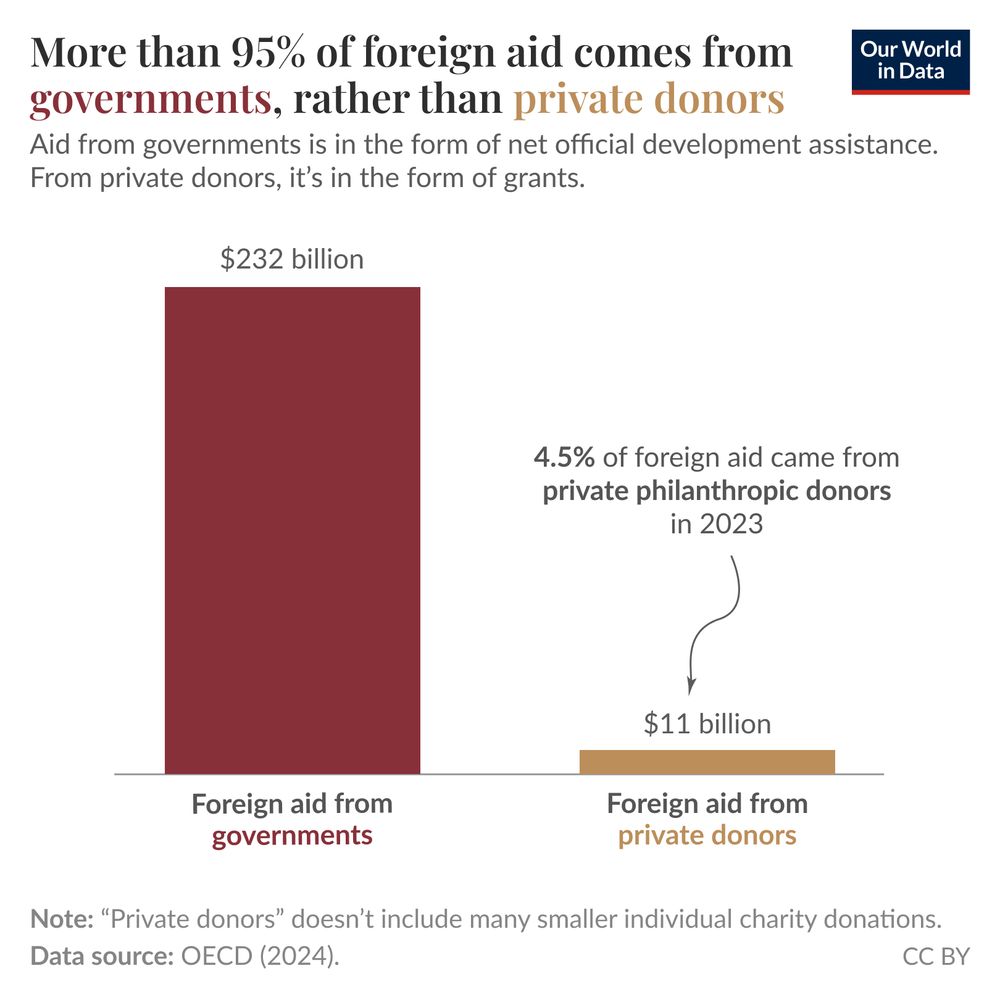
Most of the world’s foreign aid comes from governments, not philanthropic foundations
April 8, 2025 at 6:39 PM
Most of the world’s foreign aid comes from governments, not philanthropic foundations
Reposted by Alexander Lex

Tactile charts are an important tool for conveying data to blind and low vision people via embossed paper. However, tactile charts require high levels of time and expertise to design.
Introducing Tactile Vega-Lite, new work at #CHI2025 led by MIT SM student Katie Chen
news.mit.edu/2025/making-...
Introducing Tactile Vega-Lite, new work at #CHI2025 led by MIT SM student Katie Chen
news.mit.edu/2025/making-...
A new way to make graphs more accessible to blind and low-vision readers
Designed to help blind and low-vision readers understand graphics, the “Tactile Vega-Lite” system from MIT CSAIL converts data into a standard visual graph and a tactile chart. Accessibility standards...
news.mit.edu
March 31, 2025 at 6:49 PM
Tactile charts are an important tool for conveying data to blind and low vision people via embossed paper. However, tactile charts require high levels of time and expertise to design.
Introducing Tactile Vega-Lite, new work at #CHI2025 led by MIT SM student Katie Chen
news.mit.edu/2025/making-...
Introducing Tactile Vega-Lite, new work at #CHI2025 led by MIT SM student Katie Chen
news.mit.edu/2025/making-...
Can you run a think-aloud study via crowdsourcing? Yes you can! We used reVISit for running and analyzing online TA studies. And yes, online participants do actually speak, though they’re more critical than lab participants. Check out the CHI paper: vdl.sci.utah.edu/publications... #datavis #chi2025
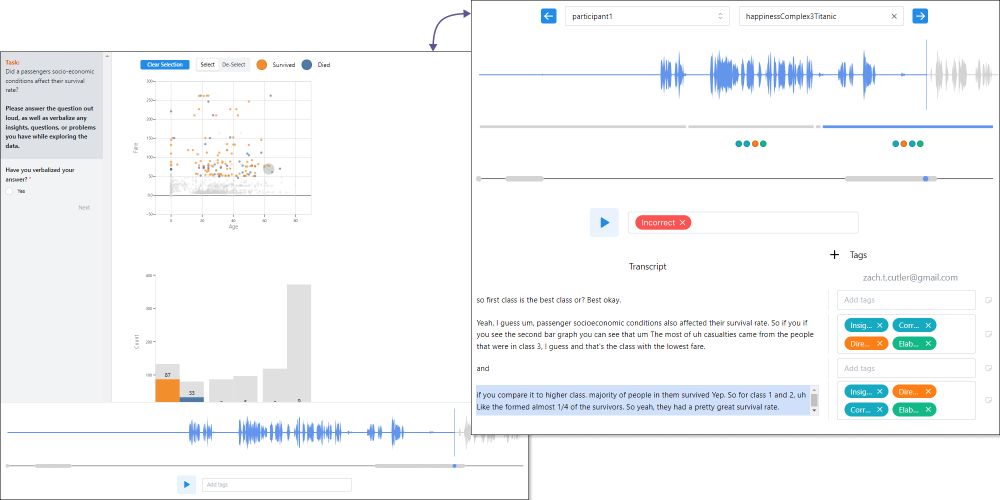
Crowdsourced Think-Aloud Studies
The think-aloud (TA) protocol is a useful method for evaluating user interfaces, including data visualizations. However, TA studies are time-consuming to conduct and hence often have a small number of...
vdl.sci.utah.edu
March 20, 2025 at 11:46 PM
Can you run a think-aloud study via crowdsourcing? Yes you can! We used reVISit for running and analyzing online TA studies. And yes, online participants do actually speak, though they’re more critical than lab participants. Check out the CHI paper: vdl.sci.utah.edu/publications... #datavis #chi2025
We're still looking for a few more participants!
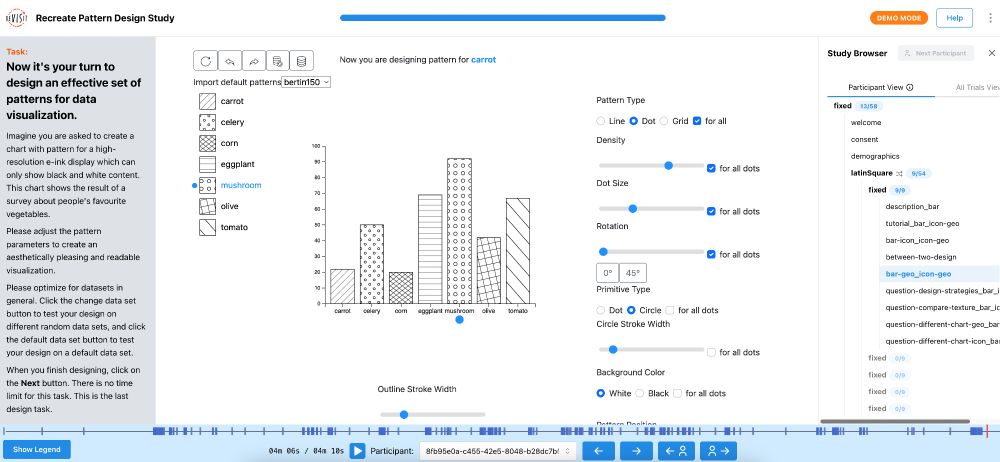
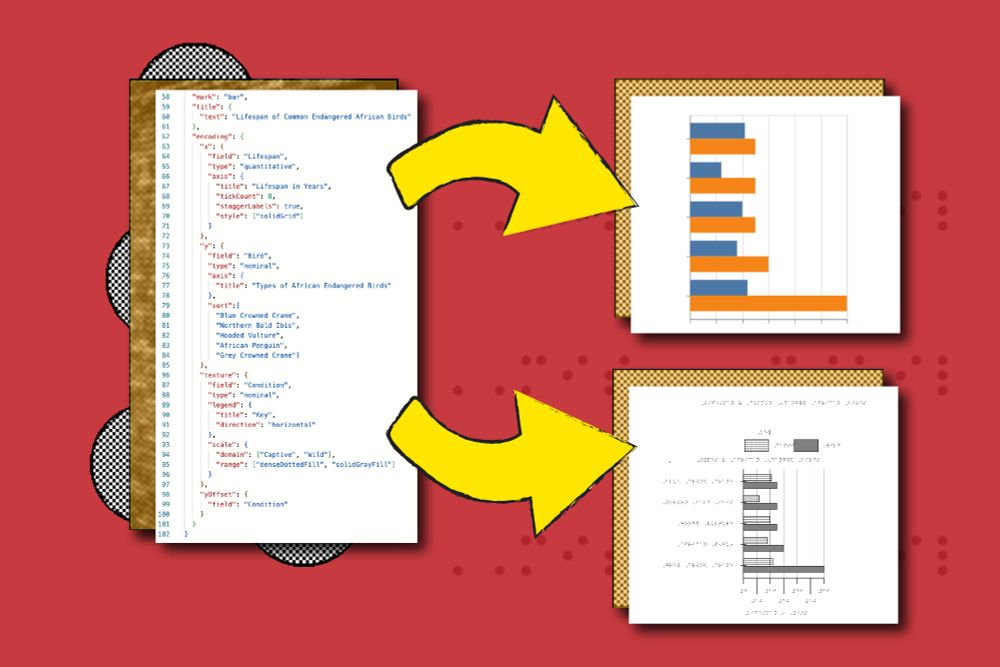
How can we use black-and-white patterns in visualization? If you have visualization design experience, we’d love your input! We’re running a short study (less than 20 minutes) where you’ll experiment with designing patterns for a chart.
Please participate here revisit.dev/replication-...
Thank you!
Please participate here revisit.dev/replication-...
Thank you!
March 20, 2025 at 2:02 AM
We're still looking for a few more participants!
Reposted by Alexander Lex

1) Cool VIS study, 2) Help our replication effort! ->
How can we use black-and-white patterns in visualization? If you have visualization design experience, we’d love your input! We’re running a short study (less than 20 minutes) where you’ll experiment with designing patterns for a chart.
Please participate here revisit.dev/replication-...
Thank you!
Please participate here revisit.dev/replication-...
Thank you!
March 19, 2025 at 2:13 PM
1) Cool VIS study, 2) Help our replication effort! ->
How can we use black-and-white patterns in visualization? If you have visualization design experience, we’d love your input! We’re running a short study (less than 20 minutes) where you’ll experiment with designing patterns for a chart.
Please participate here revisit.dev/replication-...
Thank you!
Please participate here revisit.dev/replication-...
Thank you!
March 19, 2025 at 12:45 AM
How can we use black-and-white patterns in visualization? If you have visualization design experience, we’d love your input! We’re running a short study (less than 20 minutes) where you’ll experiment with designing patterns for a chart.
Please participate here revisit.dev/replication-...
Thank you!
Please participate here revisit.dev/replication-...
Thank you!