


Aaron Besterman
@abesterman.bsky.social
Child & Adolescent Psychiatry | Psychiatric Genetics| Neurodevelopmental Disorders | Precision Medicine
October 3, 2025 at 7:22 PM
11/ Gratitude to an amazing collaborative team led by Harman Brah. @bogglerapture.bsky.social Pre-proof here: www.biologicalpsychiatryjournal.com/article/S000...
#Schizophrenia #Genetics #Psychiatry #PrecisionMedicine #MetaAnalysis
#Schizophrenia #Genetics #Psychiatry #PrecisionMedicine #MetaAnalysis
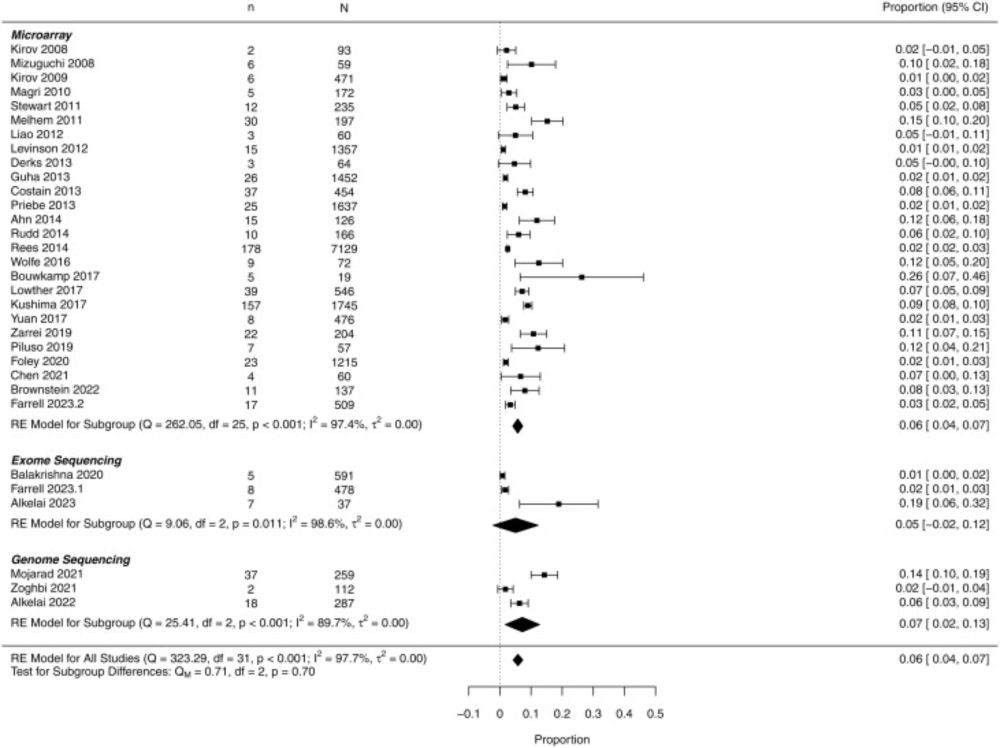
Clinical Genetic Testing in Schizophrenia: A Systematic Review and Meta-Analysis
Genetic testing may provide important diagnostic information for individuals with
schizophrenia, but the frequency with which clinically significant variants are identified
across different testing ap...
www.biologicalpsychiatryjournal.com
October 3, 2025 at 7:20 PM
11/ Gratitude to an amazing collaborative team led by Harman Brah. @bogglerapture.bsky.social Pre-proof here: www.biologicalpsychiatryjournal.com/article/S000...
#Schizophrenia #Genetics #Psychiatry #PrecisionMedicine #MetaAnalysis
#Schizophrenia #Genetics #Psychiatry #PrecisionMedicine #MetaAnalysis
10/ For clinicians: consider genetics as part of a precision psychiatry approach—useful for prognosis, medical surveillance, reproductive counseling, and occasionally treatment considerations tied to specific variants (see our table of variants with clinical implications).
October 3, 2025 at 7:20 PM
10/ For clinicians: consider genetics as part of a precision psychiatry approach—useful for prognosis, medical surveillance, reproductive counseling, and occasionally treatment considerations tied to specific variants (see our table of variants with clinical implications).
9/ What could improve yield over time: comprehensive reporting of both CNVs and SNVs, consistent ACMG/AMP interpretation, and attention to variant classes best captured by GS. As databases mature, VUS reclassification may further increase actionable returns.
October 3, 2025 at 7:20 PM
9/ What could improve yield over time: comprehensive reporting of both CNVs and SNVs, consistent ACMG/AMP interpretation, and attention to variant classes best captured by GS. As databases mature, VUS reclassification may further increase actionable returns.
8/ Clinical take-home: These data do not constitute a practice guideline, but they can inform diagnostic workups—especially for schizophrenia with NDD features or early onset—and motivate services to build genetics pathways and counseling capacity.
October 3, 2025 at 7:20 PM
8/ Clinical take-home: These data do not constitute a practice guideline, but they can inform diagnostic workups—especially for schizophrenia with NDD features or early onset—and motivate services to build genetics pathways and counseling capacity.
7/ Important caveats: substantial heterogeneity (I²≈96%), inconsistent CNV/SNV reporting across studies, and limited geographic representation (notably few data from Latin America, South Asia, Africa). The field needs better standardization and broader sampling.
October 3, 2025 at 7:20 PM
7/ Important caveats: substantial heterogeneity (I²≈96%), inconsistent CNV/SNV reporting across studies, and limited geographic representation (notably few data from Latin America, South Asia, Africa). The field needs better standardization and broader sampling.
6/ Context: The Royal College of Psychiatrists has recommended considering CMA in schizophrenia. Our pooled estimate (~6%) is higher than earlier CNV-only figures, reinforcing that genetic testing can be clinically relevant—but standards and reporting practices matter.
October 3, 2025 at 7:20 PM
6/ Context: The Royal College of Psychiatrists has recommended considering CMA in schizophrenia. Our pooled estimate (~6%) is higher than earlier CNV-only figures, reinforcing that genetic testing can be clinically relevant—but standards and reporting practices matter.
5/ Who benefits most (signal from meta-regression): higher yields in schizophrenia with co-occurring NDD features—especially intellectual disability—and earlier age of onset. These groups could be prioritized when considering clinical genetic testing.
October 3, 2025 at 7:20 PM
5/ Who benefits most (signal from meta-regression): higher yields in schizophrenia with co-occurring NDD features—especially intellectual disability—and earlier age of onset. These groups could be prioritized when considering clinical genetic testing.
4/ Key result: ~6% pooled diagnostic yield (95% CI 4–7%).
By platform: CMA ~6%, ES ~5%, GS ~7%. (Note: confidence intervals overlap; study methods & reporting varied.) This suggests ~1 in 17 patients may receive clinically informative findings.
By platform: CMA ~6%, ES ~5%, GS ~7%. (Note: confidence intervals overlap; study methods & reporting varied.) This suggests ~1 in 17 patients may receive clinically informative findings.
October 3, 2025 at 7:20 PM
4/ Key result: ~6% pooled diagnostic yield (95% CI 4–7%).
By platform: CMA ~6%, ES ~5%, GS ~7%. (Note: confidence intervals overlap; study methods & reporting varied.) This suggests ~1 in 17 patients may receive clinically informative findings.
By platform: CMA ~6%, ES ~5%, GS ~7%. (Note: confidence intervals overlap; study methods & reporting varied.) This suggests ~1 in 17 patients may receive clinically informative findings.
3/ What we did: Systematic review & random-effects meta-analysis across MEDLINE, EMBASE, and PsycINFO (2007–2023). We pooled platform-specific yields for chromosomal microarray (CMA), exome (ES), and genome sequencing (GS), and ran meta-regressions to probe heterogeneity.
October 3, 2025 at 7:20 PM
3/ What we did: Systematic review & random-effects meta-analysis across MEDLINE, EMBASE, and PsycINFO (2007–2023). We pooled platform-specific yields for chromosomal microarray (CMA), exome (ES), and genome sequencing (GS), and ran meta-regressions to probe heterogeneity.
2/ Why this matters: genetic testing is now routine in many neurodevelopmental disorders (ID, ASD, epilepsy), yet adoption in schizophrenia has lagged—due to uncertainty about yield, variable reporting, and limited genetics training in psychiatry. We tackle that evidence gap.
October 3, 2025 at 7:20 PM
2/ Why this matters: genetic testing is now routine in many neurodevelopmental disorders (ID, ASD, epilepsy), yet adoption in schizophrenia has lagged—due to uncertainty about yield, variable reporting, and limited genetics training in psychiatry. We tackle that evidence gap.
12/ SKS & PHTS families who participated
Dr. Julian Martinez-Agosto (UCLA)
@rarediseasectn.bsky.social @rarediseasesint.bsky.social
@autismspeaks.org
@simonsfoundation.org
Dr. Julian Martinez-Agosto (UCLA)
@rarediseasectn.bsky.social @rarediseasesint.bsky.social
@autismspeaks.org
@simonsfoundation.org
Home | Developmental Synaptopathies Consortium
Developmental Synaptopathies Consortium works to improve the lives of patients and families affected by developmental synaptopathies.
dsc.rarediseasesnetwork.org
August 28, 2025 at 5:32 AM
12/ SKS & PHTS families who participated
Dr. Julian Martinez-Agosto (UCLA)
@rarediseasectn.bsky.social @rarediseasesint.bsky.social
@autismspeaks.org
@simonsfoundation.org
Dr. Julian Martinez-Agosto (UCLA)
@rarediseasectn.bsky.social @rarediseasesint.bsky.social
@autismspeaks.org
@simonsfoundation.org
11/🏁 Takeaway:
Sensory profiles may provide a window into genetic pathogenicity across OGIDs, but variant scores alone aren’t robust prognostic tools.
Individualized neurobehavioral assessment remains essential for diagnosis, prognosis, and intervention planning.
Sensory profiles may provide a window into genetic pathogenicity across OGIDs, but variant scores alone aren’t robust prognostic tools.
Individualized neurobehavioral assessment remains essential for diagnosis, prognosis, and intervention planning.
August 28, 2025 at 5:32 AM
11/🏁 Takeaway:
Sensory profiles may provide a window into genetic pathogenicity across OGIDs, but variant scores alone aren’t robust prognostic tools.
Individualized neurobehavioral assessment remains essential for diagnosis, prognosis, and intervention planning.
Sensory profiles may provide a window into genetic pathogenicity across OGIDs, but variant scores alone aren’t robust prognostic tools.
Individualized neurobehavioral assessment remains essential for diagnosis, prognosis, and intervention planning.
10/🧩 Clinical classification:
Decision tree using behavioral + medical features (e.g., neonatal teeth for PHTS) performed above chance (CV relative error ≈0.67).
Behavioral-only tree also above chance, showing the strength of detailed phenotyping.
Decision tree using behavioral + medical features (e.g., neonatal teeth for PHTS) performed above chance (CV relative error ≈0.67).
Behavioral-only tree also above chance, showing the strength of detailed phenotyping.
August 28, 2025 at 5:32 AM
10/🧩 Clinical classification:
Decision tree using behavioral + medical features (e.g., neonatal teeth for PHTS) performed above chance (CV relative error ≈0.67).
Behavioral-only tree also above chance, showing the strength of detailed phenotyping.
Decision tree using behavioral + medical features (e.g., neonatal teeth for PHTS) performed above chance (CV relative error ≈0.67).
Behavioral-only tree also above chance, showing the strength of detailed phenotyping.
9/Combined OGIDs (SKS + PTEN + PI3K–AKT–MTOR SFARI genes):
• CADD ↗ SSP Low Energy & SSP Total
• CADD ↘ SRS-2 Total T
These were the most consistently stable correlations after 1,000 bootstrap resamples.
• CADD ↗ SSP Low Energy & SSP Total
• CADD ↘ SRS-2 Total T
These were the most consistently stable correlations after 1,000 bootstrap resamples.
August 28, 2025 at 5:32 AM
9/Combined OGIDs (SKS + PTEN + PI3K–AKT–MTOR SFARI genes):
• CADD ↗ SSP Low Energy & SSP Total
• CADD ↘ SRS-2 Total T
These were the most consistently stable correlations after 1,000 bootstrap resamples.
• CADD ↗ SSP Low Energy & SSP Total
• CADD ↘ SRS-2 Total T
These were the most consistently stable correlations after 1,000 bootstrap resamples.
8/ PTEN-specific:
• CADD ↗ SSP Low Energy (r=0.72)
• CADD ↘ SRS-2 Total T (r=−0.64)
(both bootstrap-stable; p<0.05 uncorrected)
• CADD ↗ SSP Low Energy (r=0.72)
• CADD ↘ SRS-2 Total T (r=−0.64)
(both bootstrap-stable; p<0.05 uncorrected)
August 28, 2025 at 5:32 AM
8/ PTEN-specific:
• CADD ↗ SSP Low Energy (r=0.72)
• CADD ↘ SRS-2 Total T (r=−0.64)
(both bootstrap-stable; p<0.05 uncorrected)
• CADD ↗ SSP Low Energy (r=0.72)
• CADD ↘ SRS-2 Total T (r=−0.64)
(both bootstrap-stable; p<0.05 uncorrected)
7/SKS-specific (missense only):
• REVEL ↗ SSP Auditory Filtering (r=0.77)
• AlphaMissense ↗ SSP Visual/Auditory Sensitivity (r=0.74)
• REVEL ↘ DCDQ Control During Movement (r=−0.80)
(all bootstrap-supported; p<0.05 uncorrected)
• REVEL ↗ SSP Auditory Filtering (r=0.77)
• AlphaMissense ↗ SSP Visual/Auditory Sensitivity (r=0.74)
• REVEL ↘ DCDQ Control During Movement (r=−0.80)
(all bootstrap-supported; p<0.05 uncorrected)
August 28, 2025 at 5:32 AM
7/SKS-specific (missense only):
• REVEL ↗ SSP Auditory Filtering (r=0.77)
• AlphaMissense ↗ SSP Visual/Auditory Sensitivity (r=0.74)
• REVEL ↘ DCDQ Control During Movement (r=−0.80)
(all bootstrap-supported; p<0.05 uncorrected)
• REVEL ↗ SSP Auditory Filtering (r=0.77)
• AlphaMissense ↗ SSP Visual/Auditory Sensitivity (r=0.74)
• REVEL ↘ DCDQ Control During Movement (r=−0.80)
(all bootstrap-supported; p<0.05 uncorrected)
6/🧬 Pathogenicity scores overall:
Cross-cohort correlations were limited/inconsistent.
CADD showed the most stable associations—especially with sensory processing—supporting the need for deep phenotyping beyond variant scores alone.
Cross-cohort correlations were limited/inconsistent.
CADD showed the most stable associations—especially with sensory processing—supporting the need for deep phenotyping beyond variant scores alone.
August 28, 2025 at 5:32 AM
6/🧬 Pathogenicity scores overall:
Cross-cohort correlations were limited/inconsistent.
CADD showed the most stable associations—especially with sensory processing—supporting the need for deep phenotyping beyond variant scores alone.
Cross-cohort correlations were limited/inconsistent.
CADD showed the most stable associations—especially with sensory processing—supporting the need for deep phenotyping beyond variant scores alone.
5/🔬 Protein-domain findings:
PTEN phosphatase-domain variants → more severe social & executive deficits vs C2-domain variants.
MTOR domain differences (FAT vs PI3K) not significant (sample-size limited in SKS).
PTEN phosphatase-domain variants → more severe social & executive deficits vs C2-domain variants.
MTOR domain differences (FAT vs PI3K) not significant (sample-size limited in SKS).
August 28, 2025 at 5:32 AM
5/🔬 Protein-domain findings:
PTEN phosphatase-domain variants → more severe social & executive deficits vs C2-domain variants.
MTOR domain differences (FAT vs PI3K) not significant (sample-size limited in SKS).
PTEN phosphatase-domain variants → more severe social & executive deficits vs C2-domain variants.
MTOR domain differences (FAT vs PI3K) not significant (sample-size limited in SKS).