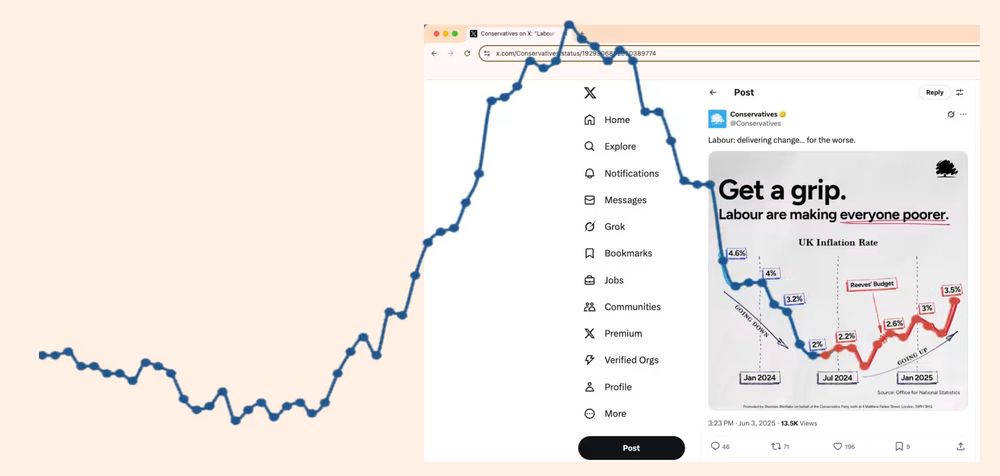
Tom Prater
@tomoprater.carbonbrief.org
2.3K followers 240 following 24 posts
Climate visuals @carbonbrief.org
Posts Media Videos Starter Packs
tomoprater.carbonbrief.org
Closing TOMORROW – it was an honour to be on the panel for the @rmets.org Weather Photographer of the Year 2025, judging entries for the 'Climate' category. From over 4,000 images, 25 have made the shortlist and are open to the public vote, closing tomorrow.

Vote: www.rmets.org/weather-phot...
Royal Meteorological Society
The Royal Meteorological Society is the Learned and Professional Society for weather and climate. Our mission is to promote the understanding and application of meteorology for the benefit of all.
www.rmets.org
Reposted by Tom Prater
tomoprater.carbonbrief.org
Thanks! I’ve been designing graphics for WWA for a while now. This was the largest increase in likelihood to date
tomoprater.carbonbrief.org
The rise, fall and rise of UK nuclear power

The green light given to Sizewell C and other small modular reactors somewhat revives the UK’s nuclear capacity after decades of decline, albeit at a lower peak than the 1990s

Streamgraph for @carbonbrief.org #dataviz
www.carbonbrief.org/chart-the-ri...
A stream graph chart showing the rise of nuclear power in the UK between 1960 and 1995, before declining in more recent years. With new investment, nuclear capacity is expected to increase again, and the chart shows a 2nd peak in the 2050s, albeit lower than in the 1990s.
Reposted by Tom Prater
tobyn.bsky.social
Politicians shouldn't rage-bait chart geeks. on.ft.com/4jrlz8h
Reposted by Tom Prater
nytweather.bsky.social
The New York Times weather team is a group of reporters and editors and designers and programmers who work with all the other departments in the newsroom to cover extreme weather and a few other things. You can follow some of us here bsky.app/starter-pack...
Reposted by Tom Prater
drsimevans.carbonbrief.org
NEW ANALYSIS: UK's solar power surges 42% to a new record, after the sunniest spring on record

* For the first time, solar was >10% of UK generation in consecutive months (April/May 2025)
* In 2025, solar has already avoided gas imports that would've cost £600m

www.carbonbrief.org/analysis-uks...
Reposted by Tom Prater
wwattribution.bsky.social
South Korea’s deadliest ever wildfires in late March were worsened by climate change 📈

Here's four charts to tell the story of our latest study, published last week.
Reposted by Tom Prater
wwattribution.bsky.social
Rapid population growth, poverty and frequent bouts of extreme rainfall are increasing the risk of catastrophic flooding in Kinshasa, the Democratic Republic of Congo’s capital city of nearly 18 million people.

Our study on the recent floods that killed at least 33 people was published today.

🧵
tomoprater.carbonbrief.org
Anyone else see a scatter piggy?
Reposted by Tom Prater
drsimevans.carbonbrief.org
📢ANALYSIS: UK emissions fell 3.6% in 2024 to lowest since 1872

🏭Coal lowest since 1666, when Great Fire ravaged London
🚗EVs pushed oil down despite more traffic, saving £1.7bn
🌇Gas down on "cleanest ever" power
📈📉Since 1990, CO2 -54% / GDP +84%

www.carbonbrief.org/...
1/9
tomoprater.carbonbrief.org
There were a lot of hexagons in this piece...

Brilliant analysis by @orladwyer.carbonbrief.org
tomoprater.carbonbrief.org
Extreme weather is destroying crops around the world, from hurricanes hitting bananas and yams in Jamaica, to drought ruining maize crops in Myanmar last year.

We mapped a global snapshot of the impacts from media reports for @carbonbrief.org

interactive.carbonbrief.org/crops-extrem... #dataviz
World map showing 100 cases where crops have been destroyed by extreme weather, such as drought, rain and flooding or storms.
tomoprater.carbonbrief.org
New attribution study by WWA finds climate change increased the likelihood of wildfire disaster in Los Angeles

Cumulative annual rainfall chart for @wwattribution.bsky.social www.worldweatherattribution.org/climate-chan... #dataviz
Line chart showing the cumulative rainfall per year in mm, from 1991 to 2024-25. Rainy winters in 2022-23 and 2023-24 were then followed by a very dry period in 2024.
Reposted by Tom Prater
tomoprater.carbonbrief.org
A forest twice the size of Greater London would need to be planted in the UK to cancel out the extra emissions from the expansion of Heathrow, Gatwick and Luton airports.

That's more than 300,000 hectares...

Chart for @carbonbrief.org www.carbonbrief.org/analysis-uk-... #dataviz
Line chart showing the increase in aviation emissions if Heathrow, Gatwick and Luton airports were expanded.
Reposted by Tom Prater
tomoprater.carbonbrief.org
A network of researchers conducted a global stocktake of measures taken by communities forced to adapt to climate change.

We analysed 1,600+ peer-reviewed articles from the data looking at where, how and by whom these measures are being taken.

interactive.carbonbrief.org/climate-adap... #dataviz
World map showing 1,600+ locations of articles looking at on-the-ground responses to climate change and adaptation measures. There are noticeable clusters on the west coast and east coast of Africa, India, Bangladesh, east coast of the US and western Europe. There are also noticeable gaps in South America and north Africa. A bar chart showing the different types of climate impacts communities are responding to. "General impacts" is top, followed by drought and precipitation/flooding A grid plot showing all the articles mentioning climate change and adaptation measures in the US. There are a total of 139 out of the 1,682 papers that forms the dataset.
Reposted by Tom Prater
erwanrivault.com
NEW: 2024 has just been confirmed as the warmest year on record, and the first to breach the 1.5C threshold.

We used a ridgeline (Joy Division inspired) chart to visualise daily temperature anomalies since 1940.

2024 clearly stands out with 100% of its days above 1.3C and 75% above 1.5C.
Ridgeline chart showing the distribution of global daily air temperature differences from the pre-industrial reference period (1850-1900), for every year between 1940 and 2024. Each individual year resembles a hill, shaded in a darker shade of red and further to the right for warmer years. The trend is clearly towards warmer years, with 2024 standing out as first year above 1.5C.
Reposted by Tom Prater
drsimevans.carbonbrief.org
NEW ANALYSIS:

Right-leaning UK newspaper editorials have relentlessly attacked energy secretary Ed Miliband since last year's election, calling him "hysterical", a "madman" & "demented"

The papers have also published a record number of editorials opposing climate action…
1/2
tomoprater.carbonbrief.org
A network of researchers conducted a global stocktake of measures taken by communities forced to adapt to climate change.

We analysed 1,600+ peer-reviewed articles from the data looking at where, how and by whom these measures are being taken.

interactive.carbonbrief.org/climate-adap... #dataviz
World map showing 1,600+ locations of articles looking at on-the-ground responses to climate change and adaptation measures. There are noticeable clusters on the west coast and east coast of Africa, India, Bangladesh, east coast of the US and western Europe. There are also noticeable gaps in South America and north Africa. A bar chart showing the different types of climate impacts communities are responding to. "General impacts" is top, followed by drought and precipitation/flooding A grid plot showing all the articles mentioning climate change and adaptation measures in the US. There are a total of 139 out of the 1,682 papers that forms the dataset.
Reposted by Tom Prater
wwattribution.bsky.social
Climate change intensified the series of five typhoons and a tropical storm that impacted the Philippines over 23 days in October and November.

Our study found that a greater number of typhoons landfalling in the country are reaching Category 3-5 levels as fossil fuel emissions heat the climate.

🧵
Reposted by Tom Prater
tomoprater.carbonbrief.org
I think if I was making this chart my initial approach would be the reverse and show "more" as darker/greater saturation and "less" as a lighter shade, as is more conventional use of colour in charts. Though you're right that those orgs often produce visuals this way
tomoprater.carbonbrief.org
This ridgeline plot and the unconventional use of shading from white to blue to indicate sea ice loss is great. It also reinforces the impression of a dense ice pack breaking up.

Chart by @janatausch.bsky.social www.ft.com/content/63fb... #dataviz
Reposted by Tom Prater
jjgoodman.bsky.social
NEW ANIMATION: China’s cumulative emissions have overtaken the EU for the first time…

…but under future projections, China’s emissions may *never* eclipse the US (despite having just a fraction of the population)

buff.ly/4hQ131z with @drsimevans.carbonbrief.org @vernerviisas.carbonbrief.org