


Prof. Michael Fuhrer
@michaelsfuhrer.bsky.social
Epidemic epistemic trespassing. Knows a lot about graphene.
Monash Uni. Directed fleet.org.au. Fellow @scienceacademy.bsky.social.
Plays bass for www.instagram.com/push_the_trigger
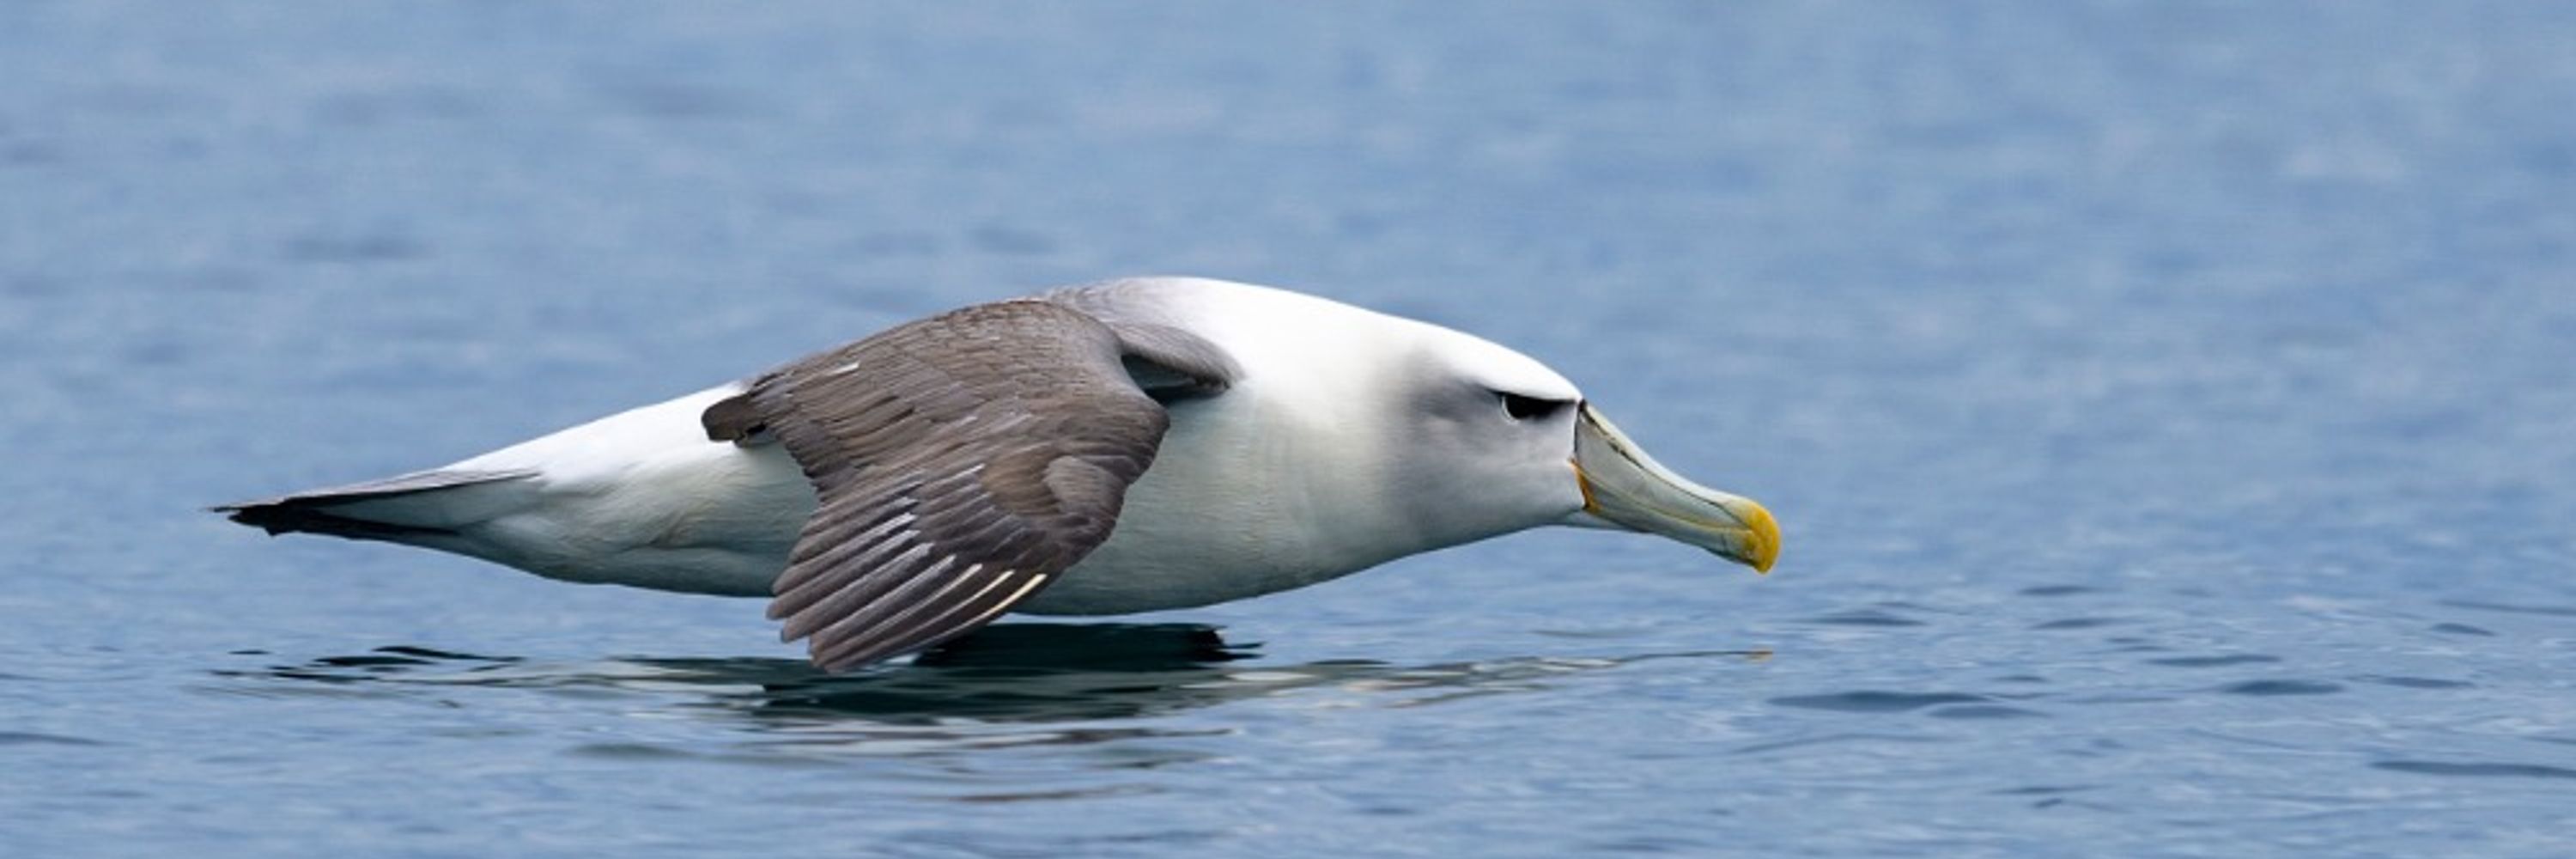
Bird photos at www.flickr.com/photos/off-world
Monash Uni. Directed fleet.org.au. Fellow @scienceacademy.bsky.social.
Plays bass for www.instagram.com/push_the_trigger
Bird photos at www.flickr.com/photos/off-world
Pinned
Part III of this deeply unpopular series! 😴💤💀
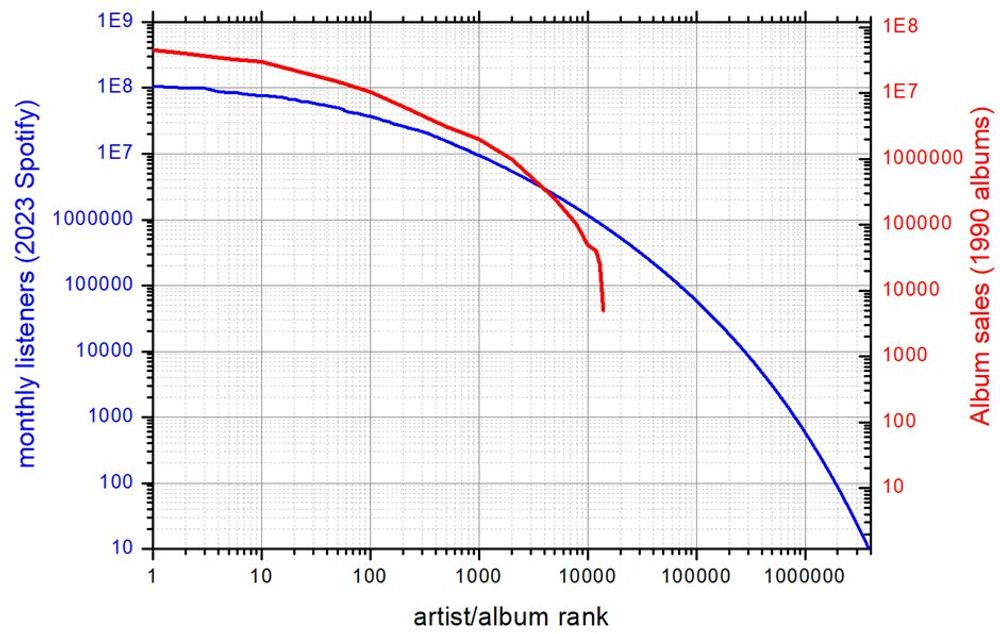
How has the music industry changed with streaming?
Last time, I looked at the distribution of revenue in the streaming industry. It’s profoundly unequal.
Today I'll argue that, unequal as it is, things are far better now than just a few years ago!
1/
How has the music industry changed with streaming?
Last time, I looked at the distribution of revenue in the streaming industry. It’s profoundly unequal.
Today I'll argue that, unequal as it is, things are far better now than just a few years ago!
1/
Reposted by Prof. Michael Fuhrer

Senator Kelly is correct.
Plus a Public Service Announcement:
KEY section of Department of Defense's Law of War Manual is 18.3.2.1.
The VERY rule on the "requirement" to refuse illegal orders gives as its paradigmatic example of what is "clearly illegal:
"orders to fire upon the shipwrecked."
Plus a Public Service Announcement:
KEY section of Department of Defense's Law of War Manual is 18.3.2.1.
The VERY rule on the "requirement" to refuse illegal orders gives as its paradigmatic example of what is "clearly illegal:
"orders to fire upon the shipwrecked."

November 30, 2025 at 4:35 PM
Senator Kelly is correct.
Plus a Public Service Announcement:
KEY section of Department of Defense's Law of War Manual is 18.3.2.1.
The VERY rule on the "requirement" to refuse illegal orders gives as its paradigmatic example of what is "clearly illegal:
"orders to fire upon the shipwrecked."
Plus a Public Service Announcement:
KEY section of Department of Defense's Law of War Manual is 18.3.2.1.
The VERY rule on the "requirement" to refuse illegal orders gives as its paradigmatic example of what is "clearly illegal:
"orders to fire upon the shipwrecked."
Reposted by Prof. Michael Fuhrer

The partisan divide has grown, too. The wealthiest 100 tended to give more to Republicans than to Democrats before last year. But giving to the GOP spiked in 2024, with *84%* of donations going to back Republicans or conservative PACs.

November 21, 2025 at 2:56 PM
The partisan divide has grown, too. The wealthiest 100 tended to give more to Republicans than to Democrats before last year. But giving to the GOP spiked in 2024, with *84%* of donations going to back Republicans or conservative PACs.
Reposted by Prof. Michael Fuhrer
Former US military lawyers speak out:
"The Former JAGs Working Group unanimously considers both the giving and the execution of these orders, if true, to constitute war crimes, murder, or both."
Statement on Media Reports of Pentagon “No Quarter” Orders in Caribbean Boat Strikes
1/2
"The Former JAGs Working Group unanimously considers both the giving and the execution of these orders, if true, to constitute war crimes, murder, or both."
Statement on Media Reports of Pentagon “No Quarter” Orders in Caribbean Boat Strikes
1/2


November 29, 2025 at 8:10 PM
Former US military lawyers speak out:
"The Former JAGs Working Group unanimously considers both the giving and the execution of these orders, if true, to constitute war crimes, murder, or both."
Statement on Media Reports of Pentagon “No Quarter” Orders in Caribbean Boat Strikes
1/2
"The Former JAGs Working Group unanimously considers both the giving and the execution of these orders, if true, to constitute war crimes, murder, or both."
Statement on Media Reports of Pentagon “No Quarter” Orders in Caribbean Boat Strikes
1/2
Reposted by Prof. Michael Fuhrer

Harvard Law School’s Jack Goldsmith:
“In short, if the Post’s facts are correct, it appears that Special Operations Forces committed murder when the ‘two men were blown apart in the water, as the Post put it.’”
open.substack.com/pub/executiv...
“In short, if the Post’s facts are correct, it appears that Special Operations Forces committed murder when the ‘two men were blown apart in the water, as the Post put it.’”
open.substack.com/pub/executiv...

November 29, 2025 at 4:25 AM
Harvard Law School’s Jack Goldsmith:
“In short, if the Post’s facts are correct, it appears that Special Operations Forces committed murder when the ‘two men were blown apart in the water, as the Post put it.’”
open.substack.com/pub/executiv...
“In short, if the Post’s facts are correct, it appears that Special Operations Forces committed murder when the ‘two men were blown apart in the water, as the Post put it.’”
open.substack.com/pub/executiv...
Rep. Seth Moulton (D-Massachusetts):
“Mark my words: It may take some time, but Americans will be prosecuted for this, either as a war crime or outright murder.”
“Mark my words: It may take some time, but Americans will be prosecuted for this, either as a war crime or outright murder.”

Exclusive: Defense Secretary Pete Hegseth gave an order to “kill everybody” in the first strike on suspected drug boats in the Caribbean. After two men survived, the mission commander ordered a second strike to comply with Hegseth’s instructions, according to two sources.

Hegseth order on first Caribbean boat strike, officials say: Kill them all
Defense Secretary Pete Hegseth issued a verbal order to kill all crew members in the Sept. 2 strike on a suspected drug boat. Navy SEALs fired a second missile.
www.washingtonpost.com
November 29, 2025 at 3:34 AM
Rep. Seth Moulton (D-Massachusetts):
“Mark my words: It may take some time, but Americans will be prosecuted for this, either as a war crime or outright murder.”
“Mark my words: It may take some time, but Americans will be prosecuted for this, either as a war crime or outright murder.”
Influenza A still going up in Victoria, Australia, at winter levels well into November (late Austral spring). Flu notifications more than 4X higher than covid in Victoria and NSW last week.
This appears to be driven by the new subclade K of A/H3N2.
www.health.vic.gov.au/infectious-d...
This appears to be driven by the new subclade K of A/H3N2.
www.health.vic.gov.au/infectious-d...

November 28, 2025 at 8:08 AM
Influenza A still going up in Victoria, Australia, at winter levels well into November (late Austral spring). Flu notifications more than 4X higher than covid in Victoria and NSW last week.
This appears to be driven by the new subclade K of A/H3N2.
www.health.vic.gov.au/infectious-d...
This appears to be driven by the new subclade K of A/H3N2.
www.health.vic.gov.au/infectious-d...
Here's why it's called a Catbird (sound on!)
Springbrook National Park, Queensland 🪶
Springbrook National Park, Queensland 🪶
November 26, 2025 at 9:11 PM
Here's why it's called a Catbird (sound on!)
Springbrook National Park, Queensland 🪶
Springbrook National Park, Queensland 🪶
Reposted by Prof. Michael Fuhrer

I am ready to go beyond implication and say after reading the facts here that one of the most recognizable people working in the White House almost certainly had ICE arrest her nephew's mother as a favor to her brother
This article heavily implies that ICE is being used in a custody dispute to help Karoline Leavitt's brother get his son and have the mother locked up in ICE detention

"A woman with a family connection to White House Press Secretary Karoline Leavitt has been arrested by Immigration and Customs Enforcement agents in Revere, Massachusetts."
www.wcvb.com/article/karo...
www.wcvb.com/article/karo...
November 26, 2025 at 5:49 AM
I am ready to go beyond implication and say after reading the facts here that one of the most recognizable people working in the White House almost certainly had ICE arrest her nephew's mother as a favor to her brother
Green Catbird.
I watched this bird for about half an hour before he got comfortable enough to come this close to me.
Seen in Springbrook National Park, Queensland 🪶
I watched this bird for about half an hour before he got comfortable enough to come this close to me.
Seen in Springbrook National Park, Queensland 🪶

November 25, 2025 at 8:29 AM
Green Catbird.
I watched this bird for about half an hour before he got comfortable enough to come this close to me.
Seen in Springbrook National Park, Queensland 🪶
I watched this bird for about half an hour before he got comfortable enough to come this close to me.
Seen in Springbrook National Park, Queensland 🪶
A beautiful dragonfly I saw up here on the Gold Coast. I believe it is a "yellow-striped flutterer" (Rhyothemis phyllis). The body has a copper sheen and it shows wonderful shiny copper reflections in flight!

November 24, 2025 at 8:12 AM
A beautiful dragonfly I saw up here on the Gold Coast. I believe it is a "yellow-striped flutterer" (Rhyothemis phyllis). The body has a copper sheen and it shows wonderful shiny copper reflections in flight!
A handsome Double-barred Finch
seen at The Spit, Gold Coast, Queensland, Australia 🪶
seen at The Spit, Gold Coast, Queensland, Australia 🪶

November 22, 2025 at 11:14 PM
A handsome Double-barred Finch
seen at The Spit, Gold Coast, Queensland, Australia 🪶
seen at The Spit, Gold Coast, Queensland, Australia 🪶
Reposted by Prof. Michael Fuhrer

This is wild.
Remember the NJ crytic lineage?
I posted 18 months ago that the Spike was too divergent to predict ACE2 binding, and asked if someone else could figure it out.
Some colleagues took me up on it.
Guess what they found?
1/
Remember the NJ crytic lineage?
I posted 18 months ago that the Spike was too divergent to predict ACE2 binding, and asked if someone else could figure it out.
Some colleagues took me up on it.
Guess what they found?
1/
November 21, 2025 at 3:19 PM
This is wild.
Remember the NJ crytic lineage?
I posted 18 months ago that the Spike was too divergent to predict ACE2 binding, and asked if someone else could figure it out.
Some colleagues took me up on it.
Guess what they found?
1/
Remember the NJ crytic lineage?
I posted 18 months ago that the Spike was too divergent to predict ACE2 binding, and asked if someone else could figure it out.
Some colleagues took me up on it.
Guess what they found?
1/
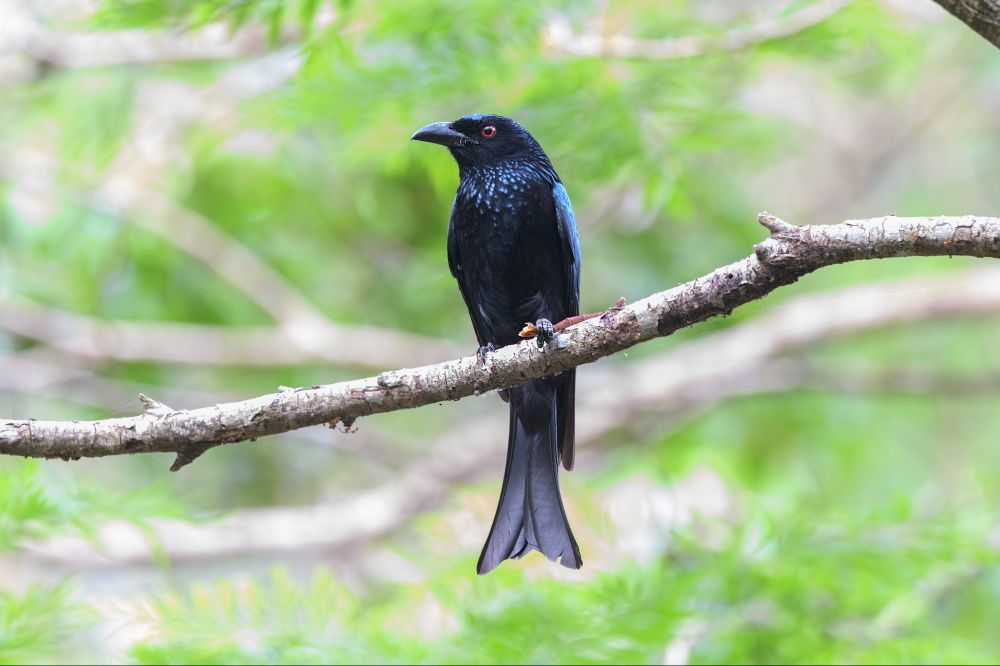
Spangled Drongo
Seen in Springbrook, Queensland, Australia 🪶
Seen in Springbrook, Queensland, Australia 🪶
November 22, 2025 at 2:19 AM
Spangled Drongo
Seen in Springbrook, Queensland, Australia 🪶
Seen in Springbrook, Queensland, Australia 🪶
Australian Logrunner, one of the few birds where the female (seen here) is more colourful than the male - she has the orange throat. 🪶
Springbrook, Queensland, Australia
Springbrook, Queensland, Australia

November 20, 2025 at 8:44 PM
Australian Logrunner, one of the few birds where the female (seen here) is more colourful than the male - she has the orange throat. 🪶
Springbrook, Queensland, Australia
Springbrook, Queensland, Australia
On the Gold Coast of Queensland this week. A chance to catch up with some birds I don't see as often.
Here's a Rainbow Bee-eater seen yesterday at The Spit (beach just north of Surfer's Paradise)
Here's a Rainbow Bee-eater seen yesterday at The Spit (beach just north of Surfer's Paradise)

November 19, 2025 at 9:24 AM
On the Gold Coast of Queensland this week. A chance to catch up with some birds I don't see as often.
Here's a Rainbow Bee-eater seen yesterday at The Spit (beach just north of Surfer's Paradise)
Here's a Rainbow Bee-eater seen yesterday at The Spit (beach just north of Surfer's Paradise)
Epstein-Barr virus reprograms autoreactive B cells as antigen-presenting cells in systemic lupus erythematosus
www.science.org/doi/10.1126/...
www.science.org/doi/10.1126/...

Epstein-Barr virus reprograms autoreactive B cells as antigen-presenting cells in systemic lupus erythematosus
Epstein-Barr virus reprograms autoreactive B cells as antigen-presenting cells to promote pathogenic antinuclear T and B cell responses in lupus.
www.science.org
November 19, 2025 at 12:11 AM
Epstein-Barr virus reprograms autoreactive B cells as antigen-presenting cells in systemic lupus erythematosus
www.science.org/doi/10.1126/...
www.science.org/doi/10.1126/...
Reposted by Prof. Michael Fuhrer

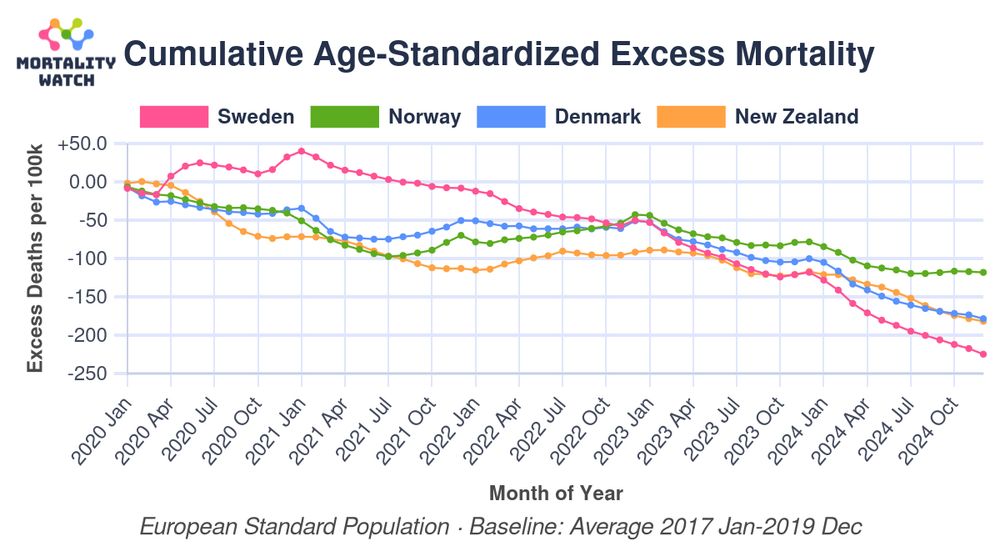
The importance of excessive mortality assumptions...
Left hand plot: 2017-19 average used as baseline. Conclusion: Sweden is 'best' with negative excess mortality.
Right hand plot: 2017-19 linear trend extrapolated as baseline. Conclusion: Sweden is 'worst' with huge positive excess mortality.
Left hand plot: 2017-19 average used as baseline. Conclusion: Sweden is 'best' with negative excess mortality.
Right hand plot: 2017-19 linear trend extrapolated as baseline. Conclusion: Sweden is 'worst' with huge positive excess mortality.

November 16, 2025 at 12:51 PM
The importance of excessive mortality assumptions...
Left hand plot: 2017-19 average used as baseline. Conclusion: Sweden is 'best' with negative excess mortality.
Right hand plot: 2017-19 linear trend extrapolated as baseline. Conclusion: Sweden is 'worst' with huge positive excess mortality.
Left hand plot: 2017-19 average used as baseline. Conclusion: Sweden is 'best' with negative excess mortality.
Right hand plot: 2017-19 linear trend extrapolated as baseline. Conclusion: Sweden is 'worst' with huge positive excess mortality.
Reposted by Prof. Michael Fuhrer

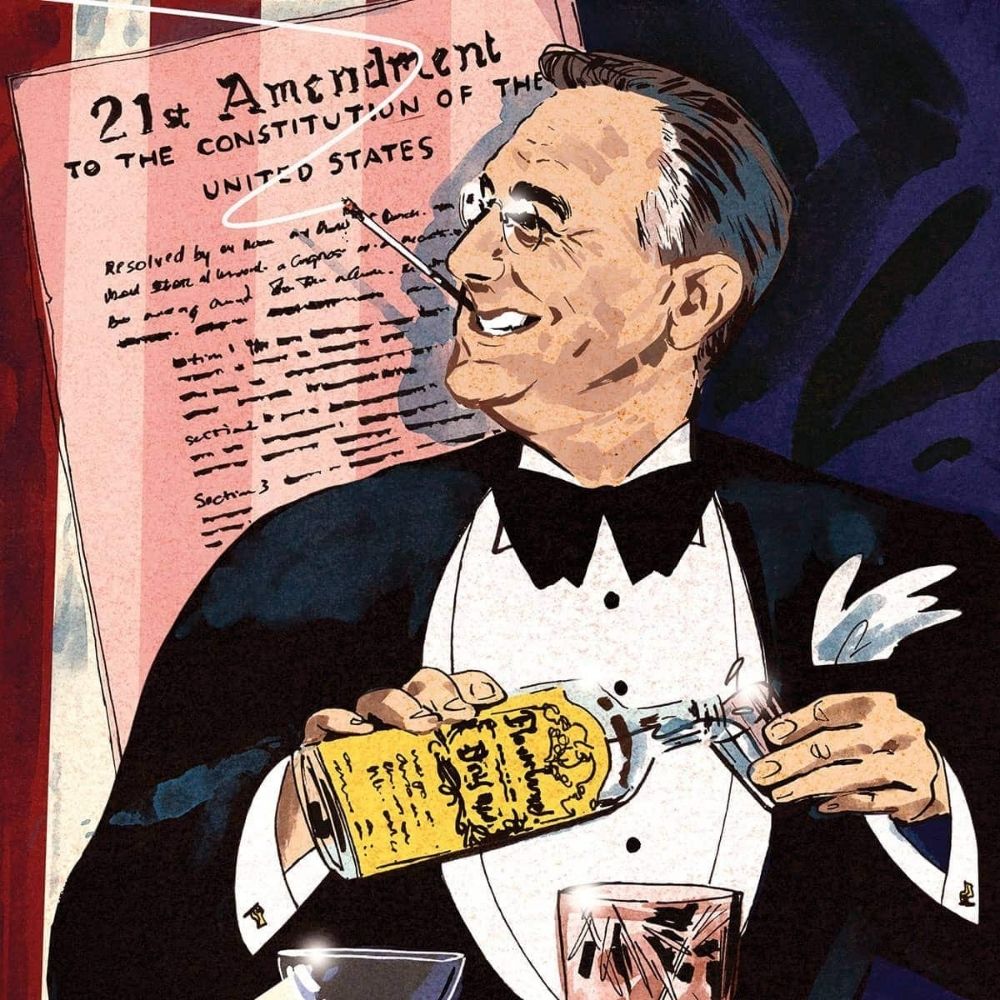
This is the 21st time I’ve posted this Doonesbury so far.

November 14, 2025 at 11:38 PM
This is the 21st time I’ve posted this Doonesbury so far.
November 15, 2025 at 7:42 PM
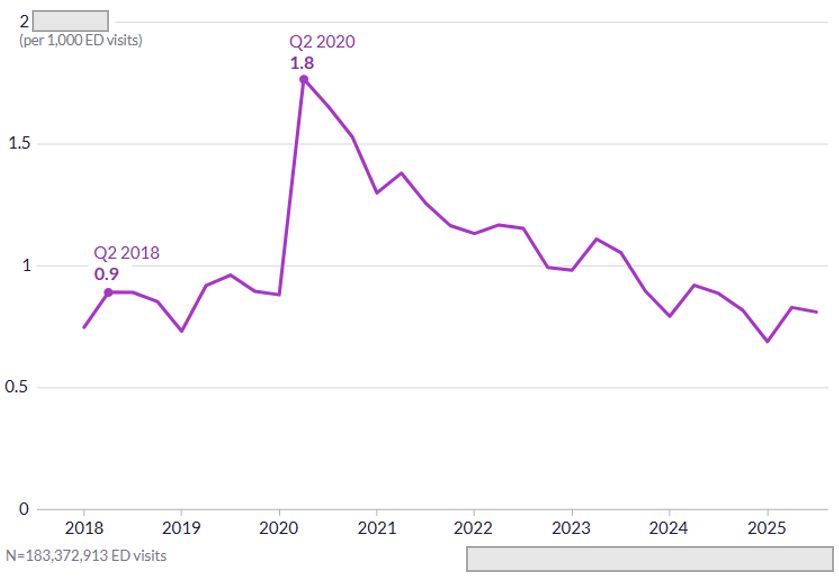
Quiz time!
This is one of the more amazing pandemic-effect graphs I've seen.
A group of diagnostic codes saw a *doubling* of incidence of emergency department visits in Q2 2020, but has since. returned to pre-pandemic levels.
QUIZ: What is that group of diagnostic codes?
This is one of the more amazing pandemic-effect graphs I've seen.
A group of diagnostic codes saw a *doubling* of incidence of emergency department visits in Q2 2020, but has since. returned to pre-pandemic levels.
QUIZ: What is that group of diagnostic codes?
November 15, 2025 at 1:32 AM
Quiz time!
This is one of the more amazing pandemic-effect graphs I've seen.
A group of diagnostic codes saw a *doubling* of incidence of emergency department visits in Q2 2020, but has since. returned to pre-pandemic levels.
QUIZ: What is that group of diagnostic codes?
This is one of the more amazing pandemic-effect graphs I've seen.
A group of diagnostic codes saw a *doubling* of incidence of emergency department visits in Q2 2020, but has since. returned to pre-pandemic levels.
QUIZ: What is that group of diagnostic codes?
Influenza A also hanging on in Victoria, Australia, with a slight upward trend in cases even into November (late spring!)
Appears to be driven by the new subclade K of A/H3N2. (Can anyone confirm with sequencing data?)
www.health.vic.gov.au/infectious-d...
Appears to be driven by the new subclade K of A/H3N2. (Can anyone confirm with sequencing data?)
www.health.vic.gov.au/infectious-d...

November 15, 2025 at 12:42 AM
Influenza A also hanging on in Victoria, Australia, with a slight upward trend in cases even into November (late spring!)
Appears to be driven by the new subclade K of A/H3N2. (Can anyone confirm with sequencing data?)
www.health.vic.gov.au/infectious-d...
Appears to be driven by the new subclade K of A/H3N2. (Can anyone confirm with sequencing data?)
www.health.vic.gov.au/infectious-d...
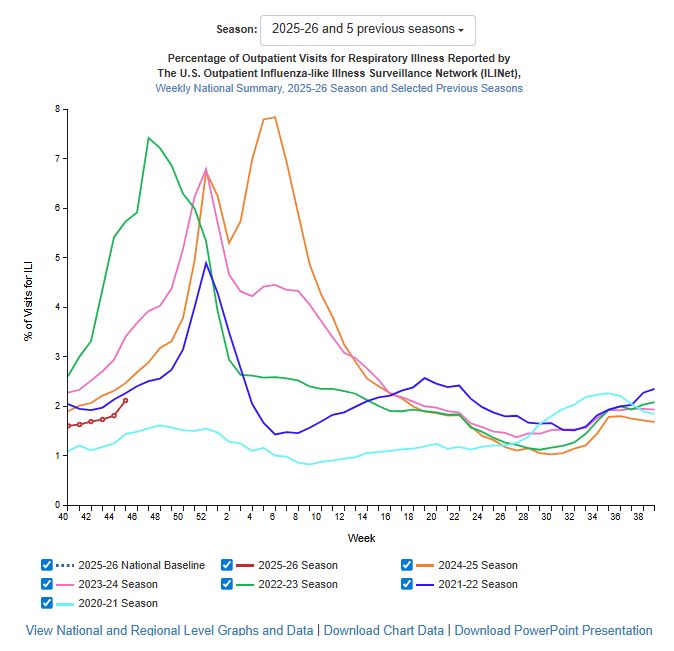
The US CDC's Flu View is back on-line and the 8 Nov flu report is available.
Influenza is just starting to tick up in the US (red line with circle points at left is current season).
www.cdc.gov/fluview/surv...
1/
Influenza is just starting to tick up in the US (red line with circle points at left is current season).
www.cdc.gov/fluview/surv...
1/
November 14, 2025 at 11:14 PM
The US CDC's Flu View is back on-line and the 8 Nov flu report is available.
Influenza is just starting to tick up in the US (red line with circle points at left is current season).
www.cdc.gov/fluview/surv...
1/
Influenza is just starting to tick up in the US (red line with circle points at left is current season).
www.cdc.gov/fluview/surv...
1/
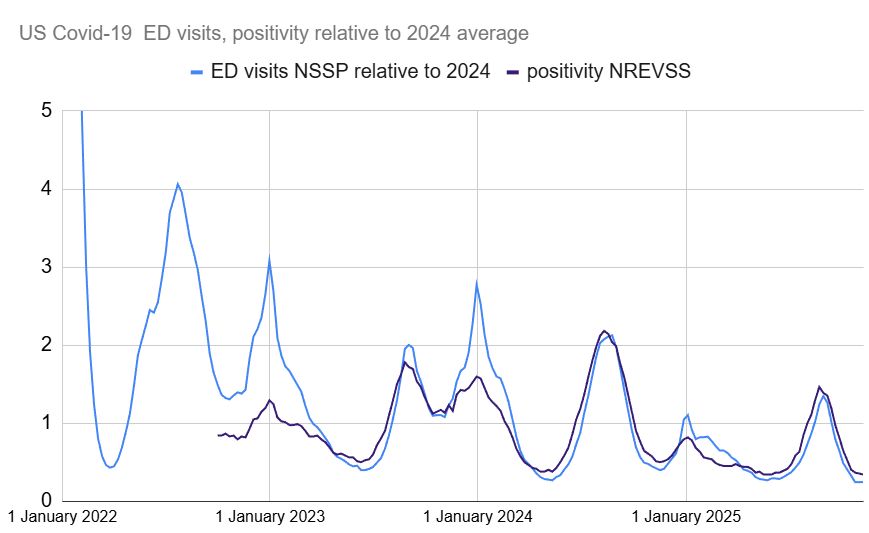
The US is currently at historic lows for Covid-19 emergency department visits and test positivity, but has probably hit bottom and I'd expect rising levels through the end of the year.
(data source in quoted thread)
(data source in quoted thread)

November 14, 2025 at 11:02 PM
The US is currently at historic lows for Covid-19 emergency department visits and test positivity, but has probably hit bottom and I'd expect rising levels through the end of the year.
(data source in quoted thread)
(data source in quoted thread)
The US CDC's respiratory virus data is starting to come back online.
This page is up-to-date now, and probably the best site for up-to-date monitoring of respiratory virus activity in your area:
1/
www.cdc.gov/respiratory-...
This page is up-to-date now, and probably the best site for up-to-date monitoring of respiratory virus activity in your area:
1/
www.cdc.gov/respiratory-...

Respiratory Virus Activity Levels
Updates on how COVID-19, Flu, and RSV may be spreading nationally and in your state
www.cdc.gov
November 14, 2025 at 10:52 PM
The US CDC's respiratory virus data is starting to come back online.
This page is up-to-date now, and probably the best site for up-to-date monitoring of respiratory virus activity in your area:
1/
www.cdc.gov/respiratory-...
This page is up-to-date now, and probably the best site for up-to-date monitoring of respiratory virus activity in your area:
1/
www.cdc.gov/respiratory-...
The annual ABS Causes of Death report is out today.
Life in Australia in 2024 was less deadly than pre-pandemic. The airborne-AIDS and turbo-cancer apocalypses have failed to materialize.
www.abs.gov.au/statistics/h...
Life in Australia in 2024 was less deadly than pre-pandemic. The airborne-AIDS and turbo-cancer apocalypses have failed to materialize.
www.abs.gov.au/statistics/h...

November 14, 2025 at 1:20 AM
The annual ABS Causes of Death report is out today.
Life in Australia in 2024 was less deadly than pre-pandemic. The airborne-AIDS and turbo-cancer apocalypses have failed to materialize.
www.abs.gov.au/statistics/h...
Life in Australia in 2024 was less deadly than pre-pandemic. The airborne-AIDS and turbo-cancer apocalypses have failed to materialize.
www.abs.gov.au/statistics/h...