


Kirsten Dyck
@kirstdy.bsky.social
470 followers
390 following
100 posts
Avid fan of my family, friends, teaching, and learning, mostly about math. she/her SK🇨🇦 Treaty Six
Posts
Media
Videos
Starter Packs
Reposted by Kirsten Dyck


Reposted by Kirsten Dyck


Reposted by Kirsten Dyck

Jenna Laib
@jennalaib.bsky.social
· Sep 21
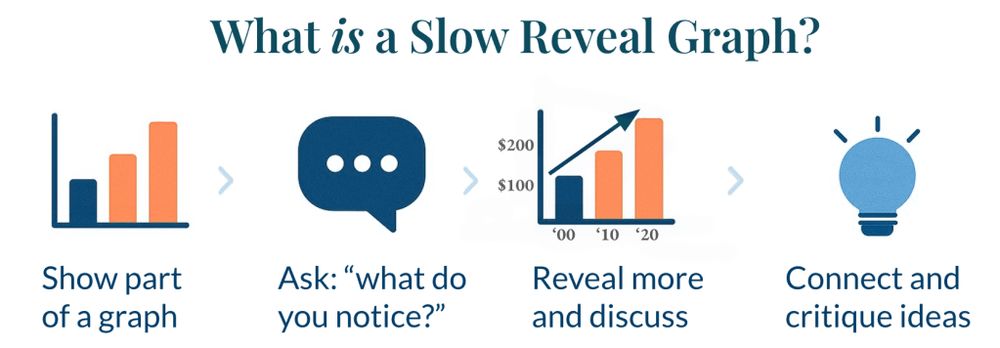
By revealing graphs piece by piece, teachers can build student curiosity and guide them to more effectively make sense of data! 📊
#DataLiteracy #EduSky #MathSky
#DataLiteracy #EduSky #MathSky

The Power of Slow Reveal Graphs
Teachers can leverage students’ curiosity to explore visual representations of data in an engaging way.
edut.to
Kirsten Dyck
@kirstdy.bsky.social
· Sep 21

Kirsten Dyck
@kirstdy.bsky.social
· Sep 12
Reposted by Kirsten Dyck


Kirsten Dyck
@kirstdy.bsky.social
· Sep 6
Reposted by Kirsten Dyck


Kirsten Dyck
@kirstdy.bsky.social
· Sep 6
Reposted by Kirsten Dyck
Jenna Laib
@jennalaib.bsky.social
· Aug 27

Have foreign tourists really avoided America this year? (2025)
Have foreign tourists really avoided America this summer? This graph from the Economist may look like a simple bar graph, but it asks the viewer to integrate ideas about both percentage change and also the actual change.
slowrevealgraphs.com
Reposted by Kirsten Dyck

Reposted by Kirsten Dyck

Nat Banting
@natbanting.bsky.social
· Aug 24

BC has a grade 11 math history course!!
Have any BC math educators on here taught this course? If so, what was your experience?
Have any BC math educators on here taught this course? If so, what was your experience?
Kirsten Dyck
@kirstdy.bsky.social
· Jul 21
Reposted by Kirsten Dyck

Kirsten Dyck
@kirstdy.bsky.social
· Jul 21
Kirsten Dyck
@kirstdy.bsky.social
· Jul 21
Reposted by Kirsten Dyck

Reposted by Kirsten Dyck
Jenna Laib
@jennalaib.bsky.social
· Jul 11
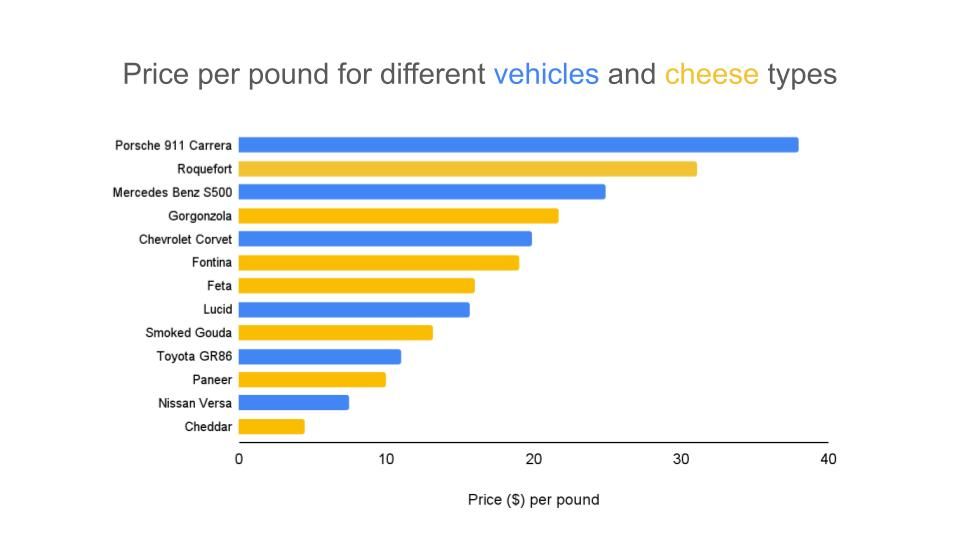
Cost per pound of vehicles compared with per pound of types of cheese
Cost (in USD $) per pound of Vehicles compared with per pound of Types of Cheesegraph by Andrew McCalip/Norma Gordon; slow reveal by Norma Gordon (Slide deck includes notes and questions to elicit discourse) Type of Graph: bar graph Visualization Source: Original graph - McCalip, Andrew (@andrewmccalip). “Since we're talking manufacturing this week... I think a lot about the price of cheese vs vehicles per pound.” …
slowrevealgraphs.com
Reposted by Kirsten Dyck

Reposted by Kirsten Dyck
Jenna Laib
@jennalaib.bsky.social
· May 25

Best Selling Books in History (International)
Best Selling Books in History (International)graph by James Eagle; slow reveal by Jenna Laib (Slide deck includes notes and questions to elicit discourse) Type of Graph: line graph Visualization Sourc...
slowrevealgraphs.com
Kirsten Dyck
@kirstdy.bsky.social
· May 13
Kirsten Dyck
@kirstdy.bsky.social
· May 12