


Interactive Data Lab
@idl.uw.edu
Visualization & data analysis research at the University of Washington. In a prior life was the Stanford Vis Group. https://idl.uw.edu
Reposted by Interactive Data Lab

The Mosaic architecture for database-backed interactive visualization just hit 1,000 stars on GitHub! Thank you to all who have participated and contributed!

April 29, 2025 at 6:04 PM
The Mosaic architecture for database-backed interactive visualization just hit 1,000 stars on GitHub! Thank you to all who have participated and contributed!
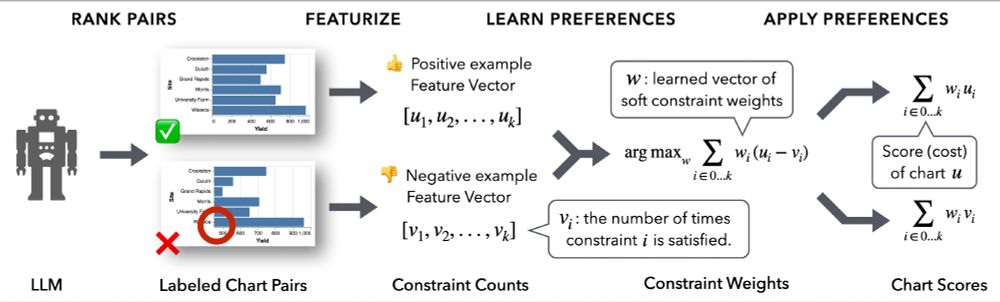
People are now using LLMs to create charts and graphs. How might we assess the quality and consistency of the results? DracoGPT is a method that fits a visualization knowledge base (Draco) to LLM responses, enabling comparison across models, prompts, and results from human subjects experiments.
November 26, 2024 at 7:12 PM
People are now using LLMs to create charts and graphs. How might we assess the quality and consistency of the results? DracoGPT is a method that fits a visualization knowledge base (Draco) to LLM responses, enabling comparison across models, prompts, and results from human subjects experiments.
Hi Bluesky! 👋 We’re the Interactive Data Lab at UW. We’ll post about data visualization, analysis, and human-computer interaction research, as well as open source projects. Over the years we’ve been involved with Protovis, D3, Data Wrangler (-> Trifacta), Vega/Vega-Lite, Mosaic, and other projects!
November 25, 2024 at 5:37 PM
Hi Bluesky! 👋 We’re the Interactive Data Lab at UW. We’ll post about data visualization, analysis, and human-computer interaction research, as well as open source projects. Over the years we’ve been involved with Protovis, D3, Data Wrangler (-> Trifacta), Vega/Vega-Lite, Mosaic, and other projects!