


Will Macnair
@willmacnair.bsky.social
Amateur neuroscientist, quite a bit of experience in single cell analysis, working on #neurodegeneration in Basel. Formerly postdoc with @markrobinsonca.bsky.social at UZH.
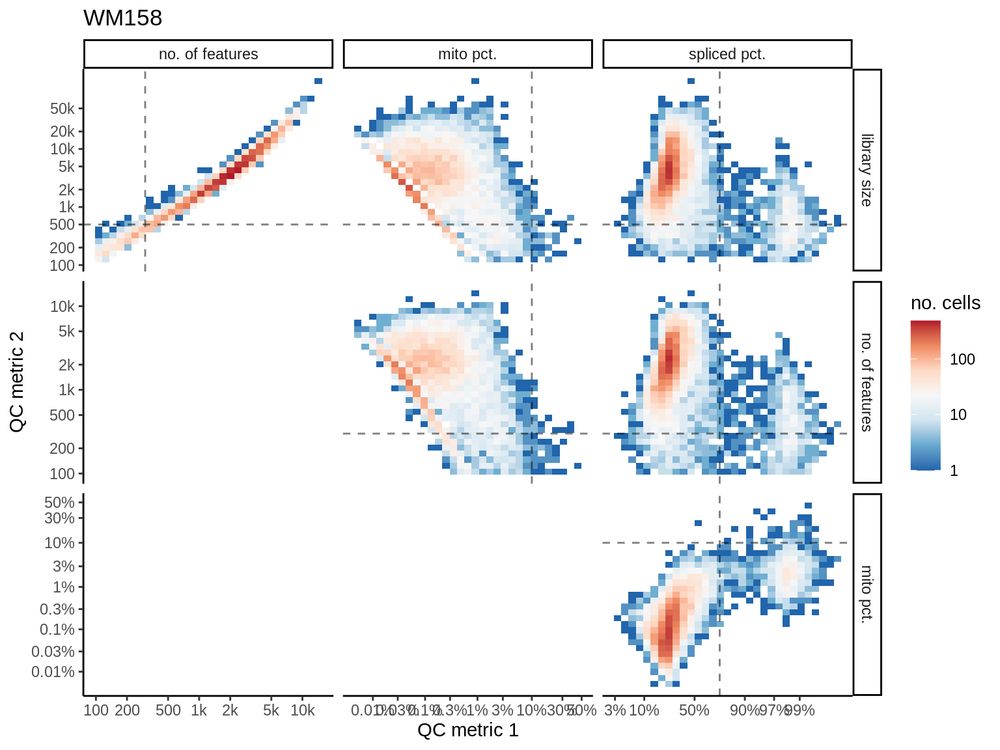
This plot shows pairwise QC metrics of a brain sn sample. The hi-spliced-hi-MT and low-spliced-mixed-MT clusters are clearly very distinct.
We see this consistently across samples/studies/tissues (in sn data, sc is a bit different). I think this effect is much bigger than natural variation...
We see this consistently across samples/studies/tissues (in sn data, sc is a bit different). I think this effect is much bigger than natural variation...

December 5, 2024 at 4:26 PM
This plot shows pairwise QC metrics of a brain sn sample. The hi-spliced-hi-MT and low-spliced-mixed-MT clusters are clearly very distinct.
We see this consistently across samples/studies/tissues (in sn data, sc is a bit different). I think this effect is much bigger than natural variation...
We see this consistently across samples/studies/tissues (in sn data, sc is a bit different). I think this effect is much bigger than natural variation...
I approve of this, however I would make a tweak: I think pct data in biology is ~always easier to understand with a logistic transform.
The plot shows QC metrics of a brain single nuclei sample. The mito pct vs spliced pct makes the point of your paper especially clear :D
The plot shows QC metrics of a brain single nuclei sample. The mito pct vs spliced pct makes the point of your paper especially clear :D
December 4, 2024 at 2:51 PM
I approve of this, however I would make a tweak: I think pct data in biology is ~always easier to understand with a logistic transform.
The plot shows QC metrics of a brain single nuclei sample. The mito pct vs spliced pct makes the point of your paper especially clear :D
The plot shows QC metrics of a brain single nuclei sample. The mito pct vs spliced pct makes the point of your paper especially clear :D
Bigger numbers are better, right…? 😅
#963,757!
#963,757!

September 23, 2024 at 6:52 AM
Bigger numbers are better, right…? 😅
#963,757!
#963,757!