


TradesViz | Trading Performance Analysis
@tradesviz.bsky.social
The best trading journal to find/visualize your trading edge! Do trade logging, charting, management, simulation, and risk analysis ++.RD: http://bit.ly/3BCppYe
Tired of paying for a separate simulator or a crypto-only journal? Stop paying the complexity tax. TradesViz gives everything in one interface: 30,000+ symbols (including $BTC), 600+ professional metrics, zero fluff, zero BS. Want efficiency? Switch to TradesViz.

February 5, 2026 at 11:19 PM
Tired of paying for a separate simulator or a crypto-only journal? Stop paying the complexity tax. TradesViz gives everything in one interface: 30,000+ symbols (including $BTC), 600+ professional metrics, zero fluff, zero BS. Want efficiency? Switch to TradesViz.
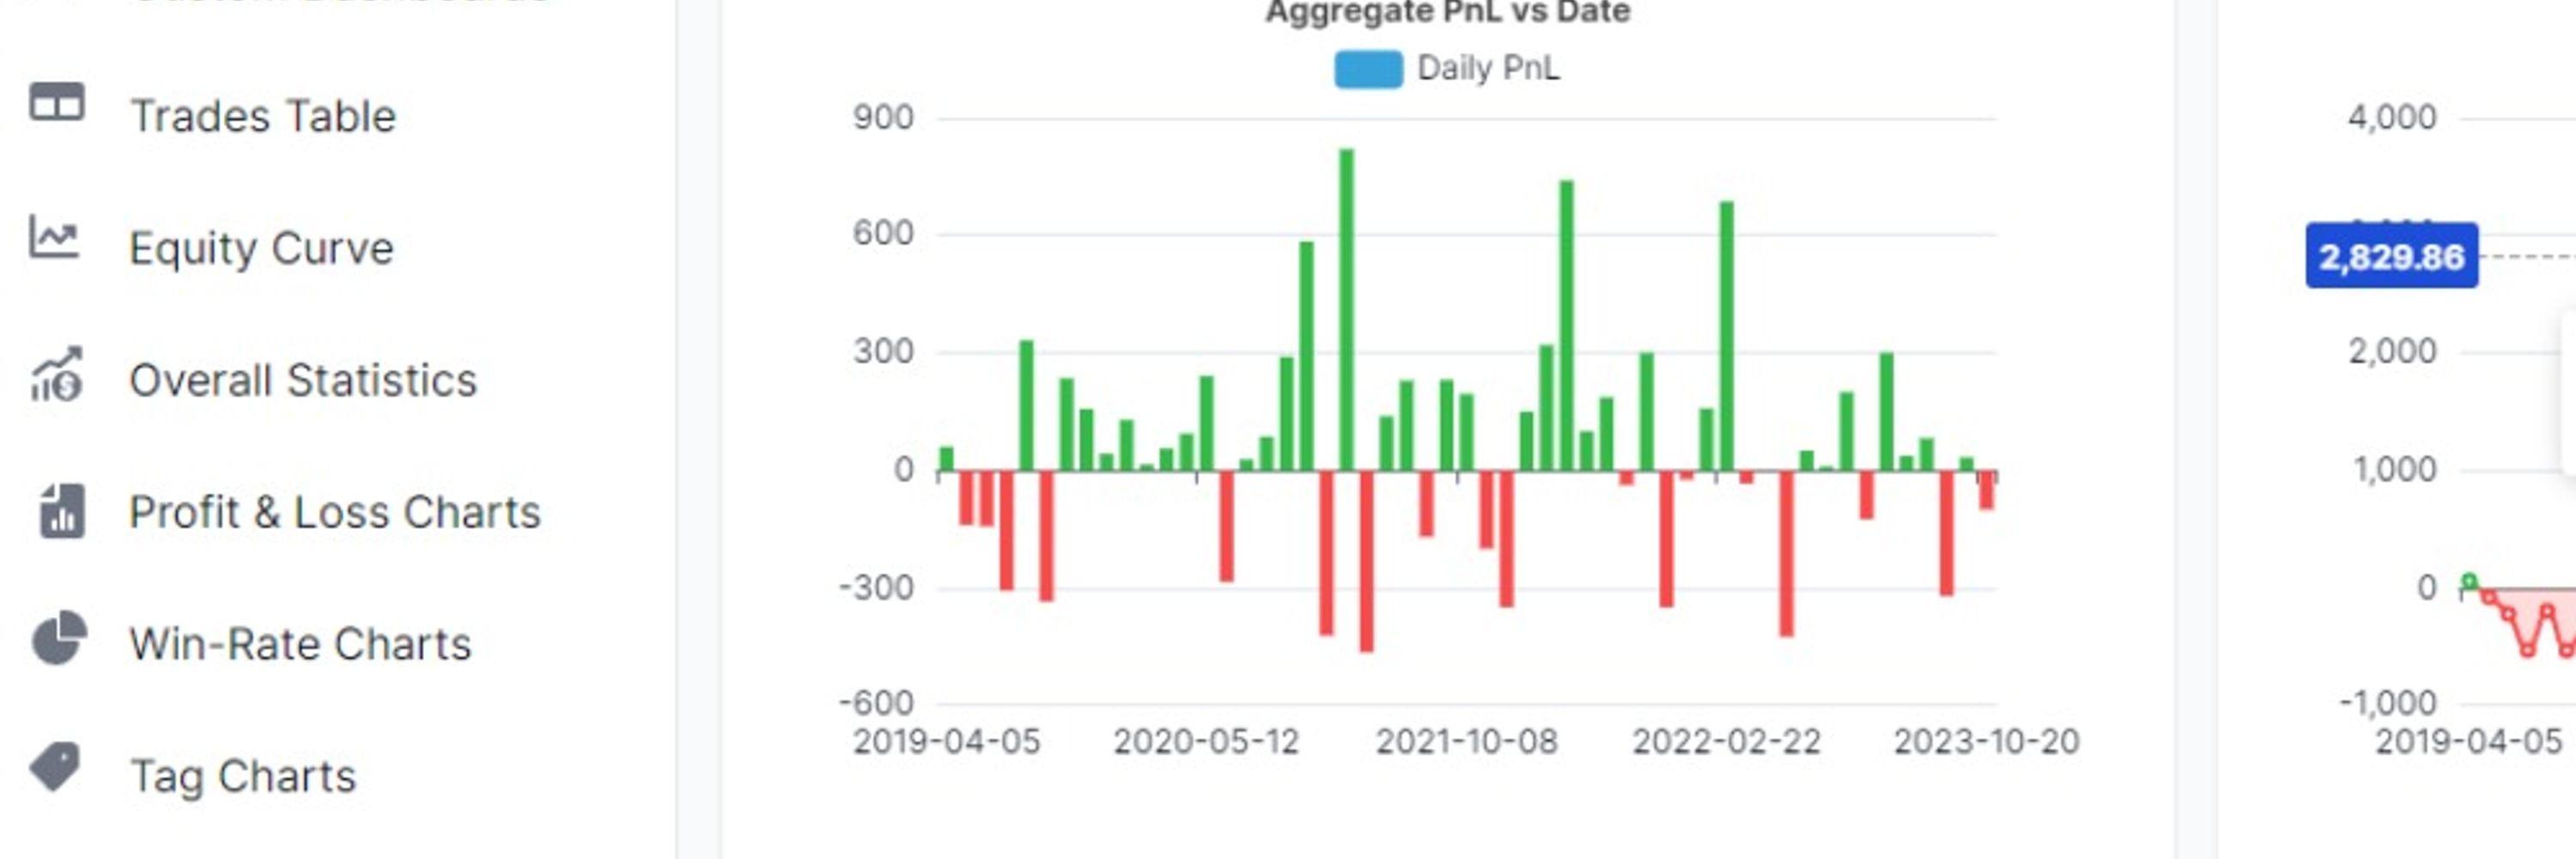
Stop exporting to Excel. Build your models here. 📊 Forget static charts. TradesViz is a sandbox. Pivot Table Charting lets you slice and dice like a spreadsheet with instant visuals. Daily PnL swings, but cumulative trend is upward. Don't just read the report. Write it.

February 5, 2026 at 7:34 PM
Stop exporting to Excel. Build your models here. 📊 Forget static charts. TradesViz is a sandbox. Pivot Table Charting lets you slice and dice like a spreadsheet with instant visuals. Daily PnL swings, but cumulative trend is upward. Don't just read the report. Write it.
Stop paying the influencer tax for a journal that spends more on ads than engineering. TradesViz focuses on engineering to give you a real edge and great value. Features & support: 200+ brokers, 40+ auto-syncs. Deep AI built in. Time to switch.

February 5, 2026 at 7:33 PM
Stop paying the influencer tax for a journal that spends more on ads than engineering. TradesViz focuses on engineering to give you a real edge and great value. Features & support: 200+ brokers, 40+ auto-syncs. Deep AI built in. Time to switch.
Zoom out from daily noise. One bad day won't ruin a career, but a bad week can damage your mindset. Week View smooths daily swings to reveal the real trend. Despite some red weeks, the Purple Line (PnL % Change) stays above baseline. Manage the trend, not every tick.

February 5, 2026 at 5:19 PM
Zoom out from daily noise. One bad day won't ruin a career, but a bad week can damage your mindset. Week View smooths daily swings to reveal the real trend. Despite some red weeks, the Purple Line (PnL % Change) stays above baseline. Manage the trend, not every tick.
These three AI features on TradesViz outperform every other trading analytics platform. Deeply integrated and refined over years, they've produced tens of thousands of useful insights for traders. Still using outdated platforms? It's time to move on.

February 5, 2026 at 5:19 PM
These three AI features on TradesViz outperform every other trading analytics platform. Deeply integrated and refined over years, they've produced tens of thousands of useful insights for traders. Still using outdated platforms? It's time to move on.
The analysis is done for you. The Insights Panel on the right turns charts into plain English, scans your history, and gives lines like: 'Most profitable price range 50 to 99.99 (29% of profits)' and warnings like 'Least profitable 200 to 499.99'. Skip the number crunching.

February 5, 2026 at 4:34 PM
The analysis is done for you. The Insights Panel on the right turns charts into plain English, scans your history, and gives lines like: 'Most profitable price range 50 to 99.99 (29% of profits)' and warnings like 'Least profitable 200 to 499.99'. Skip the number crunching.
Feb 5 options flow showed divergence on the 30‑min in tech and materials. $COHR led with rising call premium as price steadied, signaling hidden accumulation. Others: $ARKK $ASML $COPX $CRDO $FCX $FIG $GS $IBIT $IONQ. Expanding call premium with flat spot often signals accumulation and rotation.

February 5, 2026 at 3:04 PM
Feb 5 options flow showed divergence on the 30‑min in tech and materials. $COHR led with rising call premium as price steadied, signaling hidden accumulation. Others: $ARKK $ASML $COPX $CRDO $FCX $FIG $GS $IBIT $IONQ. Expanding call premium with flat spot often signals accumulation and rotation.
Feb 5 tape: small-cap momentum continued with metal and early-stage breakouts. $GROY-WS +96.5% on vol +11,271%. $LIMN +87.4% and $WTO +83.3% on huge vol spikes. $GXAI +41.8% as vol jumped 18,888%. $FATN and $CRMX +40%+, $USGG and $UUUG showed 20–45% vol growth.

February 5, 2026 at 2:20 PM
Feb 5 tape: small-cap momentum continued with metal and early-stage breakouts. $GROY-WS +96.5% on vol +11,271%. $LIMN +87.4% and $WTO +83.3% on huge vol spikes. $GXAI +41.8% as vol jumped 18,888%. $FATN and $CRMX +40%+, $USGG and $UUUG showed 20–45% vol growth.
Feb 5 options tape showed rotation in semiconductors and mega cap tech with AVGO central. Mar 6 2026 $310 calls printed >$36M, signaling repositioning not directional bets. NVDA: $172.5 put sale $8.9M and $180 call buy $7.4M. TSLA and LLY had ~$7M call sweeps, signaling hedges with upside bias.

February 5, 2026 at 2:19 PM
Feb 5 options tape showed rotation in semiconductors and mega cap tech with AVGO central. Mar 6 2026 $310 calls printed >$36M, signaling repositioning not directional bets. NVDA: $172.5 put sale $8.9M and $180 call buy $7.4M. TSLA and LLY had ~$7M call sweeps, signaling hedges with upside bias.
Earnings Feb 5 feature tech, energy and industrials. $AMZN leads after hours (market cap $2.6T, EPS est $1.98). Pre-market focus on cyclicals: $SHEL $220B $1.21, $COP $125B $1.08, $LIN $214B $4.15, $CMI $5.20. Also $BMY $1.15, $BBVA $0.50, $KKR $1.06, $ICE $1.67, $SONY $0.34.

February 5, 2026 at 1:34 PM
Earnings Feb 5 feature tech, energy and industrials. $AMZN leads after hours (market cap $2.6T, EPS est $1.98). Pre-market focus on cyclicals: $SHEL $220B $1.21, $COP $125B $1.08, $LIN $214B $4.15, $CMI $5.20. Also $BMY $1.15, $BBVA $0.50, $KKR $1.06, $ICE $1.67, $SONY $0.34.
Stop flipping through paper pages. A journal is fine until you need a lesson from six months ago. TradesViz Notes turns your thoughts into a searchable database. Want every trade with a setup? Just search. Recall notes like "It was an easy M or double-top formation." Digitize your brain.

February 4, 2026 at 6:04 PM
Stop flipping through paper pages. A journal is fine until you need a lesson from six months ago. TradesViz Notes turns your thoughts into a searchable database. Want every trade with a setup? Just search. Recall notes like "It was an easy M or double-top formation." Digitize your brain.
Charts show where price has been. The Chain shows where it's going. 🎞️ Most simulators replay only price. The Options Chain Simulator replays the full order book. Watch bid/ask spreads move, spot volume spikes like 4,996 on Calls. Replay at 1x or faster. Read the tape.

February 4, 2026 at 4:34 PM
Charts show where price has been. The Chain shows where it's going. 🎞️ Most simulators replay only price. The Options Chain Simulator replays the full order book. Watch bid/ask spreads move, spot volume spikes like 4,996 on Calls. Replay at 1x or faster. Read the tape.
Momentum stayed firm Feb 4 as multiple names printed higher highs for a third session. $ORKT +83.1% on volume +5,000%, $ZSL, $ETQ, $BMNZ >57%. $PSIG saw volume +12,869%, signaling aggressive accumulation. $SNDK +62.6% (28M). $CONI +57%, $CRCD +56%; $MOD +48.7%, $LRN +28.4%.

February 4, 2026 at 3:49 PM
Momentum stayed firm Feb 4 as multiple names printed higher highs for a third session. $ORKT +83.1% on volume +5,000%, $ZSL, $ETQ, $BMNZ >57%. $PSIG saw volume +12,869%, signaling aggressive accumulation. $SNDK +62.6% (28M). $CONI +57%, $CRCD +56%; $MOD +48.7%, $LRN +28.4%.
Momentum stayed firm on Feb 4 as many names hit higher highs for a third day. $ORKT led, up 83.1% with vol +5,000%. $ZSL, $ETQ, $BMNZ rose >57%. $PSIG had a 12,869% volume surge, signaling aggressive accumulation. $SNDK +62.6% on 28M shares; $CONI, $CRCD, $MOD, $LRN showed strong follow-through.
February 4, 2026 at 3:05 PM
Momentum stayed firm on Feb 4 as many names hit higher highs for a third day. $ORKT led, up 83.1% with vol +5,000%. $ZSL, $ETQ, $BMNZ rose >57%. $PSIG had a 12,869% volume surge, signaling aggressive accumulation. $SNDK +62.6% on 28M shares; $CONI, $CRCD, $MOD, $LRN showed strong follow-through.
Feb 4 options tape showed a sharp pickup in split side selling across big names. $WMT up 3850%, $BKNG 2300%, $BX 1028%, $SMH 44%, $SMCI 152%. Chips faded on rising sell volume. Energy/infrastructure $UNG 783%, $LITE 1600%.

February 4, 2026 at 2:19 PM
Feb 4 options tape showed a sharp pickup in split side selling across big names. $WMT up 3850%, $BKNG 2300%, $BX 1028%, $SMH 44%, $SMCI 152%. Chips faded on rising sell volume. Energy/infrastructure $UNG 783%, $LITE 1600%.
Feb 4 tape showed rotations in semis and large-cap tech. AVGO led with multiple Mar 6 2026 310C split trades totaling $40M+, showing two-way positioning. NVDA had a $172.5P split ($8.9M) and $180C sweep ($7.4M). TSLA saw a $150C sweep ($7M). Calls also rose in NVO, LLY, XBI.

February 4, 2026 at 2:19 PM
Feb 4 tape showed rotations in semis and large-cap tech. AVGO led with multiple Mar 6 2026 310C split trades totaling $40M+, showing two-way positioning. NVDA had a $172.5P split ($8.9M) and $180C sweep ($7.4M). TSLA saw a $150C sweep ($7M). Calls also rose in NVO, LLY, XBI.
Feb 4 earnings spotlight tech, healthcare and finance. After hours $GOOG (mkt cap $4.15T) has a $2.58 EPS est; $QCOM reports late (cap $163B, $2.80 EPS). Premarket centers on pharma and banks: $LLY ($987B, $6.99 EPS), $ABBV $2.66, $NVS $1.99, $NVO $0.90, $SAN and $UBS $0.25.

February 4, 2026 at 1:33 PM
Feb 4 earnings spotlight tech, healthcare and finance. After hours $GOOG (mkt cap $4.15T) has a $2.58 EPS est; $QCOM reports late (cap $163B, $2.80 EPS). Premarket centers on pharma and banks: $LLY ($987B, $6.99 EPS), $ABBV $2.66, $NVS $1.99, $NVO $0.90, $SAN and $UBS $0.25.
RT @tradesviz: Try trading the futures market open on a simulator like @tradesviz before risking real capital. It's the best way to learn without taking real losses. 👇#NTUpartner

February 4, 2026 at 11:18 AM
RT @tradesviz: Try trading the futures market open on a simulator like @tradesviz before risking real capital. It's the best way to learn without taking real losses. 👇#NTUpartner
Strategy gets you into a trade; psychology keeps you in. Most focus on entries and ignore mindset. Non-negotiables: risk no more than 3% per trade, trade only what you understand, always use a stop loss, stay disciplined. Build your mind; profits follow.

February 3, 2026 at 9:04 PM
Strategy gets you into a trade; psychology keeps you in. Most focus on entries and ignore mindset. Non-negotiables: risk no more than 3% per trade, trade only what you understand, always use a stop loss, stay disciplined. Build your mind; profits follow.
Did you win because you were right, or because you refused to fold? A green P&L doesn't always mean a good trade. The MAE (top right) shows how much drawdown you endured. If green dots sit far right, you rode big losses hoping for a rebound. That's hoping, not trading.

February 3, 2026 at 7:34 PM
Did you win because you were right, or because you refused to fold? A green P&L doesn't always mean a good trade. The MAE (top right) shows how much drawdown you endured. If green dots sit far right, you rode big losses hoping for a rebound. That's hoping, not trading.
How much is hesitation costing you? 💸 Traders hold losers too long and cut winners too short. The Stop Loss/PT Simulator re-runs your trades with fixed exit rules and shows the impact. In this example results rose 2,400% by removing emotion from exits. Don't guess. Simulate.

February 3, 2026 at 5:20 PM
How much is hesitation costing you? 💸 Traders hold losers too long and cut winners too short. The Stop Loss/PT Simulator re-runs your trades with fixed exit rules and shows the impact. In this example results rose 2,400% by removing emotion from exits. Don't guess. Simulate.
New feature launches tomorrow 👀 We think it'll be really helpful for many traders, and it works great with some of the features we already have 😉 We're just getting started. 🔥 #charts #comingsoon #trading

February 3, 2026 at 4:37 PM
New feature launches tomorrow 👀 We think it'll be really helpful for many traders, and it works great with some of the features we already have 😉 We're just getting started. 🔥 #charts #comingsoon #trading
Your subconscious drives trading patterns and AI reveals them. It finds nuances, like recommending a stop-loss that limits average losses to -$30 while take-profits average +$50. Data-driven coaching that diagnoses your habits and prescribes fixes.

February 3, 2026 at 4:34 PM
Your subconscious drives trading patterns and AI reveals them. It finds nuances, like recommending a stop-loss that limits average losses to -$30 while take-profits average +$50. Data-driven coaching that diagnoses your habits and prescribes fixes.
Feb 3 screen showed bullish expansion across trend and SMA crossovers. In 50-200 SMA $SJ +21.8% vol +114%, $CBUS +19.6%, $ISPR +19.1%. $HOMB and $SUI volumes doubled. $BTF +343% in two weeks; $CRVS, $MOVE, $BOIL 3-digit gains. $USAX, $MSCLF +65% with outsized volume, multiday strength.

February 3, 2026 at 3:05 PM
Feb 3 screen showed bullish expansion across trend and SMA crossovers. In 50-200 SMA $SJ +21.8% vol +114%, $CBUS +19.6%, $ISPR +19.1%. $HOMB and $SUI volumes doubled. $BTF +343% in two weeks; $CRVS, $MOVE, $BOIL 3-digit gains. $USAX, $MSCLF +65% with outsized volume, multiday strength.
Feb 3 tape showed a sharp rise in put demand across sectors, signaling broad hedging. $GLD led with a 4,206% jump in its put-to-call ratio after two sessions of downside protection. $TMUS 3,399%, $APH 2,675%; $IRE and $BUD four-digit gains. $RGTI, $CDNS, $AI rose 200-500%; $FICO reflected the shift.

February 3, 2026 at 2:20 PM
Feb 3 tape showed a sharp rise in put demand across sectors, signaling broad hedging. $GLD led with a 4,206% jump in its put-to-call ratio after two sessions of downside protection. $TMUS 3,399%, $APH 2,675%; $IRE and $BUD four-digit gains. $RGTI, $CDNS, $AI rose 200-500%; $FICO reflected the shift.