


David Hood
@thoughtfulnz.bsky.social
I like collating data,
and getting thoughts in the brain.
All for Public data, Aotearoa New Zealand, and informed communities. #openData #NewZealand #Aotearoa #rstats. He/him.
He tangata tiriti ahau
and getting thoughts in the brain.
All for Public data, Aotearoa New Zealand, and informed communities. #openData #NewZealand #Aotearoa #rstats. He/him.
He tangata tiriti ahau

The panel size is around 20,000 people at the moment, which is still enough to broadly say "that is a pretty low rate of Fever and Cough for NZ"

November 23, 2025 at 8:52 PM
The panel size is around 20,000 people at the moment, which is still enough to broadly say "that is a pretty low rate of Fever and Cough for NZ"
Those with object permanence going back 7 years to July/August 2018 might recall the Southern/Molyneux visit, Phil Goff's reaction, and the online reaction to Phil Goff's reaction. Smaller liberalish societies like us and Ireland are imaginary country rhetorical devices to the farrightosphere

November 23, 2025 at 8:15 PM
Those with object permanence going back 7 years to July/August 2018 might recall the Southern/Molyneux visit, Phil Goff's reaction, and the online reaction to Phil Goff's reaction. Smaller liberalish societies like us and Ireland are imaginary country rhetorical devices to the farrightosphere
As an aside form making a Taumatawhakatangihangakoauauotamateaturipukakapikimaungahoronukupokaiwhenuakitanatahu map, those of us who were watching After School in the early 80s (so working age folk) were getting a lot more bilingual and biculturalism than suits the present government's culture war

November 23, 2025 at 10:03 AM
As an aside form making a Taumatawhakatangihangakoauauotamateaturipukakapikimaungahoronukupokaiwhenuakitanatahu map, those of us who were watching After School in the early 80s (so working age folk) were getting a lot more bilingual and biculturalism than suits the present government's culture war
I am putting out #30DayMapChallenge Day 24 - Places and theirnames - early, as the next few days may be complicated.
The delicate art of fitting Map on a map (made in Inkscape)
The delicate art of fitting Map on a map (made in Inkscape)

November 23, 2025 at 2:37 AM
I am putting out #30DayMapChallenge Day 24 - Places and theirnames - early, as the next few days may be complicated.
The delicate art of fitting Map on a map (made in Inkscape)
The delicate art of fitting Map on a map (made in Inkscape)
Papers Past is a source of TV program listings


November 22, 2025 at 1:04 AM
Papers Past is a source of TV program listings
OTOH, at the right time of year (Southern Hemisphere Winter) you can find times when the 5 non-Australia or Antartica continents are almost entirely in day and the Pacific is in night, as a hemisphere boundary.

November 21, 2025 at 9:05 PM
OTOH, at the right time of year (Southern Hemisphere Winter) you can find times when the 5 non-Australia or Antartica continents are almost entirely in day and the Pacific is in night, as a hemisphere boundary.
Well, as it happens...

November 19, 2025 at 10:52 PM
Well, as it happens...
#30DayMapChallenge Day 20: Water. I deliberately chose to use area for average rainfall, as the up to 10 times difference between sites swamped most other scales I tried

November 19, 2025 at 6:31 PM
#30DayMapChallenge Day 20: Water. I deliberately chose to use area for average rainfall, as the up to 10 times difference between sites swamped most other scales I tried
Infant mortality rates were around 10 times higher a century ago, about 5 times higher pre many modern vaccines, but in many respects that makes death a less remarkable thing to discuss.

November 18, 2025 at 3:46 AM
Infant mortality rates were around 10 times higher a century ago, about 5 times higher pre many modern vaccines, but in many respects that makes death a less remarkable thing to discuss.
this was all I saw on the 1893 outbreak (I then hunted down separate population figures.

November 18, 2025 at 1:03 AM
this was all I saw on the 1893 outbreak (I then hunted down separate population figures.
Who wraps gladwrap press n seal around their keyboard? Who had a major coffee spill with no consequences? This guy.

November 17, 2025 at 9:42 PM
Who wraps gladwrap press n seal around their keyboard? Who had a major coffee spill with no consequences? This guy.
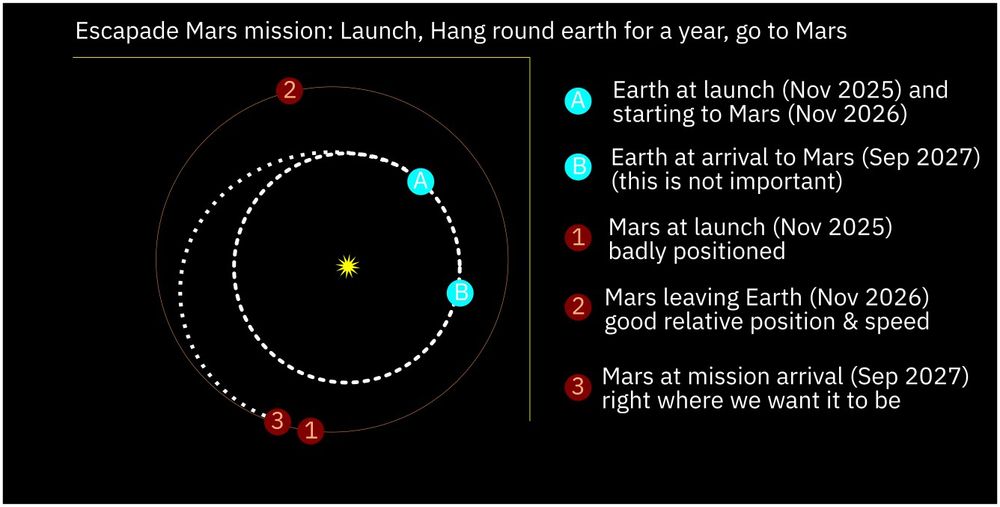
#30DayMapChallenge Day 18 - Out of this World.
Sun-centric route map of the Mars Escapade mission (made in Inkscape)
Sun-centric route map of the Mars Escapade mission (made in Inkscape)
November 17, 2025 at 8:49 PM
#30DayMapChallenge Day 18 - Out of this World.
Sun-centric route map of the Mars Escapade mission (made in Inkscape)
Sun-centric route map of the Mars Escapade mission (made in Inkscape)
Comparing it to IBM Plex Sans which I have been using the last month or so, I like the slightly more spaced Lexend Deca though when using Lexend I am inclined to step down the headings from my normal semibold (with other fonts) to medium (yay for library(systemfonts)). To remake a recent graph-


November 17, 2025 at 6:08 AM
Comparing it to IBM Plex Sans which I have been using the last month or so, I like the slightly more spaced Lexend Deca though when using Lexend I am inclined to step down the headings from my normal semibold (with other fonts) to medium (yay for library(systemfonts)). To remake a recent graph-
Ohh. Atkinson can be complicated with Macrons/ Tohutō (I used it for years on graphs where I could) but it looks like Lexend handles key letters much better. Normally, I force extra spacing in Word in deeply buried paragraph style settings, but a font like this has broader general potential.

November 17, 2025 at 5:29 AM
Ohh. Atkinson can be complicated with Macrons/ Tohutō (I used it for years on graphs where I could) but it looks like Lexend handles key letters much better. Normally, I force extra spacing in Word in deeply buried paragraph style settings, but a font like this has broader general potential.
They sentenced me to 20 years of boredom
For trying to change the system from within
I'm coming now, I'm coming to reward them
For trying to change the system from within
I'm coming now, I'm coming to reward them

November 17, 2025 at 5:09 AM
They sentenced me to 20 years of boredom
For trying to change the system from within
I'm coming now, I'm coming to reward them
For trying to change the system from within
I'm coming now, I'm coming to reward them
You might want to ask yourself, if you are thinking about Sweden "in -ve excess" compared to the 2017-19 average, is how often is a year below the mortality of the 3-5 years previous & by how much. On a descending trend, a -ve excess compared to a flat line can still be worse than historical trends.

November 17, 2025 at 12:36 AM
You might want to ask yourself, if you are thinking about Sweden "in -ve excess" compared to the 2017-19 average, is how often is a year below the mortality of the 3-5 years previous & by how much. On a descending trend, a -ve excess compared to a flat line can still be worse than historical trends.
Can I just check the source of this (as this is a topic I am interested in) as the map values look a little odd for NZ.
The GBDx visualiser gives death rates for
NZ Environmental heat and cold exposures 2023 0.16
India (same) 0.39
NZ Fire, heat, and hot substances 2023 2023 0.25
India (same) 2.60
The GBDx visualiser gives death rates for
NZ Environmental heat and cold exposures 2023 0.16
India (same) 0.39
NZ Fire, heat, and hot substances 2023 2023 0.25
India (same) 2.60

November 16, 2025 at 10:14 PM
Can I just check the source of this (as this is a topic I am interested in) as the map values look a little odd for NZ.
The GBDx visualiser gives death rates for
NZ Environmental heat and cold exposures 2023 0.16
India (same) 0.39
NZ Fire, heat, and hot substances 2023 2023 0.25
India (same) 2.60
The GBDx visualiser gives death rates for
NZ Environmental heat and cold exposures 2023 0.16
India (same) 0.39
NZ Fire, heat, and hot substances 2023 2023 0.25
India (same) 2.60
Raw death is only stationary if the population structure is stable (Sweden moreso than countries). NZ is an example of a country where that is very unwise due to a 1950s youth population bulge now at peak mortality age. But for centuries the standard has been regression of age standardised mortality

November 16, 2025 at 9:19 PM
Raw death is only stationary if the population structure is stable (Sweden moreso than countries). NZ is an example of a country where that is very unwise due to a 1950s youth population bulge now at peak mortality age. But for centuries the standard has been regression of age standardised mortality
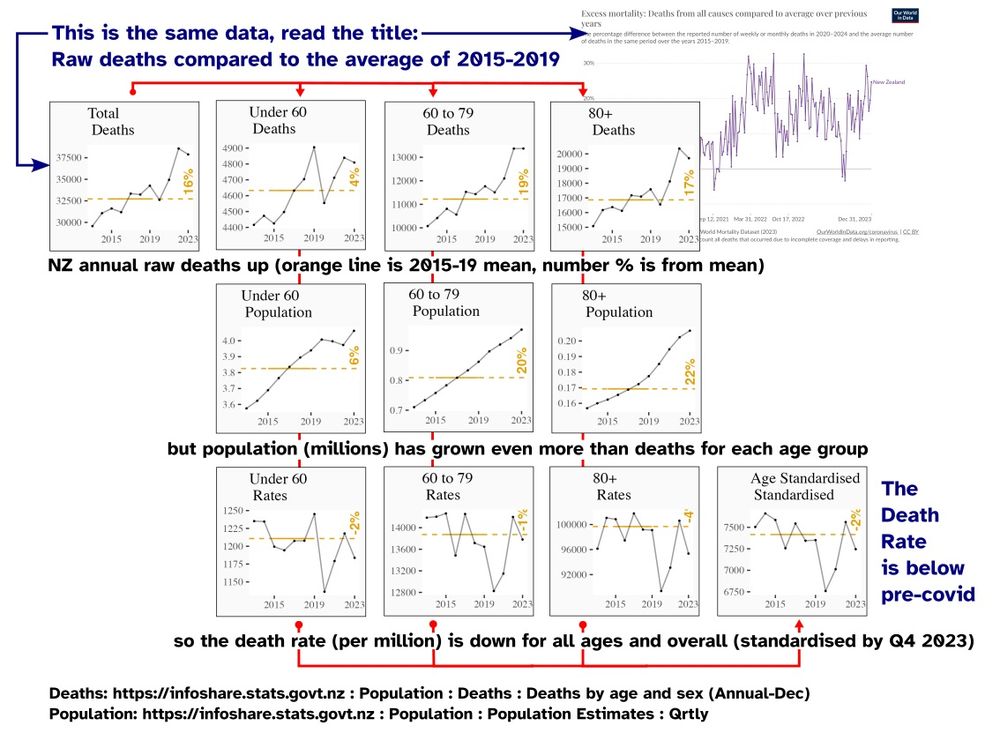
For explaining, baselines and their misuse, I know that back in the day this graph I made focusing on NZ data actually did change some people's minds about mortality claims. And that mattered, because people would take the natural raw increase in deaths due to an aging population, blame it on...
November 16, 2025 at 9:11 PM
For explaining, baselines and their misuse, I know that back in the day this graph I made focusing on NZ data actually did change some people's minds about mortality claims. And that mattered, because people would take the natural raw increase in deaths due to an aging population, blame it on...

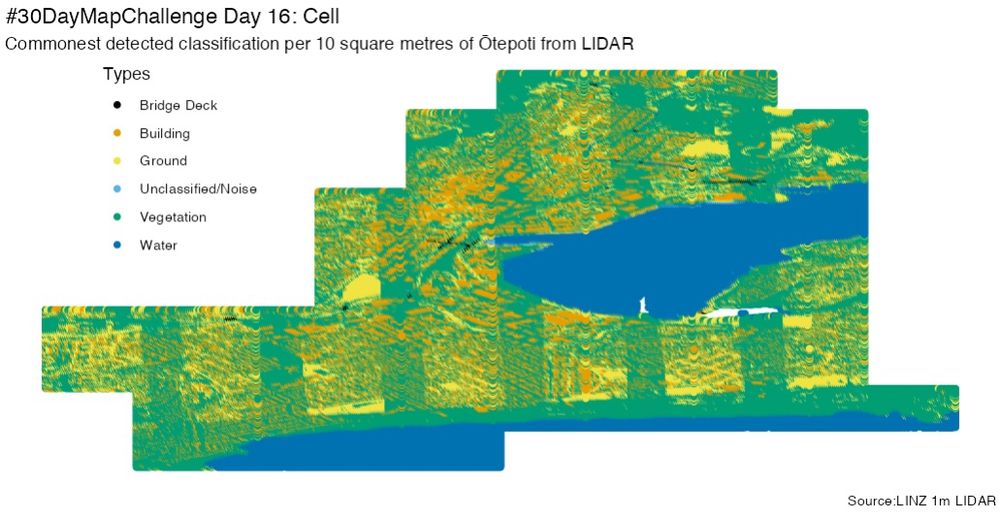
#30DayMapChallenge Day 16: Cell
LINZ ground LIDAR point cloud data for Ōtepoti (13.64 points per m²) & showing the commonest classification in each 10 square metres (so some Duckplyr in #rstats to crunch that out). It looks like the the classification is partially sensitive to the sweep reading
LINZ ground LIDAR point cloud data for Ōtepoti (13.64 points per m²) & showing the commonest classification in each 10 square metres (so some Duckplyr in #rstats to crunch that out). It looks like the the classification is partially sensitive to the sweep reading
November 16, 2025 at 1:52 AM
#30DayMapChallenge Day 16: Cell
LINZ ground LIDAR point cloud data for Ōtepoti (13.64 points per m²) & showing the commonest classification in each 10 square metres (so some Duckplyr in #rstats to crunch that out). It looks like the the classification is partially sensitive to the sweep reading
LINZ ground LIDAR point cloud data for Ōtepoti (13.64 points per m²) & showing the commonest classification in each 10 square metres (so some Duckplyr in #rstats to crunch that out). It looks like the the classification is partially sensitive to the sweep reading
On the one hand, caught a new Pokémon type in Pokémon Go, OTOH

November 15, 2025 at 10:33 PM
On the one hand, caught a new Pokémon type in Pokémon Go, OTOH
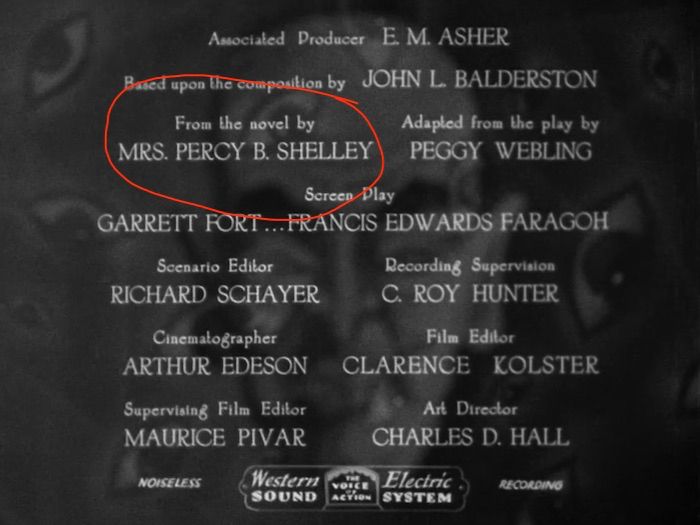
For a dating of attitudes, I am reminded of the credits of the 1931 Frankenstein "From the Novel by Mrs. Percy B. Shelley"
November 15, 2025 at 9:33 AM
For a dating of attitudes, I am reminded of the credits of the 1931 Frankenstein "From the Novel by Mrs. Percy B. Shelley"
#30DayMapChallenge Day 15: Fire
Ready, Aim, Fire. Māhia spaceport showing safety zones (as of a 2022 document I got the coordinates from)
Ready, Aim, Fire. Māhia spaceport showing safety zones (as of a 2022 document I got the coordinates from)

November 15, 2025 at 3:02 AM
#30DayMapChallenge Day 15: Fire
Ready, Aim, Fire. Māhia spaceport showing safety zones (as of a 2022 document I got the coordinates from)
Ready, Aim, Fire. Māhia spaceport showing safety zones (as of a 2022 document I got the coordinates from)