


Thomas Piketty
@thomaspiketty.bsky.social
Professor at EHESS & PSE
Co-Director, World Inequality Lab
inequalitylab.world | WID.world
http://piketty.pse.ens.fr/
Co-Director, World Inequality Lab
inequalitylab.world | WID.world
http://piketty.pse.ens.fr/
7/9
If we look at wealth inequality, we see that it has always been extremely high, with the bottom 50% holding only a tiny share of total wealth. Despite this, there has been a significant long-run movement toward greater wealth equality in rich countries, particularly in Western and Nordic Europe.
If we look at wealth inequality, we see that it has always been extremely high, with the bottom 50% holding only a tiny share of total wealth. Despite this, there has been a significant long-run movement toward greater wealth equality in rich countries, particularly in Western and Nordic Europe.

October 27, 2025 at 4:41 PM
7/9
If we look at wealth inequality, we see that it has always been extremely high, with the bottom 50% holding only a tiny share of total wealth. Despite this, there has been a significant long-run movement toward greater wealth equality in rich countries, particularly in Western and Nordic Europe.
If we look at wealth inequality, we see that it has always been extremely high, with the bottom 50% holding only a tiny share of total wealth. Despite this, there has been a significant long-run movement toward greater wealth equality in rich countries, particularly in Western and Nordic Europe.
(6/9)
Our study compares Europe and the United States and challenges the widespread belief that rising inequality in the US since the 1980s has fueled innovation and productivity, especially in high-tech sectors. In fact, we find the opposite.
Our study compares Europe and the United States and challenges the widespread belief that rising inequality in the US since the 1980s has fueled innovation and productivity, especially in high-tech sectors. In fact, we find the opposite.

October 27, 2025 at 4:41 PM
(6/9)
Our study compares Europe and the United States and challenges the widespread belief that rising inequality in the US since the 1980s has fueled innovation and productivity, especially in high-tech sectors. In fact, we find the opposite.
Our study compares Europe and the United States and challenges the widespread belief that rising inequality in the US since the 1980s has fueled innovation and productivity, especially in high-tech sectors. In fact, we find the opposite.
(5/9)
If we take Nordic Europe (1990)as a benchmark for equality, and aim even higher, we can envision a world where the gap between top and bottom incomes falls to 3–5× by 2100, versus 50-160 today.
If we take Nordic Europe (1990)as a benchmark for equality, and aim even higher, we can envision a world where the gap between top and bottom incomes falls to 3–5× by 2100, versus 50-160 today.

October 27, 2025 at 4:41 PM
(5/9)
If we take Nordic Europe (1990)as a benchmark for equality, and aim even higher, we can envision a world where the gap between top and bottom incomes falls to 3–5× by 2100, versus 50-160 today.
If we take Nordic Europe (1990)as a benchmark for equality, and aim even higher, we can envision a world where the gap between top and bottom incomes falls to 3–5× by 2100, versus 50-160 today.
(4/9)
Other inequality indicators tell the same story.
A century ago, the richest 0.1% earned 150–250× more than low-income earners in Europe. Today, that gap is down to 8–15× in Sweden, Denmark, Norway & the Netherlands — and 15–20× in Germany, France & Britain.
A striking drop in inequality.
Other inequality indicators tell the same story.
A century ago, the richest 0.1% earned 150–250× more than low-income earners in Europe. Today, that gap is down to 8–15× in Sweden, Denmark, Norway & the Netherlands — and 15–20× in Germany, France & Britain.
A striking drop in inequality.

October 27, 2025 at 4:41 PM
(4/9)
Other inequality indicators tell the same story.
A century ago, the richest 0.1% earned 150–250× more than low-income earners in Europe. Today, that gap is down to 8–15× in Sweden, Denmark, Norway & the Netherlands — and 15–20× in Germany, France & Britain.
A striking drop in inequality.
Other inequality indicators tell the same story.
A century ago, the richest 0.1% earned 150–250× more than low-income earners in Europe. Today, that gap is down to 8–15× in Sweden, Denmark, Norway & the Netherlands — and 15–20× in Germany, France & Britain.
A striking drop in inequality.
3/9 All rich countries—especially in Western and Nordic Europe—have undergone an enormous compression of income scales during the 20th century, while becoming significantly more productive.In Nordic Europe, the bottom posttax 50% share rose from little more than 15% in 1910 to almost 40% in 1980-90.


October 27, 2025 at 4:41 PM
3/9 All rich countries—especially in Western and Nordic Europe—have undergone an enormous compression of income scales during the 20th century, while becoming significantly more productive.In Nordic Europe, the bottom posttax 50% share rose from little more than 15% in 1910 to almost 40% in 1980-90.
📆 Save the date: the 3rd edition of the World Inequality Conference will take place on 4–5 June 2026 at Paris School of Economics @pse.bsky.social
The call for papers is open until December 1.
🔗 More details & submission: inequalitylab.world/en/event/wor...
The call for papers is open until December 1.
🔗 More details & submission: inequalitylab.world/en/event/wor...


September 17, 2025 at 2:59 PM
📆 Save the date: the 3rd edition of the World Inequality Conference will take place on 4–5 June 2026 at Paris School of Economics @pse.bsky.social
The call for papers is open until December 1.
🔗 More details & submission: inequalitylab.world/en/event/wor...
The call for papers is open until December 1.
🔗 More details & submission: inequalitylab.world/en/event/wor...
3️⃣ Over the long run, public-private splits varied widely. 19th-century Britain had huge negative public wealth (250–300% of GDP). The US also showed negative wealth in the late 20th/early 21st century, mostly foreign. By contrast, China today has substantial positive public wealth.


September 15, 2025 at 9:01 AM
3️⃣ Over the long run, public-private splits varied widely. 19th-century Britain had huge negative public wealth (250–300% of GDP). The US also showed negative wealth in the late 20th/early 21st century, mostly foreign. By contrast, China today has substantial positive public wealth.
2️⃣ Private wealth is at record highs in all advanced regions.
Public wealth, by contrast, has declined to turn negative in North America, fall near zero in Europe, while East Asia has stabilized with 25-30% of national wealth in public hands.
Public wealth, by contrast, has declined to turn negative in North America, fall near zero in Europe, while East Asia has stabilized with 25-30% of national wealth in public hands.


September 15, 2025 at 9:01 AM
2️⃣ Private wealth is at record highs in all advanced regions.
Public wealth, by contrast, has declined to turn negative in North America, fall near zero in Europe, while East Asia has stabilized with 25-30% of national wealth in public hands.
Public wealth, by contrast, has declined to turn negative in North America, fall near zero in Europe, while East Asia has stabilized with 25-30% of national wealth in public hands.
1️⃣ Wealth has risen much faster than income since 1980.
Global wealth-income ratios have risen dramatically from about 390% of world net domestic product in 1980 to over 625% in 2025. This surge reflects both higher savings and strong capital gains, especially in housing and equity markets.
Global wealth-income ratios have risen dramatically from about 390% of world net domestic product in 1980 to over 625% in 2025. This surge reflects both higher savings and strong capital gains, especially in housing and equity markets.

September 15, 2025 at 9:01 AM
1️⃣ Wealth has risen much faster than income since 1980.
Global wealth-income ratios have risen dramatically from about 390% of world net domestic product in 1980 to over 625% in 2025. This surge reflects both higher savings and strong capital gains, especially in housing and equity markets.
Global wealth-income ratios have risen dramatically from about 390% of world net domestic product in 1980 to over 625% in 2025. This surge reflects both higher savings and strong capital gains, especially in housing and equity markets.
Now available in english *A History of Political Conflict. Elections and Social Inequalities in France 1789-2022* 📚
Our book with Julia Cagé is out at @harvardpress.bsky.social >>> www.hup.harvard.edu/books/978067...
All data sets available below 👇
Our book with Julia Cagé is out at @harvardpress.bsky.social >>> www.hup.harvard.edu/books/978067...
All data sets available below 👇

September 5, 2025 at 8:37 AM
Now available in english *A History of Political Conflict. Elections and Social Inequalities in France 1789-2022* 📚
Our book with Julia Cagé is out at @harvardpress.bsky.social >>> www.hup.harvard.edu/books/978067...
All data sets available below 👇
Our book with Julia Cagé is out at @harvardpress.bsky.social >>> www.hup.harvard.edu/books/978067...
All data sets available below 👇
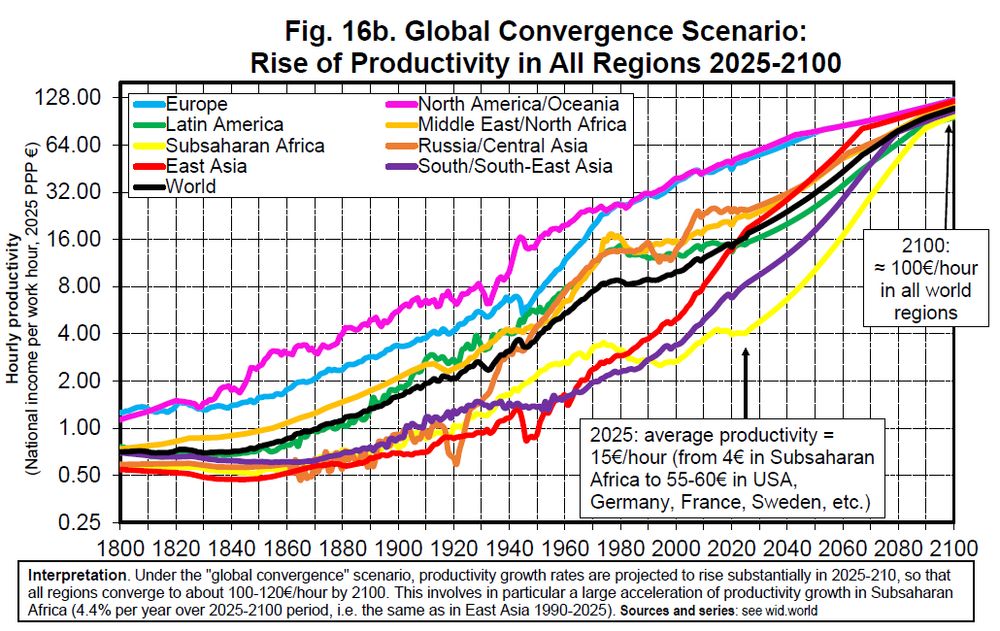
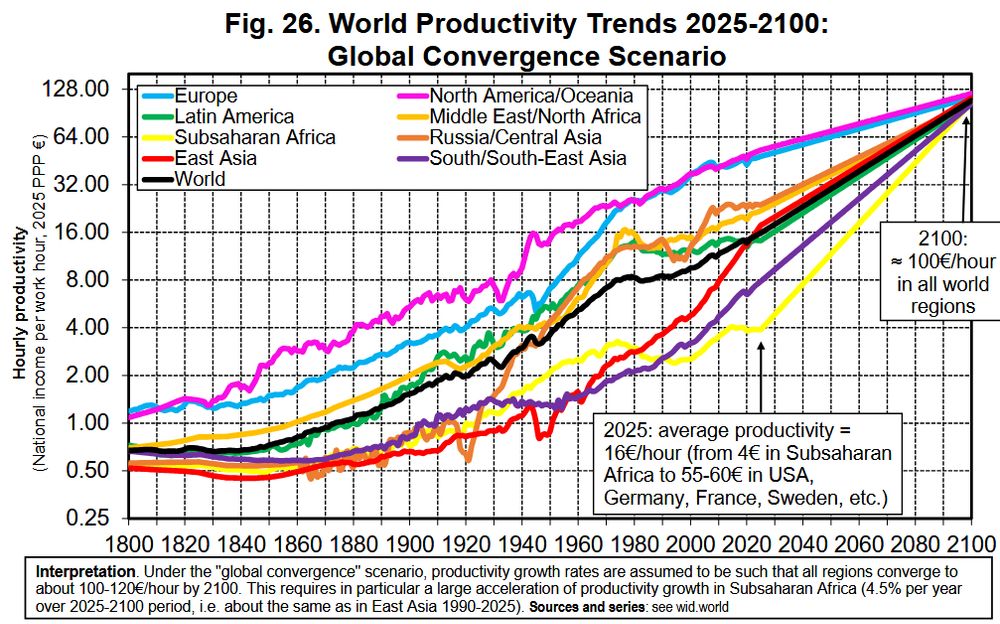
📈 In a more optimistic scenario, if all countries invested 38% of GDP in health & education, global productivity could rise to 100€/hour. Everyone gains: North America could hit 120€/hour (up from 80€), Sub-Saharan Africa 100€ (up from 9€).
[9/10]
[9/10]
July 3, 2025 at 8:18 AM
📈 In a more optimistic scenario, if all countries invested 38% of GDP in health & education, global productivity could rise to 100€/hour. Everyone gains: North America could hit 120€/hour (up from 80€), Sub-Saharan Africa 100€ (up from 9€).
[9/10]
[9/10]
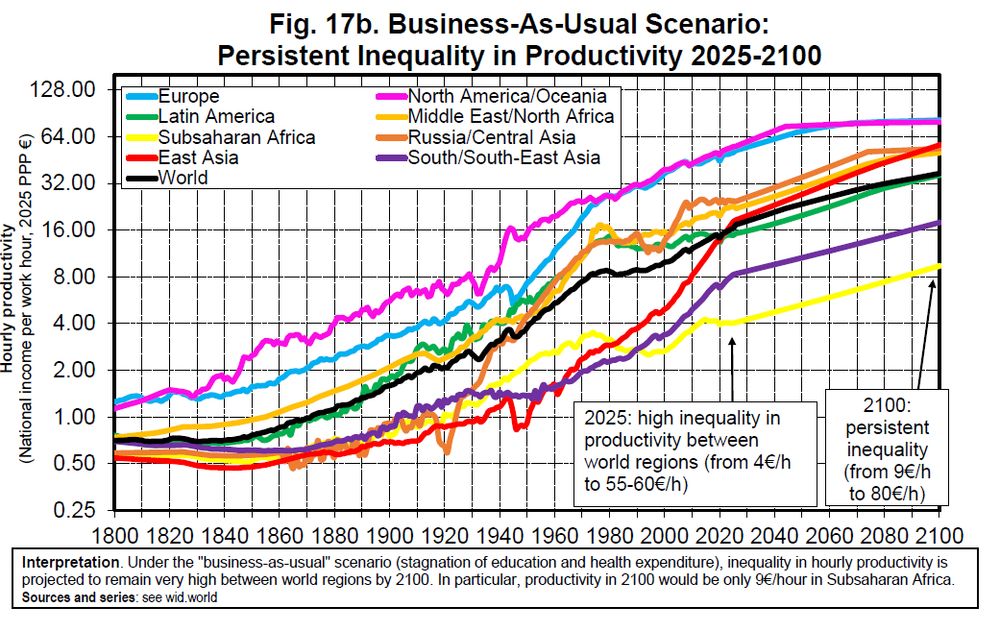
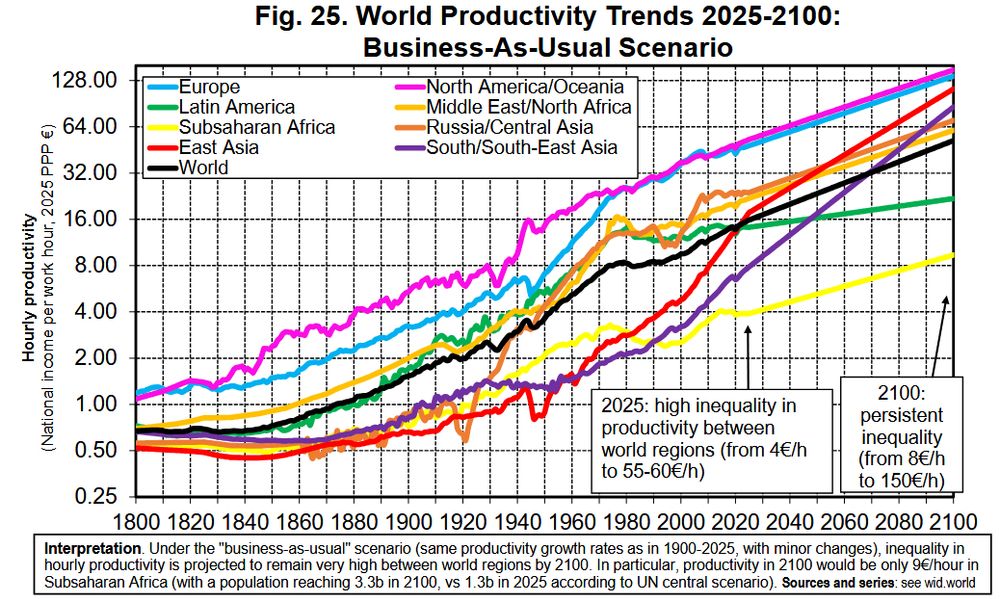
📉In a “business-as- usual” scenario where education & health spending stalls, the productivity gaps persists. By 2100, productivity would stay at ~9€/hour in Sub-Saharan Africa vs 80€ in Europe & North America.
[8/10]
[8/10]
July 3, 2025 at 8:18 AM
📉In a “business-as- usual” scenario where education & health spending stalls, the productivity gaps persists. By 2100, productivity would stay at ~9€/hour in Sub-Saharan Africa vs 80€ in Europe & North America.
[8/10]
[8/10]
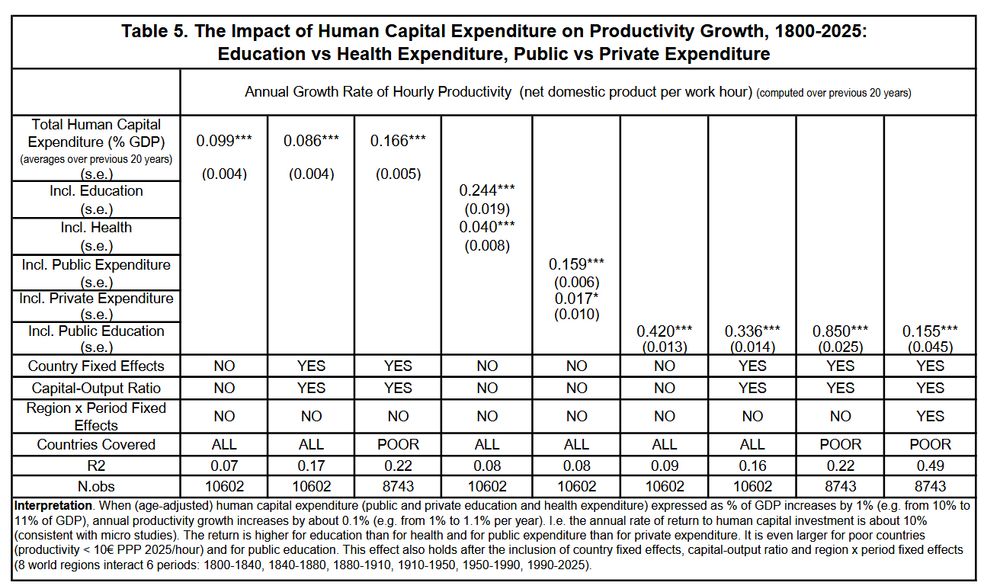
Since 1800, human capital spending has driven productivity. Average return on human capital > 10%/year. Returns are highest for:
• education (vs. health)
• public (vs. private) spending
• poorer countries — with returns up to 20% a year
[7/10]
• education (vs. health)
• public (vs. private) spending
• poorer countries — with returns up to 20% a year
[7/10]
July 3, 2025 at 8:18 AM
Since 1800, human capital spending has driven productivity. Average return on human capital > 10%/year. Returns are highest for:
• education (vs. health)
• public (vs. private) spending
• poorer countries — with returns up to 20% a year
[7/10]
• education (vs. health)
• public (vs. private) spending
• poorer countries — with returns up to 20% a year
[7/10]
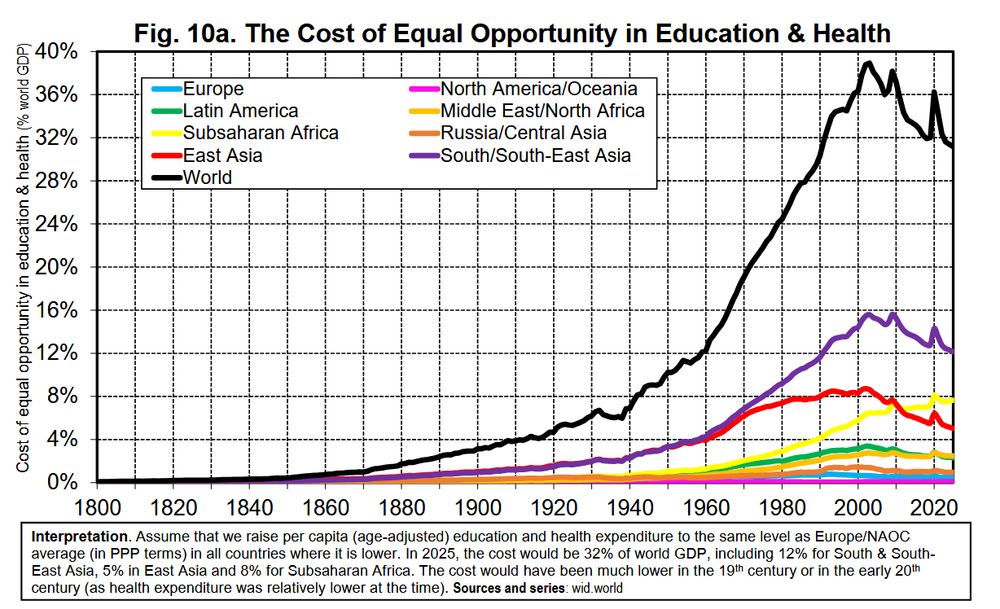
If we were to provide all children worldwide with the same average level of expenditure on education and health as is currently available in Europe and North America, it would cost 32% of the world’s GDP.
[6/10]
[6/10]
July 3, 2025 at 8:18 AM
If we were to provide all children worldwide with the same average level of expenditure on education and health as is currently available in Europe and North America, it would cost 32% of the world’s GDP.
[6/10]
[6/10]
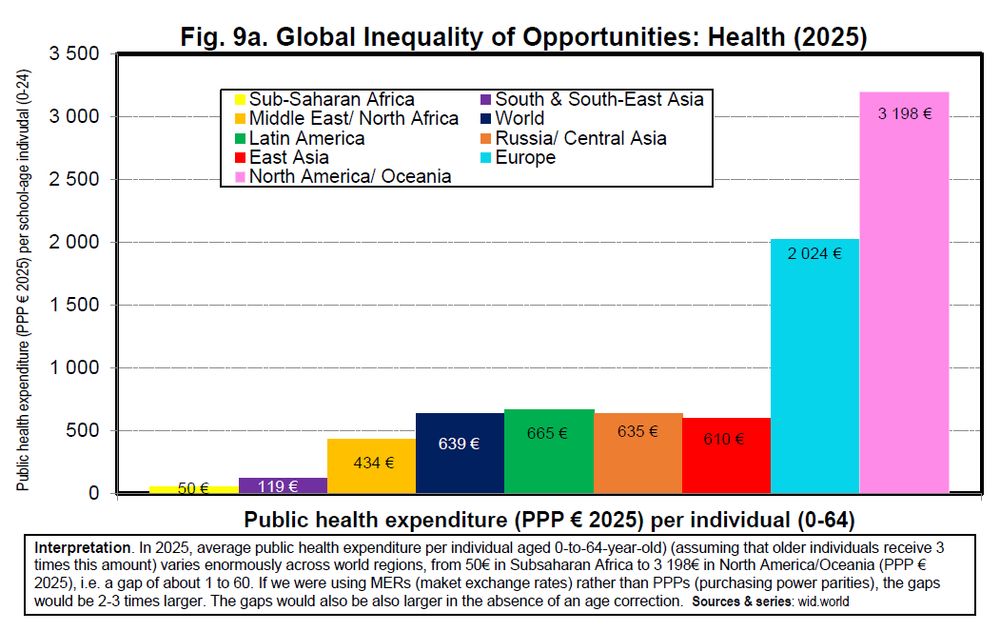
🏥Public health spending per person <65 ranges from 50€ in Sub-Saharan Africa to 3,198€ in North America (PPP € 2025) — a gap of 1 to 60.
The gap widens even more with private spending (though we know that high private health costs in the US don’t necessarily lead to better health outcomes).
[5/10]
The gap widens even more with private spending (though we know that high private health costs in the US don’t necessarily lead to better health outcomes).
[5/10]
July 3, 2025 at 8:18 AM
🏥Public health spending per person <65 ranges from 50€ in Sub-Saharan Africa to 3,198€ in North America (PPP € 2025) — a gap of 1 to 60.
The gap widens even more with private spending (though we know that high private health costs in the US don’t necessarily lead to better health outcomes).
[5/10]
The gap widens even more with private spending (though we know that high private health costs in the US don’t necessarily lead to better health outcomes).
[5/10]
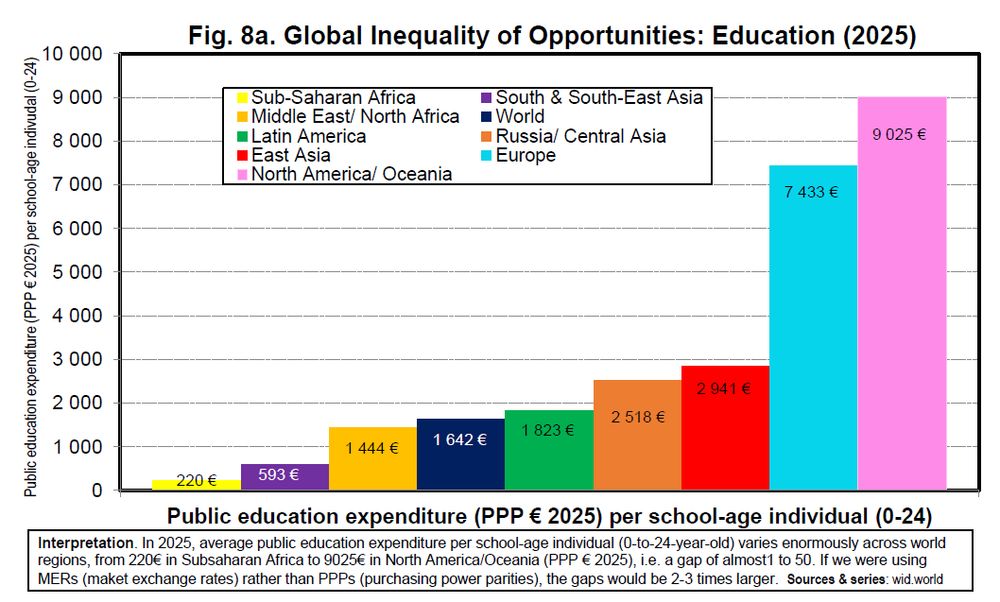
Health and education have improved globally—but the spending gap between rich and poor regions is still enormous.
🎓Today, a child in Sub-Saharan Africa receives 220€ in public education spending compared to 9,025€ in North America – a gap of almost 1 to 50.
[4/10]
🎓Today, a child in Sub-Saharan Africa receives 220€ in public education spending compared to 9,025€ in North America – a gap of almost 1 to 50.
[4/10]
July 3, 2025 at 8:18 AM
Health and education have improved globally—but the spending gap between rich and poor regions is still enormous.
🎓Today, a child in Sub-Saharan Africa receives 220€ in public education spending compared to 9,025€ in North America – a gap of almost 1 to 50.
[4/10]
🎓Today, a child in Sub-Saharan Africa receives 220€ in public education spending compared to 9,025€ in North America – a gap of almost 1 to 50.
[4/10]
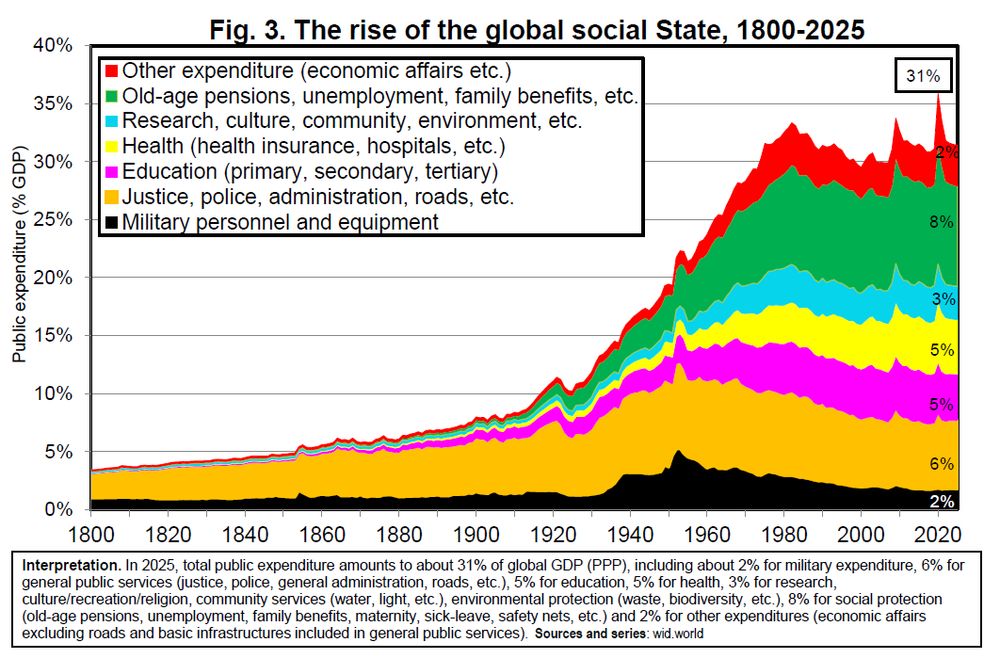
Total public expenditure rose from 3% of global GDP in 1800 to 31% today, largely due to rising spending on health, education, and social protection.
This reflects the expansion of the “global social state”, supported by states’ growing capacity to collect direct income taxes & social contributions.
This reflects the expansion of the “global social state”, supported by states’ growing capacity to collect direct income taxes & social contributions.
July 3, 2025 at 8:18 AM
Total public expenditure rose from 3% of global GDP in 1800 to 31% today, largely due to rising spending on health, education, and social protection.
This reflects the expansion of the “global social state”, supported by states’ growing capacity to collect direct income taxes & social contributions.
This reflects the expansion of the “global social state”, supported by states’ growing capacity to collect direct income taxes & social contributions.
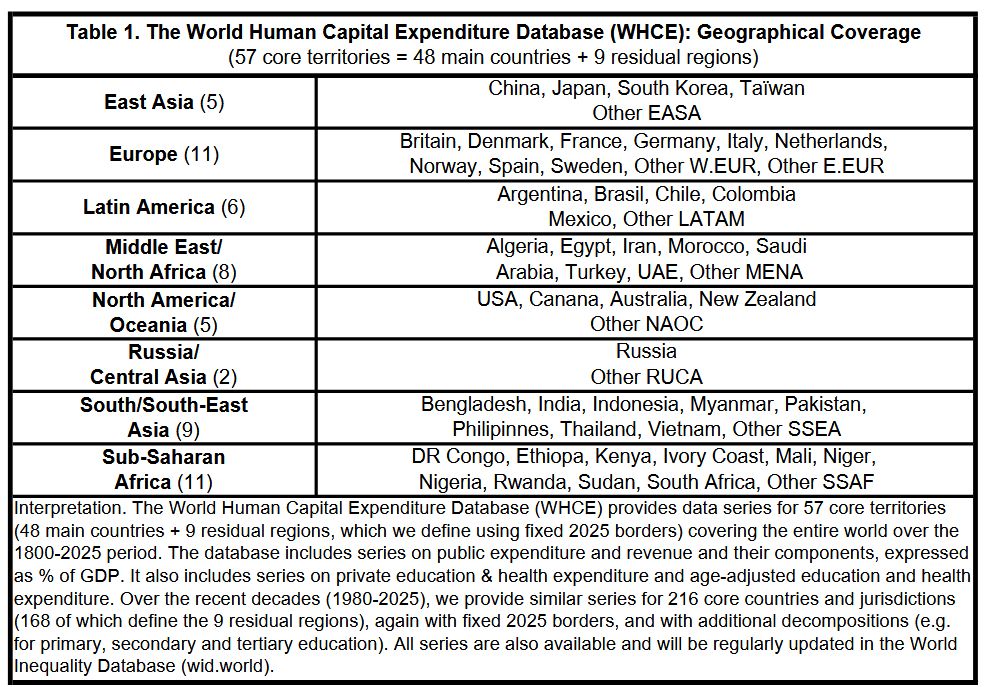
The study draws on a new global historical database on public expenditure and revenue and their components, with a focus on education and health. This is the first database of its kind to cover all world regions over the period from 1800 to 2025.
[2/10]
[2/10]
July 3, 2025 at 8:18 AM
The study draws on a new global historical database on public expenditure and revenue and their components, with a focus on education and health. This is the first database of its kind to cover all world regions over the period from 1800 to 2025.
[2/10]
[2/10]
📄 So far, 2 of 8 building blocks of the #GlobalJusticeProject have been published:
1️⃣Global Labour Hours in Paid and Unpaid Work wid.world/document/glo...
2️⃣Unequal Exchange and North-South Relations wid.world/document/une...
1️⃣Global Labour Hours in Paid and Unpaid Work wid.world/document/glo...
2️⃣Unequal Exchange and North-South Relations wid.world/document/une...
June 19, 2025 at 2:35 PM
📄 So far, 2 of 8 building blocks of the #GlobalJusticeProject have been published:
1️⃣Global Labour Hours in Paid and Unpaid Work wid.world/document/glo...
2️⃣Unequal Exchange and North-South Relations wid.world/document/une...
1️⃣Global Labour Hours in Paid and Unpaid Work wid.world/document/glo...
2️⃣Unequal Exchange and North-South Relations wid.world/document/une...
A BAU scenario is unsustainable.
But if we invest in human capital and infrastructure in the Global South, the world in 2100 could look radically different:
💶 Productivity converging to ~€100/hour
🕒 Less working hours for all
♀️ Drop in gender gaps
🌍 Labor shift away from high-pollution sectors
[7/8]
But if we invest in human capital and infrastructure in the Global South, the world in 2100 could look radically different:
💶 Productivity converging to ~€100/hour
🕒 Less working hours for all
♀️ Drop in gender gaps
🌍 Labor shift away from high-pollution sectors
[7/8]
June 16, 2025 at 1:02 PM
A BAU scenario is unsustainable.
But if we invest in human capital and infrastructure in the Global South, the world in 2100 could look radically different:
💶 Productivity converging to ~€100/hour
🕒 Less working hours for all
♀️ Drop in gender gaps
🌍 Labor shift away from high-pollution sectors
[7/8]
But if we invest in human capital and infrastructure in the Global South, the world in 2100 could look radically different:
💶 Productivity converging to ~€100/hour
🕒 Less working hours for all
♀️ Drop in gender gaps
🌍 Labor shift away from high-pollution sectors
[7/8]
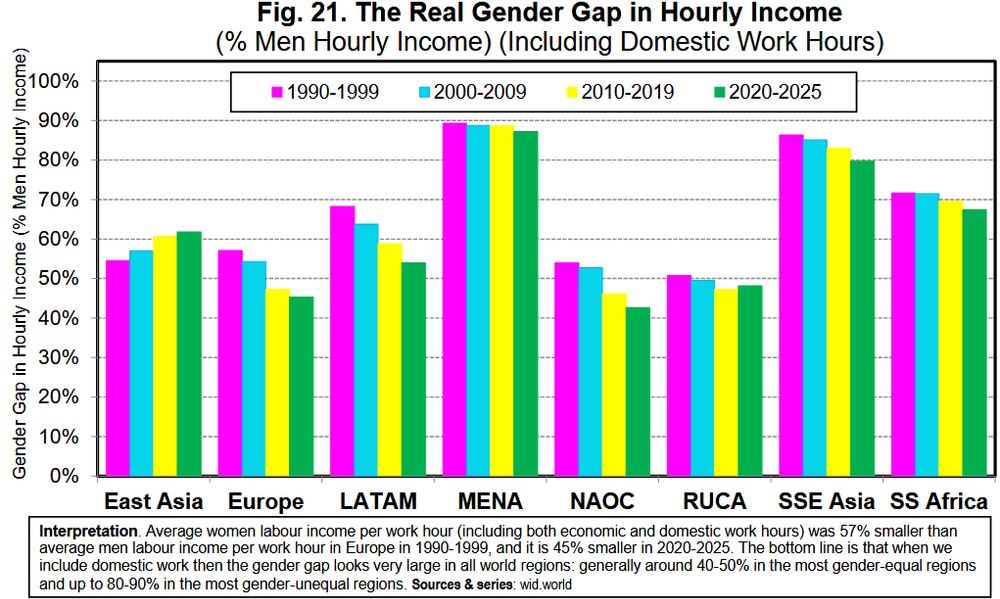
💰Women are also paid less than men – far less than previously thought.
When unpaid domestic work is factored in, the “real” gender pay gap in hourly earnings rises to 40–50% in high-income countries—double the conventional estimates of 10–20%.
[6/8]
When unpaid domestic work is factored in, the “real” gender pay gap in hourly earnings rises to 40–50% in high-income countries—double the conventional estimates of 10–20%.
[6/8]
June 16, 2025 at 1:02 PM
💰Women are also paid less than men – far less than previously thought.
When unpaid domestic work is factored in, the “real” gender pay gap in hourly earnings rises to 40–50% in high-income countries—double the conventional estimates of 10–20%.
[6/8]
When unpaid domestic work is factored in, the “real” gender pay gap in hourly earnings rises to 40–50% in high-income countries—double the conventional estimates of 10–20%.
[6/8]
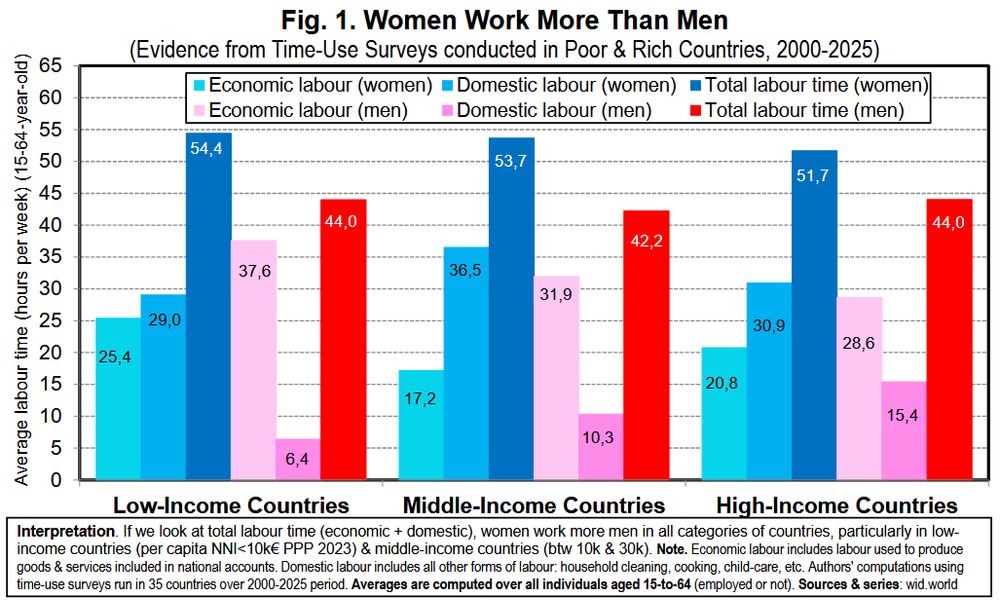
⚖️ Women work longer hours than men - but much of that work is unpaid and invisible.
Women provide fewer hours of economic labour than men, but significantly more hours of (unpaid) domestic labour, particularly in low- and middle-income countries.
[5/8]
Women provide fewer hours of economic labour than men, but significantly more hours of (unpaid) domestic labour, particularly in low- and middle-income countries.
[5/8]
June 16, 2025 at 1:02 PM
⚖️ Women work longer hours than men - but much of that work is unpaid and invisible.
Women provide fewer hours of economic labour than men, but significantly more hours of (unpaid) domestic labour, particularly in low- and middle-income countries.
[5/8]
Women provide fewer hours of economic labour than men, but significantly more hours of (unpaid) domestic labour, particularly in low- and middle-income countries.
[5/8]
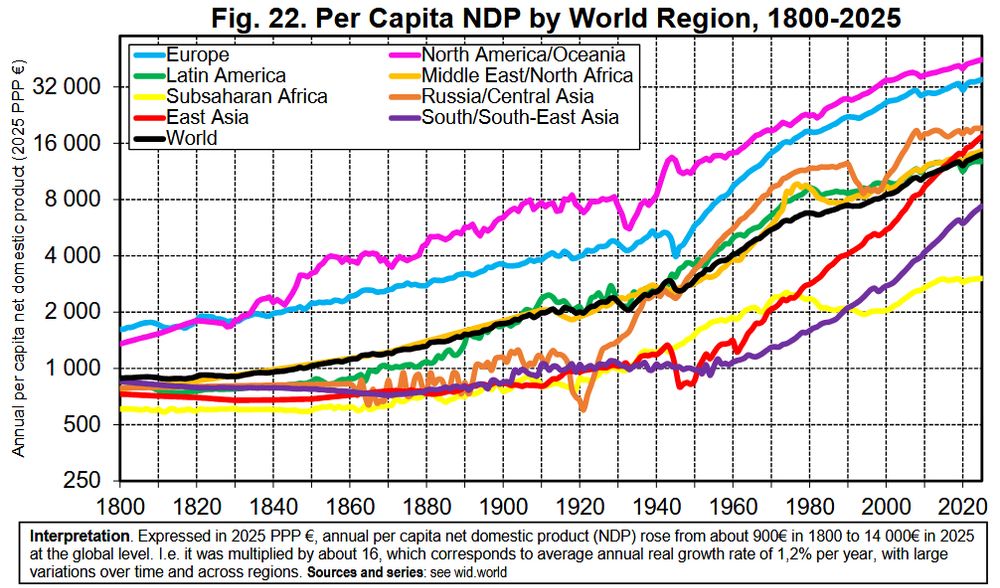
📈A steady rise in productivity has accompanied the long-term global reduction in working hours.
At the global level, hourly productivity (net domestic product per work hour) rose from 0.7€ in 1800 to 16€ in 2025 (PPP, 2025 €).
[4/8]
At the global level, hourly productivity (net domestic product per work hour) rose from 0.7€ in 1800 to 16€ in 2025 (PPP, 2025 €).
[4/8]
June 16, 2025 at 1:02 PM
📈A steady rise in productivity has accompanied the long-term global reduction in working hours.
At the global level, hourly productivity (net domestic product per work hour) rose from 0.7€ in 1800 to 16€ in 2025 (PPP, 2025 €).
[4/8]
At the global level, hourly productivity (net domestic product per work hour) rose from 0.7€ in 1800 to 16€ in 2025 (PPP, 2025 €).
[4/8]
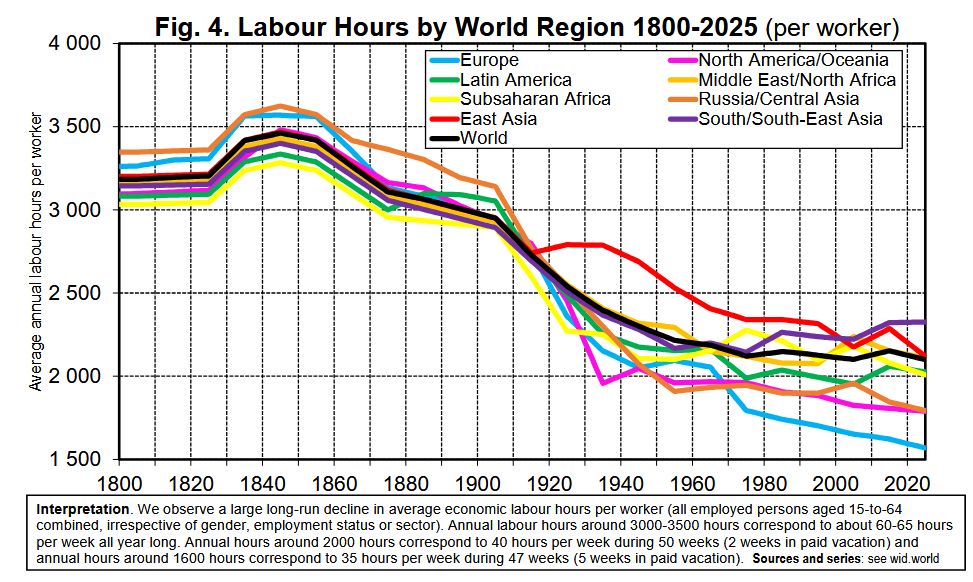
📉 Over two centuries, global work hours have fallen significantly (-34%), from 3,200 hours (≈ 60-65 hours per week all year long) to 2,100 hours (≈ 40 hours per week including two weeks in paid vacation).
This happened through collective mobilizations, changing institutions and social norms.
[3/8]
This happened through collective mobilizations, changing institutions and social norms.
[3/8]
June 16, 2025 at 1:02 PM
📉 Over two centuries, global work hours have fallen significantly (-34%), from 3,200 hours (≈ 60-65 hours per week all year long) to 2,100 hours (≈ 40 hours per week including two weeks in paid vacation).
This happened through collective mobilizations, changing institutions and social norms.
[3/8]
This happened through collective mobilizations, changing institutions and social norms.
[3/8]
With fairer commodity prices, poorer countries would have had surpluses to invest in infrastructures, education & health.
If rich countries had absorbed the cost through reduced elite consumption, we could have reached near-complete productivity convergence between North and South by 2025.
[6/8]
If rich countries had absorbed the cost through reduced elite consumption, we could have reached near-complete productivity convergence between North and South by 2025.
[6/8]

June 9, 2025 at 1:37 PM
With fairer commodity prices, poorer countries would have had surpluses to invest in infrastructures, education & health.
If rich countries had absorbed the cost through reduced elite consumption, we could have reached near-complete productivity convergence between North and South by 2025.
[6/8]
If rich countries had absorbed the cost through reduced elite consumption, we could have reached near-complete productivity convergence between North and South by 2025.
[6/8]