


Michelle Bowen
@stattymichelle.bsky.social
Date Geek| Coffee Addict ☕️| Bookworm 📚| Lover of the outdoors 🦅☀️| Government Analyst| RSS Statistical Ambassador| Views my own
Reposted by Michelle Bowen

We’ve partnered with the Government Statistical Service to explore the future of the stats profession
How will the role change over the next decade & what skills will make it future-ready?
We would love your thoughts on this, fill in this short form by 28 July: forms.office.com/pages/respon...
How will the role change over the next decade & what skills will make it future-ready?
We would love your thoughts on this, fill in this short form by 28 July: forms.office.com/pages/respon...
May 15, 2025 at 9:42 AM
We’ve partnered with the Government Statistical Service to explore the future of the stats profession
How will the role change over the next decade & what skills will make it future-ready?
We would love your thoughts on this, fill in this short form by 28 July: forms.office.com/pages/respon...
How will the role change over the next decade & what skills will make it future-ready?
We would love your thoughts on this, fill in this short form by 28 July: forms.office.com/pages/respon...
Turns out, I couldn’t resist the pull of the stats palace for long!
I’m very excited to return to ONS as Head of the Data Quality Hub.
Can’t wait to get stuck in!
I’m very excited to return to ONS as Head of the Data Quality Hub.
Can’t wait to get stuck in!

a sign that says i 'm back next to an orange box
ALT: a sign that says i 'm back next to an orange box
media.tenor.com
May 1, 2025 at 5:36 PM
Turns out, I couldn’t resist the pull of the stats palace for long!
I’m very excited to return to ONS as Head of the Data Quality Hub.
Can’t wait to get stuck in!
I’m very excited to return to ONS as Head of the Data Quality Hub.
Can’t wait to get stuck in!
Spent the day at Bletchley Park, and wow, what an experience! As a statistician, seeing the birthplace of so many concepts that shaped modern analytics and AI was both eye-opening and inspiring. Can’t stop thinking about it!

February 22, 2025 at 12:29 PM
Spent the day at Bletchley Park, and wow, what an experience! As a statistician, seeing the birthplace of so many concepts that shaped modern analytics and AI was both eye-opening and inspiring. Can’t stop thinking about it!
Reposted by Michelle Bowen
Our Stats Ambassador Ben Parker delves into how maths and stats can help you grab the prize pot in The Traitors 👇
www.ben-parker.co.uk?p=215
www.ben-parker.co.uk?p=215

a woman in a black hood holds her finger to her lips in front of bbc
ALT: a woman in a black hood holds her finger to her lips in front of bbc
media.tenor.com
January 24, 2025 at 9:28 AM
Our Stats Ambassador Ben Parker delves into how maths and stats can help you grab the prize pot in The Traitors 👇
www.ben-parker.co.uk?p=215
www.ben-parker.co.uk?p=215
Reposted by Michelle Bowen

Many struggle with writing alt text for charts and other other data visualizations. Amy Cesal's "Writing Alt Text for Data Visualization" hammers home the importance of explaining the chart type, the type of data, and the reason for the chart.
medium.com/nightingale/...
medium.com/nightingale/...
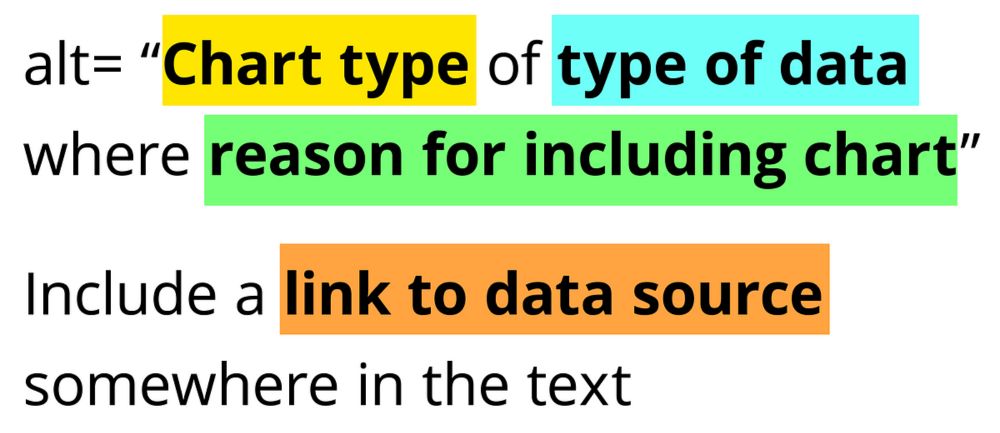
Writing Alt Text for Data Visualization
How do you write text that conveys the whole meaning of a visualization? You probably can’t. But that doesn’t mean that you shouldn’t try
medium.com
December 5, 2024 at 3:17 PM
Many struggle with writing alt text for charts and other other data visualizations. Amy Cesal's "Writing Alt Text for Data Visualization" hammers home the importance of explaining the chart type, the type of data, and the reason for the chart.
medium.com/nightingale/...
medium.com/nightingale/...
Reposted by Michelle Bowen

#TodayinHistory #dataviz #Onthisday #OTD 📊
A big day in the Milestones of #dataviz calendar:
📅Nov 20, 1869 Charles Joseph Minard published his iconic flow map graphic of Napoleon's March on Moscow,
some have called the best graphic ever produced.
A big day in the Milestones of #dataviz calendar:
📅Nov 20, 1869 Charles Joseph Minard published his iconic flow map graphic of Napoleon's March on Moscow,
some have called the best graphic ever produced.


November 20, 2024 at 2:03 AM
#TodayinHistory #dataviz #Onthisday #OTD 📊
A big day in the Milestones of #dataviz calendar:
📅Nov 20, 1869 Charles Joseph Minard published his iconic flow map graphic of Napoleon's March on Moscow,
some have called the best graphic ever produced.
A big day in the Milestones of #dataviz calendar:
📅Nov 20, 1869 Charles Joseph Minard published his iconic flow map graphic of Napoleon's March on Moscow,
some have called the best graphic ever produced.
Awkward first post alert: Joined Bluesky because I couldn’t resist the FOMO. I heard this is where the cool kids hang out these days! Now let’s pretend I know what I am doing here!

a man wearing a hat is standing in front of a net and says hello .
ALT: a man wearing a hat is standing in front of a net and says hello .
media.tenor.com
November 16, 2024 at 7:51 AM
Awkward first post alert: Joined Bluesky because I couldn’t resist the FOMO. I heard this is where the cool kids hang out these days! Now let’s pretend I know what I am doing here!