


soeun kim
@soeundataviz.bsky.social
data viz beginner!
south korea | still taking grasp of everything about data viz, would love to be part of the community
south korea | still taking grasp of everything about data viz, would love to be part of the community
Reposted by soeun kim

January 7, 2026 at 4:20 PM
Reposted by soeun kim

Super excited to share the 0.6 update to my R package for text mining. Designed for students new to #RStats (and text mining), it’s nevertheless what I use in my own work. This update packs in a ton, but my favorite new features are methods logging and labels.
jmclawson.github.io/tmtyro/news/...
jmclawson.github.io/tmtyro/news/...


January 6, 2026 at 4:45 PM
Super excited to share the 0.6 update to my R package for text mining. Designed for students new to #RStats (and text mining), it’s nevertheless what I use in my own work. This update packs in a ton, but my favorite new features are methods logging and labels.
jmclawson.github.io/tmtyro/news/...
jmclawson.github.io/tmtyro/news/...
Reposted by soeun kim

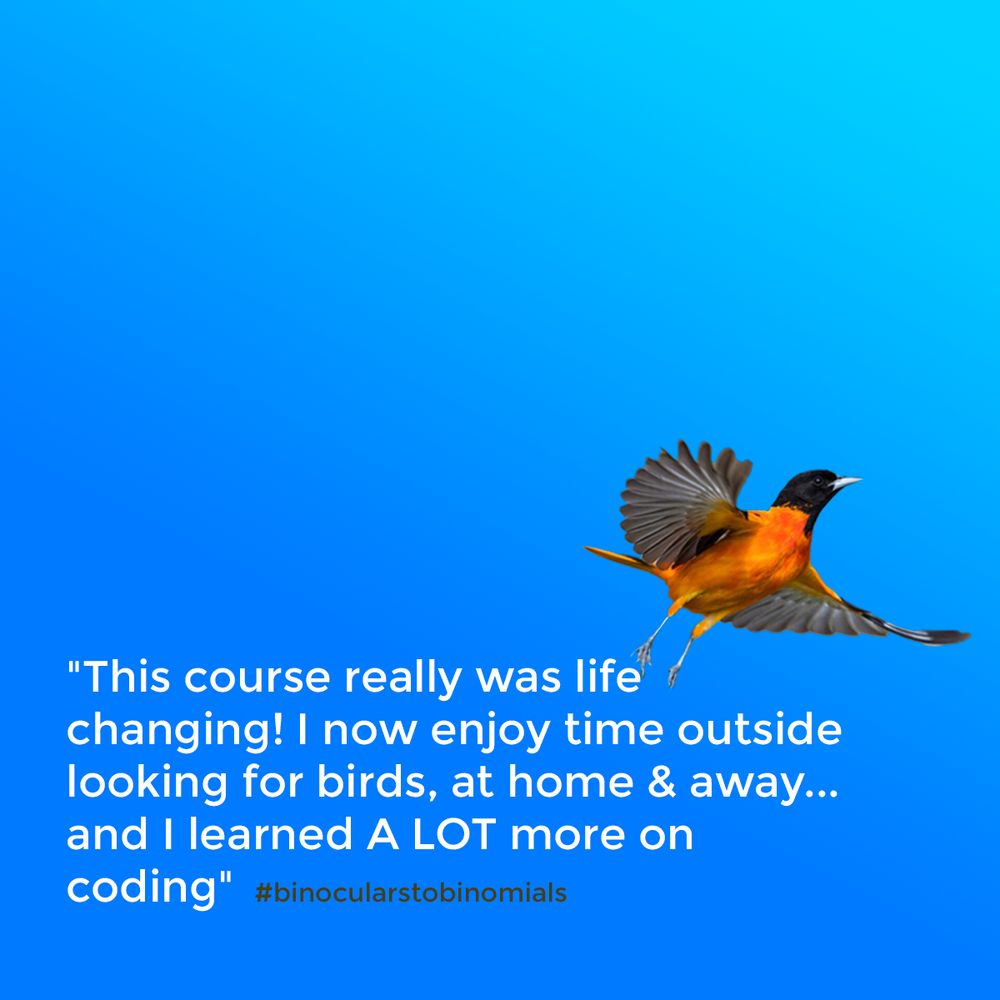
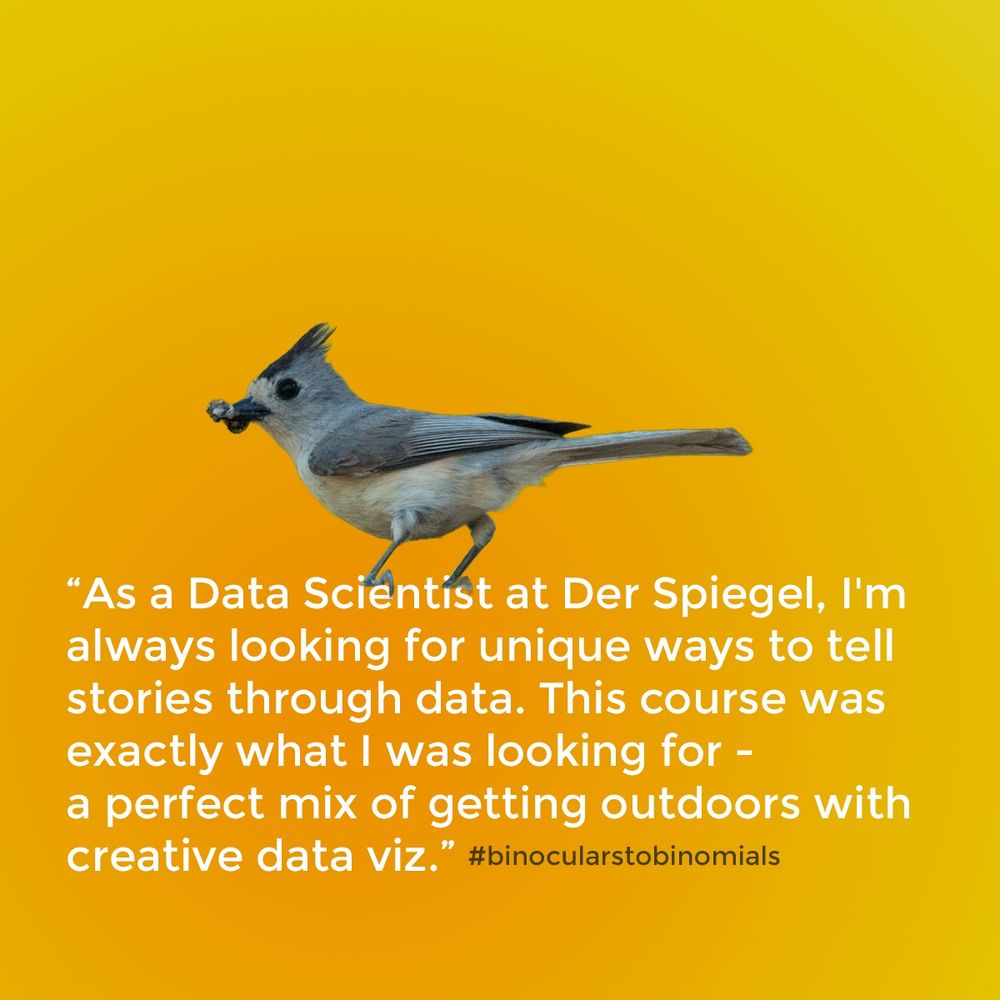
🚨🚨 🪶📊🎨 🚨🚨
Good news for all of you bird + data + art enthusiasts:
I've opened registration for THREE cohorts of Binoculars to Binomials starting in March.
One contemplative monthly cohort & two bi-weekly ones.
Guaranteed to change your 🧠!
www.jerthorp.me/learning
Good news for all of you bird + data + art enthusiasts:
I've opened registration for THREE cohorts of Binoculars to Binomials starting in March.
One contemplative monthly cohort & two bi-weekly ones.
Guaranteed to change your 🧠!
www.jerthorp.me/learning

December 28, 2025 at 3:09 PM
🚨🚨 🪶📊🎨 🚨🚨
Good news for all of you bird + data + art enthusiasts:
I've opened registration for THREE cohorts of Binoculars to Binomials starting in March.
One contemplative monthly cohort & two bi-weekly ones.
Guaranteed to change your 🧠!
www.jerthorp.me/learning
Good news for all of you bird + data + art enthusiasts:
I've opened registration for THREE cohorts of Binoculars to Binomials starting in March.
One contemplative monthly cohort & two bi-weekly ones.
Guaranteed to change your 🧠!
www.jerthorp.me/learning
Reposted by soeun kim

Brilliant choice of bivariate color palette in this map of water stress from @wriclimate.bsky.social & ESRI.
I love how it draws attention to areas with high demand for water with saturated colors, & distinguishes low & high availability with a striking change in hue.
via @dantoearth.bsky.social
I love how it draws attention to areas with high demand for water with saturated colors, & distinguishes low & high availability with a striking change in hue.
via @dantoearth.bsky.social


December 15, 2025 at 4:16 PM
Brilliant choice of bivariate color palette in this map of water stress from @wriclimate.bsky.social & ESRI.
I love how it draws attention to areas with high demand for water with saturated colors, & distinguishes low & high availability with a striking change in hue.
via @dantoearth.bsky.social
I love how it draws attention to areas with high demand for water with saturated colors, & distinguishes low & high availability with a striking change in hue.
via @dantoearth.bsky.social
Reposted by soeun kim

We’re excited to announce the winners of the 2025 Pudding Cup! Our entry pool was the strongest ever with close to 100 submissions.
Show our 3 winners some love 🫶 on this thread, and check out the full details and honorable mentions at the link:
pudding.cool/pudding-cup/
Show our 3 winners some love 🫶 on this thread, and check out the full details and honorable mentions at the link:
pudding.cool/pudding-cup/

The Pudding Cup
The Pudding's annual picks for the best visual and data-driven stories
pudding.cool
December 15, 2025 at 4:22 PM
We’re excited to announce the winners of the 2025 Pudding Cup! Our entry pool was the strongest ever with close to 100 submissions.
Show our 3 winners some love 🫶 on this thread, and check out the full details and honorable mentions at the link:
pudding.cool/pudding-cup/
Show our 3 winners some love 🫶 on this thread, and check out the full details and honorable mentions at the link:
pudding.cool/pudding-cup/
Reposted by soeun kim

“In recent weeks, nearly two dozen elected officials on both sides of the aisle said they were targeted after getting caught in the president's crosshairs.”
I got to contribute to this @NBCNews.com piece by Dareh Gregorian and Jiachuan Wu:
www.nbcnews.com/politics/don...
I got to contribute to this @NBCNews.com piece by Dareh Gregorian and Jiachuan Wu:
www.nbcnews.com/politics/don...

December 16, 2025 at 1:29 AM
“In recent weeks, nearly two dozen elected officials on both sides of the aisle said they were targeted after getting caught in the president's crosshairs.”
I got to contribute to this @NBCNews.com piece by Dareh Gregorian and Jiachuan Wu:
www.nbcnews.com/politics/don...
I got to contribute to this @NBCNews.com piece by Dareh Gregorian and Jiachuan Wu:
www.nbcnews.com/politics/don...
Reposted by soeun kim

I’m thrilled to share that my new book (Spatial Data Management with DuckDB) is now published! 🎉
At 430 pages, this book provides a practical, hands-on guide to scalable geospatial analytics and visualization using DuckDB. All code examples are open-source and freely available on GitHub.
At 430 pages, this book provides a practical, hands-on guide to scalable geospatial analytics and visualization using DuckDB. All code examples are open-source and freely available on GitHub.

November 15, 2025 at 6:44 PM
I’m thrilled to share that my new book (Spatial Data Management with DuckDB) is now published! 🎉
At 430 pages, this book provides a practical, hands-on guide to scalable geospatial analytics and visualization using DuckDB. All code examples are open-source and freely available on GitHub.
At 430 pages, this book provides a practical, hands-on guide to scalable geospatial analytics and visualization using DuckDB. All code examples are open-source and freely available on GitHub.
Reposted by soeun kim

SveltePlot 0.7 is out! Lots of new features since the last time I posted here: 🎉 jitter transform, 🐝 dodge transform (for beeswarm plots), 🎉 stackMarimekko, 📸 image mark, and most recently the 🧇 waffle mark! And the website now features a ton of examples.
➡️ svelteplot.dev
➡️ svelteplot.dev

November 16, 2025 at 12:24 PM
SveltePlot 0.7 is out! Lots of new features since the last time I posted here: 🎉 jitter transform, 🐝 dodge transform (for beeswarm plots), 🎉 stackMarimekko, 📸 image mark, and most recently the 🧇 waffle mark! And the website now features a ton of examples.
➡️ svelteplot.dev
➡️ svelteplot.dev
Reposted by soeun kim

Quick thread on the BBC and the political and societal significance of recent developments:
One of the main reasons the UK has historically been so much less polarised than the US, is that Britain has a shared source of information, consumed and trusted by most people regardless of their politics.
One of the main reasons the UK has historically been so much less polarised than the US, is that Britain has a shared source of information, consumed and trusted by most people regardless of their politics.

November 10, 2025 at 1:43 PM
Quick thread on the BBC and the political and societal significance of recent developments:
One of the main reasons the UK has historically been so much less polarised than the US, is that Britain has a shared source of information, consumed and trusted by most people regardless of their politics.
One of the main reasons the UK has historically been so much less polarised than the US, is that Britain has a shared source of information, consumed and trusted by most people regardless of their politics.
Reposted by soeun kim

Hey Bluesky! You can follow the @economist.com data team here if you want to see more of our analysis and charts in your feed go.bsky.app/BJSsLHw
November 28, 2024 at 3:32 PM
Hey Bluesky! You can follow the @economist.com data team here if you want to see more of our analysis and charts in your feed go.bsky.app/BJSsLHw
Reposted by soeun kim

Have you ever wanted to make your own climate warming stripes plot? It's super easy with #rstats! (code here gist.github.com/andrewheiss/... )

November 7, 2025 at 10:14 PM
Have you ever wanted to make your own climate warming stripes plot? It's super easy with #rstats! (code here gist.github.com/andrewheiss/... )
Reposted by soeun kim

We are looking for #rstats community feedback on 3 new dplyr functions!
We're aiming to expand the `filter()` family:
- `filter()` to keep rows
- `filter_out()` to drop rows
- `when_any()` and `when_all()` as modifiers
Read more and leave feedback here:
github.com/tidyverse/ti...
We're aiming to expand the `filter()` family:
- `filter()` to keep rows
- `filter_out()` to drop rows
- `when_any()` and `when_all()` as modifiers
Read more and leave feedback here:
github.com/tidyverse/ti...

November 7, 2025 at 4:03 PM
We are looking for #rstats community feedback on 3 new dplyr functions!
We're aiming to expand the `filter()` family:
- `filter()` to keep rows
- `filter_out()` to drop rows
- `when_any()` and `when_all()` as modifiers
Read more and leave feedback here:
github.com/tidyverse/ti...
We're aiming to expand the `filter()` family:
- `filter()` to keep rows
- `filter_out()` to drop rows
- `when_any()` and `when_all()` as modifiers
Read more and leave feedback here:
github.com/tidyverse/ti...
Reposted by soeun kim

Do you teach #rstats? Do your students complain about how lame and old-fashioned dplyr is? Don't worry: I have the solution for you: github.com/hadley/genzp....
genzplyr is dplyr, but bussin fr fr no cap.
genzplyr is dplyr, but bussin fr fr no cap.

GitHub - hadley/genzplyr: dplyr but make it bussin fr fr no cap
dplyr but make it bussin fr fr no cap. Contribute to hadley/genzplyr development by creating an account on GitHub.
github.com
November 6, 2025 at 11:25 PM
Do you teach #rstats? Do your students complain about how lame and old-fashioned dplyr is? Don't worry: I have the solution for you: github.com/hadley/genzp....
genzplyr is dplyr, but bussin fr fr no cap.
genzplyr is dplyr, but bussin fr fr no cap.
Reposted by soeun kim

The Open Visualization Academy's newsletter is expanding! New contributor: Melissa Strong, who is also co-designing the OVA's website. Her first article in a series of 6: 'How Open Source Fuels the Future of Data Visualization (Part 1)
' openvisualizationacademy.beehiiv.com/p/how-open-s...
' openvisualizationacademy.beehiiv.com/p/how-open-s...

How Open Source Fuels the Future of Data Visualization (Part 1)
Free software is a matter of liberty, not price. Think of “free” as in “free speech,” not “free beer.” — Richard Stallman
openvisualizationacademy.beehiiv.com
November 6, 2025 at 3:44 PM
The Open Visualization Academy's newsletter is expanding! New contributor: Melissa Strong, who is also co-designing the OVA's website. Her first article in a series of 6: 'How Open Source Fuels the Future of Data Visualization (Part 1)
' openvisualizationacademy.beehiiv.com/p/how-open-s...
' openvisualizationacademy.beehiiv.com/p/how-open-s...
Reposted by soeun kim

Now this is how you detect whether an election was stolen. Humans choose rounder numbers.
by @TheEconomist
by @TheEconomist

November 6, 2025 at 9:55 AM
Now this is how you detect whether an election was stolen. Humans choose rounder numbers.
by @TheEconomist
by @TheEconomist
Reposted by soeun kim

#30DayMapChallenge - November’s 30DayMapChallenge is fast approaching - and the daily themes for this year’s event have been released! googlemapsmania.blogspot.com/2025/10/30-d...

30 Day Map Challenge
Maps Mania is a blog dedicated to tracking the very best digital interactive maps on the internet and the tools used to create them.
googlemapsmania.blogspot.com
October 9, 2025 at 3:48 PM
#30DayMapChallenge - November’s 30DayMapChallenge is fast approaching - and the daily themes for this year’s event have been released! googlemapsmania.blogspot.com/2025/10/30-d...
Reposted by soeun kim

Woot, just submitted another dataset to #TidyTuesday and now there are 5 PRs waiting for Jon to review.
I screenrecorded the process, so if you want to see how EASY it is to contribute a dataset to this AMAZING #rstats community, check out this video.
youtu.be/Kp7pyYwLcwc
I screenrecorded the process, so if you want to see how EASY it is to contribute a dataset to this AMAZING #rstats community, check out this video.
youtu.be/Kp7pyYwLcwc
October 28, 2025 at 10:32 PM
Woot, just submitted another dataset to #TidyTuesday and now there are 5 PRs waiting for Jon to review.
I screenrecorded the process, so if you want to see how EASY it is to contribute a dataset to this AMAZING #rstats community, check out this video.
youtu.be/Kp7pyYwLcwc
I screenrecorded the process, so if you want to see how EASY it is to contribute a dataset to this AMAZING #rstats community, check out this video.
youtu.be/Kp7pyYwLcwc
Reposted by soeun kim
I ruptured my achilles in January. Couch-bound for most of the winter, I read over a dozen books about walking journeys. I was inspired. Obsessed? I decided to walk across Massachusetts.
You decide how to experience my story here: pudding.cool/2025/10/walk/
You decide how to experience my story here: pudding.cool/2025/10/walk/

What it’s like to walk across Massachusetts
A visually-aided journal of a very long walk home.
pudding.cool
October 22, 2025 at 7:05 PM
I ruptured my achilles in January. Couch-bound for most of the winter, I read over a dozen books about walking journeys. I was inspired. Obsessed? I decided to walk across Massachusetts.
You decide how to experience my story here: pudding.cool/2025/10/walk/
You decide how to experience my story here: pudding.cool/2025/10/walk/
Reposted by soeun kim

Big news out of @climatecentral.org today! We've brought back NOAA's billion dollar disaster dataset!
Check out our interactive website and bookmark it because there's more to come!
www.climatecentral.org/climate-serv...
Check out our interactive website and bookmark it because there's more to come!
www.climatecentral.org/climate-serv...
October 22, 2025 at 2:43 PM
Big news out of @climatecentral.org today! We've brought back NOAA's billion dollar disaster dataset!
Check out our interactive website and bookmark it because there's more to come!
www.climatecentral.org/climate-serv...
Check out our interactive website and bookmark it because there's more to come!
www.climatecentral.org/climate-serv...
Reposted by soeun kim

🌏 A compact snapshot on where people live around the globe (2023 data) — over 60% of #humans live in #Asia!
I originally created a more basic version for our new #ggplot2 [un]charted lesson on 🎨 "Color Choice" to discuss color accessibility:
👉 www.ggplot2-uncharted.com/module2/colo...
I originally created a more basic version for our new #ggplot2 [un]charted lesson on 🎨 "Color Choice" to discuss color accessibility:
👉 www.ggplot2-uncharted.com/module2/colo...

October 22, 2025 at 3:56 PM
🌏 A compact snapshot on where people live around the globe (2023 data) — over 60% of #humans live in #Asia!
I originally created a more basic version for our new #ggplot2 [un]charted lesson on 🎨 "Color Choice" to discuss color accessibility:
👉 www.ggplot2-uncharted.com/module2/colo...
I originally created a more basic version for our new #ggplot2 [un]charted lesson on 🎨 "Color Choice" to discuss color accessibility:
👉 www.ggplot2-uncharted.com/module2/colo...
Reposted by soeun kim
If you're trying to learn the birds in a place (either where you live or a travel spot), eBird has a quiz!
ebird.org/quiz/
You're also helping rate the quality of images.
I'm using this right now to brush up on the birds of Raja Ampat, where I'll be leading a trip in December.
ebird.org/quiz/
You're also helping rate the quality of images.
I'm using this right now to brush up on the birds of Raja Ampat, where I'll be leading a trip in December.
eBird Photo + Sound Quiz
Practice your skills. Help science.
ebird.org
October 17, 2025 at 11:51 AM
If you're trying to learn the birds in a place (either where you live or a travel spot), eBird has a quiz!
ebird.org/quiz/
You're also helping rate the quality of images.
I'm using this right now to brush up on the birds of Raja Ampat, where I'll be leading a trip in December.
ebird.org/quiz/
You're also helping rate the quality of images.
I'm using this right now to brush up on the birds of Raja Ampat, where I'll be leading a trip in December.
Reposted by soeun kim

New visual story: Bird migration is one of nature’s greatest spectacles — and scientists are uncovering extraordinary insights into how new threats are reshaping these epic journeys. Follow the remarkable travels of three birds as they fly across the planet. www.theguardian.com/environment/...
October 16, 2025 at 8:17 AM
New visual story: Bird migration is one of nature’s greatest spectacles — and scientists are uncovering extraordinary insights into how new threats are reshaping these epic journeys. Follow the remarkable travels of three birds as they fly across the planet. www.theguardian.com/environment/...
Reposted by soeun kim

New R package: gridmappr by Roger Beecham
It automates creating small multiple gridmap layouts by optimally placing geographic points into grid cells (inspired by Jo Wood’s Observable notebooks).
👉 github.com/rogerbeecham...
#RStats #RSpatial #DataViz #GISchat
It automates creating small multiple gridmap layouts by optimally placing geographic points into grid cells (inspired by Jo Wood’s Observable notebooks).
👉 github.com/rogerbeecham...
#RStats #RSpatial #DataViz #GISchat

October 15, 2025 at 1:04 PM
New R package: gridmappr by Roger Beecham
It automates creating small multiple gridmap layouts by optimally placing geographic points into grid cells (inspired by Jo Wood’s Observable notebooks).
👉 github.com/rogerbeecham...
#RStats #RSpatial #DataViz #GISchat
It automates creating small multiple gridmap layouts by optimally placing geographic points into grid cells (inspired by Jo Wood’s Observable notebooks).
👉 github.com/rogerbeecham...
#RStats #RSpatial #DataViz #GISchat
Reposted by soeun kim

📊 #Dataviz PSA: When using areas to depict numbers, make sure you are indeed scaling the *area*, and not the width/length/diameter of the circles (or other shapes). Because software such as Illustrator don’t let you specify the area directly, you need do a small calculation to get it right. 1/2

October 9, 2025 at 2:14 PM
📊 #Dataviz PSA: When using areas to depict numbers, make sure you are indeed scaling the *area*, and not the width/length/diameter of the circles (or other shapes). Because software such as Illustrator don’t let you specify the area directly, you need do a small calculation to get it right. 1/2
Reposted by soeun kim

Wondering if you can outsource your data viz work to ChatGPT? 📊
I tested out a few different generative AI tools, giving them prompts to visualise two different data sets. If you're interested in the results, you can read them here: nrennie.rbind.io/blog/gen-ai-...
#RStats #Python #DataViz #GenAI
I tested out a few different generative AI tools, giving them prompts to visualise two different data sets. If you're interested in the results, you can read them here: nrennie.rbind.io/blog/gen-ai-...
#RStats #Python #DataViz #GenAI

Generative AI for Data Visualisation – Nicola Rennie
Can generative AI create good data visualisations? This blog post compares the performance of ChatGPT, Claude, Copilot, and Gemini when presented with a generic request to visualise a dataset.
nrennie.rbind.io
October 9, 2025 at 9:57 AM
Wondering if you can outsource your data viz work to ChatGPT? 📊
I tested out a few different generative AI tools, giving them prompts to visualise two different data sets. If you're interested in the results, you can read them here: nrennie.rbind.io/blog/gen-ai-...
#RStats #Python #DataViz #GenAI
I tested out a few different generative AI tools, giving them prompts to visualise two different data sets. If you're interested in the results, you can read them here: nrennie.rbind.io/blog/gen-ai-...
#RStats #Python #DataViz #GenAI