


Robert McSweeney
@rtmcswee.carbonbrief.org
Senior Science Editor at Carbon Brief, with a fondness for baking and Arsenal FC. All opinions are my own, however dull they might be.
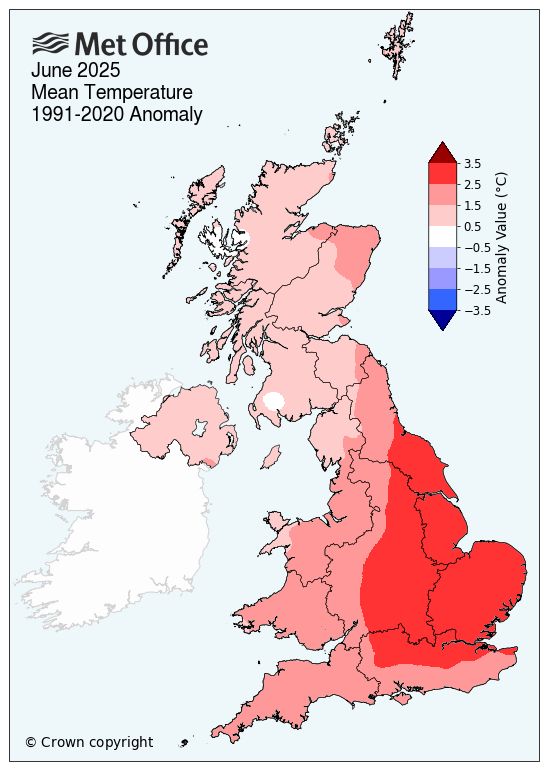
June was England's warmest on record and the UK's second warmest, according to the @metoffice.gov.uk
www.metoffice.gov.uk/about-us/new...
www.metoffice.gov.uk/about-us/new...
July 1, 2025 at 2:05 PM
June was England's warmest on record and the UK's second warmest, according to the @metoffice.gov.uk
www.metoffice.gov.uk/about-us/new...
www.metoffice.gov.uk/about-us/new...
More net-zero misinformation in the Daily Telegraph.
It claims that a proposed scheme to put the cost of recycling onto packaging producers, rather than local councils, is a “net-zero glass tax”.
It is about waste management, not net-zero.
Somehow, this made it onto the frontpage 🤦
It claims that a proposed scheme to put the cost of recycling onto packaging producers, rather than local councils, is a “net-zero glass tax”.
It is about waste management, not net-zero.
Somehow, this made it onto the frontpage 🤦


June 27, 2025 at 9:35 AM
More net-zero misinformation in the Daily Telegraph.
It claims that a proposed scheme to put the cost of recycling onto packaging producers, rather than local councils, is a “net-zero glass tax”.
It is about waste management, not net-zero.
Somehow, this made it onto the frontpage 🤦
It claims that a proposed scheme to put the cost of recycling onto packaging producers, rather than local councils, is a “net-zero glass tax”.
It is about waste management, not net-zero.
Somehow, this made it onto the frontpage 🤦
NOAA has announced it will no longer be updating its Billion Dollar Weather and Climate Disasters database.
(This is "in alignment with evolving priorities, statutory mandates & staffing changes")
Here are the *27* $1bn weather-related disasters that hit the US last year:
(This is "in alignment with evolving priorities, statutory mandates & staffing changes")
Here are the *27* $1bn weather-related disasters that hit the US last year:

May 9, 2025 at 10:02 AM
NOAA has announced it will no longer be updating its Billion Dollar Weather and Climate Disasters database.
(This is "in alignment with evolving priorities, statutory mandates & staffing changes")
Here are the *27* $1bn weather-related disasters that hit the US last year:
(This is "in alignment with evolving priorities, statutory mandates & staffing changes")
Here are the *27* $1bn weather-related disasters that hit the US last year:
Last year was the 4th warmest on record for the UK, says the @metoffice.bsky.social, behind 2022, 2023 and 2014.
www.metoffice.gov.uk/about-us/new...
www.metoffice.gov.uk/about-us/new...

January 2, 2025 at 2:13 PM
Last year was the 4th warmest on record for the UK, says the @metoffice.bsky.social, behind 2022, 2023 and 2014.
www.metoffice.gov.uk/about-us/new...
www.metoffice.gov.uk/about-us/new...
I'm at #AGU24 in Washington, DC all this week for @carbonbrief.org. I'm keen to hear about new climate-related research – do stop me to say hello or drop me a message!

December 9, 2024 at 1:38 PM
I'm at #AGU24 in Washington, DC all this week for @carbonbrief.org. I'm keen to hear about new climate-related research – do stop me to say hello or drop me a message!
The @carbonbrief.org sweepstake on when #COP29 will end has now closed.
We've had 200+ guesses submitted. On average, they put the final "gavel-down" moment in the small hours of Sunday morning:
Mean: Sunday 00:23
Median: Sunday 01:34
Mode (nearest hour): Sunday 03:00-04:00
We've had 200+ guesses submitted. On average, they put the final "gavel-down" moment in the small hours of Sunday morning:
Mean: Sunday 00:23
Median: Sunday 01:34
Mode (nearest hour): Sunday 03:00-04:00

November 21, 2024 at 9:23 AM
The @carbonbrief.org sweepstake on when #COP29 will end has now closed.
We've had 200+ guesses submitted. On average, they put the final "gavel-down" moment in the small hours of Sunday morning:
Mean: Sunday 00:23
Median: Sunday 01:34
Mode (nearest hour): Sunday 03:00-04:00
We've had 200+ guesses submitted. On average, they put the final "gavel-down" moment in the small hours of Sunday morning:
Mean: Sunday 00:23
Median: Sunday 01:34
Mode (nearest hour): Sunday 03:00-04:00
The @carbonbrief.org sweepstake on when #COP29 will formally end now has 112 guesses.
Lots of people going for Sunday morning!
Enter your exact day/time here if you want to join in: bit.ly/CBCOP29Gavel...
No prizes, just bragging rights!
Lots of people going for Sunday morning!
Enter your exact day/time here if you want to join in: bit.ly/CBCOP29Gavel...
No prizes, just bragging rights!

November 19, 2024 at 3:43 PM
The @carbonbrief.org sweepstake on when #COP29 will formally end now has 112 guesses.
Lots of people going for Sunday morning!
Enter your exact day/time here if you want to join in: bit.ly/CBCOP29Gavel...
No prizes, just bragging rights!
Lots of people going for Sunday morning!
Enter your exact day/time here if you want to join in: bit.ly/CBCOP29Gavel...
No prizes, just bragging rights!
The interactive includes a searchable table to find extremes that have been studied in particular parts of the world.
Each extreme event or trend has its own card that summarises the key findings.
7/10
Each extreme event or trend has its own card that summarises the key findings.
7/10

November 18, 2024 at 11:03 AM
The interactive includes a searchable table to find extremes that have been studied in particular parts of the world.
Each extreme event or trend has its own card that summarises the key findings.
7/10
Each extreme event or trend has its own card that summarises the key findings.
7/10
Heat is the most studied type of extreme, accounting for 28% of cases in the map, followed by rain and flooding (24%) and drought (14%)
6/10
6/10

November 18, 2024 at 11:03 AM
Heat is the most studied type of extreme, accounting for 28% of cases in the map, followed by rain and flooding (24%) and drought (14%)
6/10
6/10
The map reveals an uneven spread of extremes that have been studied around the world, with far more extremes analysed in the global north.
5/10
5/10

November 18, 2024 at 11:03 AM
The map reveals an uneven spread of extremes that have been studied around the world, with far more extremes analysed in the global north.
5/10
5/10
Clicking on a region in the map brings up a summary of all the studied extremes in that part of the world:
4/10
4/10

November 18, 2024 at 11:03 AM
Clicking on a region in the map brings up a summary of all the studied extremes in that part of the world:
4/10
4/10
Such is the sheer quantity of attribution studies now, the new map gives a regional view:
Size of the circles = the number of extremes studied
Colour = the attribution finding: more (red) or less (blue) severe/likely, no influence (yellow) or inconclusive (grey)
2/10
Size of the circles = the number of extremes studied
Colour = the attribution finding: more (red) or less (blue) severe/likely, no influence (yellow) or inconclusive (grey)
2/10

November 18, 2024 at 11:03 AM
Such is the sheer quantity of attribution studies now, the new map gives a regional view:
Size of the circles = the number of extremes studied
Colour = the attribution finding: more (red) or less (blue) severe/likely, no influence (yellow) or inconclusive (grey)
2/10
Size of the circles = the number of extremes studied
Colour = the attribution finding: more (red) or less (blue) severe/likely, no influence (yellow) or inconclusive (grey)
2/10
Finally, the average gender balance of #COP29 party delegations is 60% male to 40% female (not inc. “overflow” badges).
This potentially makes Baku the COP with the most balanced delegations in history.
(NB: This is based on the titles designated by UNFCCC, not CB)
6/7
This potentially makes Baku the COP with the most balanced delegations in history.
(NB: This is based on the titles designated by UNFCCC, not CB)
6/7

November 12, 2024 at 2:16 PM
Finally, the average gender balance of #COP29 party delegations is 60% male to 40% female (not inc. “overflow” badges).
This potentially makes Baku the COP with the most balanced delegations in history.
(NB: This is based on the titles designated by UNFCCC, not CB)
6/7
This potentially makes Baku the COP with the most balanced delegations in history.
(NB: This is based on the titles designated by UNFCCC, not CB)
6/7
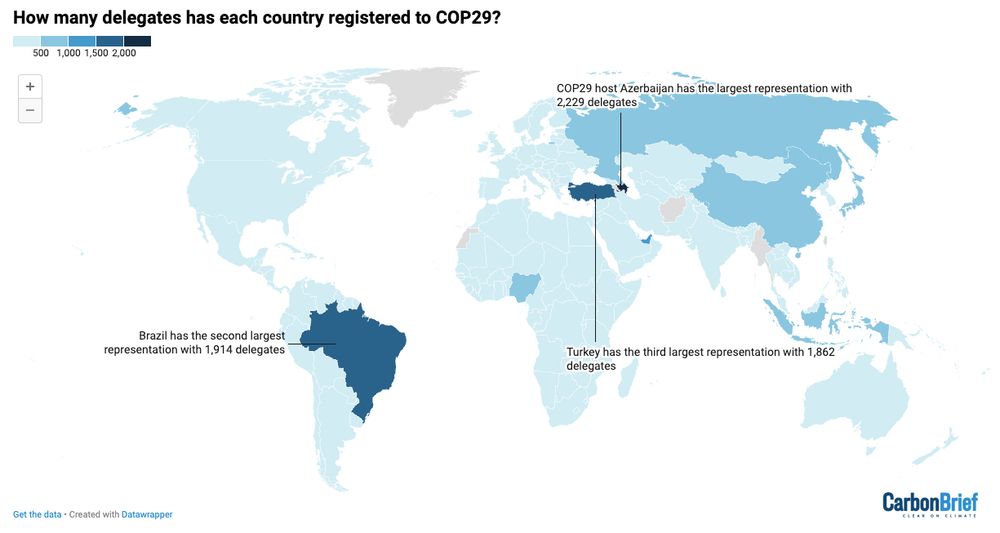
Unsurprisingly, the largest party delegation is from host country Azerbaijan with 2,229.
This is a far cry from Azerbaijan’s pre-COP28 typical delegation of just six people.
The next-largest delegations come from Brazil (1,914), Turkey (1,862), UAE (1,011) and China (969).
3/7
This is a far cry from Azerbaijan’s pre-COP28 typical delegation of just six people.
The next-largest delegations come from Brazil (1,914), Turkey (1,862), UAE (1,011) and China (969).
3/7
November 12, 2024 at 2:16 PM
Unsurprisingly, the largest party delegation is from host country Azerbaijan with 2,229.
This is a far cry from Azerbaijan’s pre-COP28 typical delegation of just six people.
The next-largest delegations come from Brazil (1,914), Turkey (1,862), UAE (1,011) and China (969).
3/7
This is a far cry from Azerbaijan’s pre-COP28 typical delegation of just six people.
The next-largest delegations come from Brazil (1,914), Turkey (1,862), UAE (1,011) and China (969).
3/7
More than 70,000 delegates have registered for #COP29 (67k to attend in person and 4k online).
That’s a drop of ~15,000 from the record-breaking COP in Dubai last year – and marks the first time in seven years that a COP is not larger than its predecessor.
2/7
That’s a drop of ~15,000 from the record-breaking COP in Dubai last year – and marks the first time in seven years that a COP is not larger than its predecessor.
2/7

November 12, 2024 at 2:16 PM
More than 70,000 delegates have registered for #COP29 (67k to attend in person and 4k online).
That’s a drop of ~15,000 from the record-breaking COP in Dubai last year – and marks the first time in seven years that a COP is not larger than its predecessor.
2/7
That’s a drop of ~15,000 from the record-breaking COP in Dubai last year – and marks the first time in seven years that a COP is not larger than its predecessor.
2/7
So, fourth, what about the *actual* number of delay minutes caused by extreme weather?
Well, they are also higher in recent years – even without the Q4 data for 2023-24:
7/9
Well, they are also higher in recent years – even without the Q4 data for 2023-24:
7/9

April 4, 2024 at 4:51 PM
So, fourth, what about the *actual* number of delay minutes caused by extreme weather?
Well, they are also higher in recent years – even without the Q4 data for 2023-24:
7/9
Well, they are also higher in recent years – even without the Q4 data for 2023-24:
7/9
Third, the Telegraph is looking at the *proportion* of total delay minutes that are weather-related.
The overall total number of delay minutes has been steadily increasing after the huge drop in train travel during Covid lockdowns.
(NB, Q4 data for 2023-24 not out yet)
5/9
The overall total number of delay minutes has been steadily increasing after the huge drop in train travel during Covid lockdowns.
(NB, Q4 data for 2023-24 not out yet)
5/9

April 4, 2024 at 4:50 PM
Third, the Telegraph is looking at the *proportion* of total delay minutes that are weather-related.
The overall total number of delay minutes has been steadily increasing after the huge drop in train travel during Covid lockdowns.
(NB, Q4 data for 2023-24 not out yet)
5/9
The overall total number of delay minutes has been steadily increasing after the huge drop in train travel during Covid lockdowns.
(NB, Q4 data for 2023-24 not out yet)
5/9
Second, it’s highly misleading to draw a trend from 4 years of data.
Look back a bit further (the ORR website has data back to 2016-17) and you can see that the proportion of weather-related delays in recent years is typically higher than before Covid:
4/9
Look back a bit further (the ORR website has data back to 2016-17) and you can see that the proportion of weather-related delays in recent years is typically higher than before Covid:
4/9

April 4, 2024 at 4:49 PM
Second, it’s highly misleading to draw a trend from 4 years of data.
Look back a bit further (the ORR website has data back to 2016-17) and you can see that the proportion of weather-related delays in recent years is typically higher than before Covid:
4/9
Look back a bit further (the ORR website has data back to 2016-17) and you can see that the proportion of weather-related delays in recent years is typically higher than before Covid:
4/9
First, this category of delays includes more than just severe weather.
It also includes problems with engineering structures and earthworks and issues caused by leaves on the line (hence “autumn”)
Here’s the same chart, just focusing on extreme weather:
3/9
It also includes problems with engineering structures and earthworks and issues caused by leaves on the line (hence “autumn”)
Here’s the same chart, just focusing on extreme weather:
3/9

April 4, 2024 at 4:49 PM
First, this category of delays includes more than just severe weather.
It also includes problems with engineering structures and earthworks and issues caused by leaves on the line (hence “autumn”)
Here’s the same chart, just focusing on extreme weather:
3/9
It also includes problems with engineering structures and earthworks and issues caused by leaves on the line (hence “autumn”)
Here’s the same chart, just focusing on extreme weather:
3/9
Using data from the Office of Road and Rail, the Telegraph says train delays caused by “severe weather, autumn and structures” made up 10.3% of all delay minutes in 2020-21.
By last year “that share had declined to 7.7%”, it adds.
Here is a supporting chart from the article:
2/9
By last year “that share had declined to 7.7%”, it adds.
Here is a supporting chart from the article:
2/9

April 4, 2024 at 4:48 PM
Using data from the Office of Road and Rail, the Telegraph says train delays caused by “severe weather, autumn and structures” made up 10.3% of all delay minutes in 2020-21.
By last year “that share had declined to 7.7%”, it adds.
Here is a supporting chart from the article:
2/9
By last year “that share had declined to 7.7%”, it adds.
Here is a supporting chart from the article:
2/9
FACTCHECK
The @telegraphnews.bsky.social reported today that Network Rail's £2.8bn plan to cope with extreme weather has been “undermine[d]” because “weather-related train disruption has decreased over the past few years”.
Let’s have a look at that claim:
THREAD
1/9
The @telegraphnews.bsky.social reported today that Network Rail's £2.8bn plan to cope with extreme weather has been “undermine[d]” because “weather-related train disruption has decreased over the past few years”.
Let’s have a look at that claim:
THREAD
1/9

April 4, 2024 at 4:47 PM
FACTCHECK
The @telegraphnews.bsky.social reported today that Network Rail's £2.8bn plan to cope with extreme weather has been “undermine[d]” because “weather-related train disruption has decreased over the past few years”.
Let’s have a look at that claim:
THREAD
1/9
The @telegraphnews.bsky.social reported today that Network Rail's £2.8bn plan to cope with extreme weather has been “undermine[d]” because “weather-related train disruption has decreased over the past few years”.
Let’s have a look at that claim:
THREAD
1/9
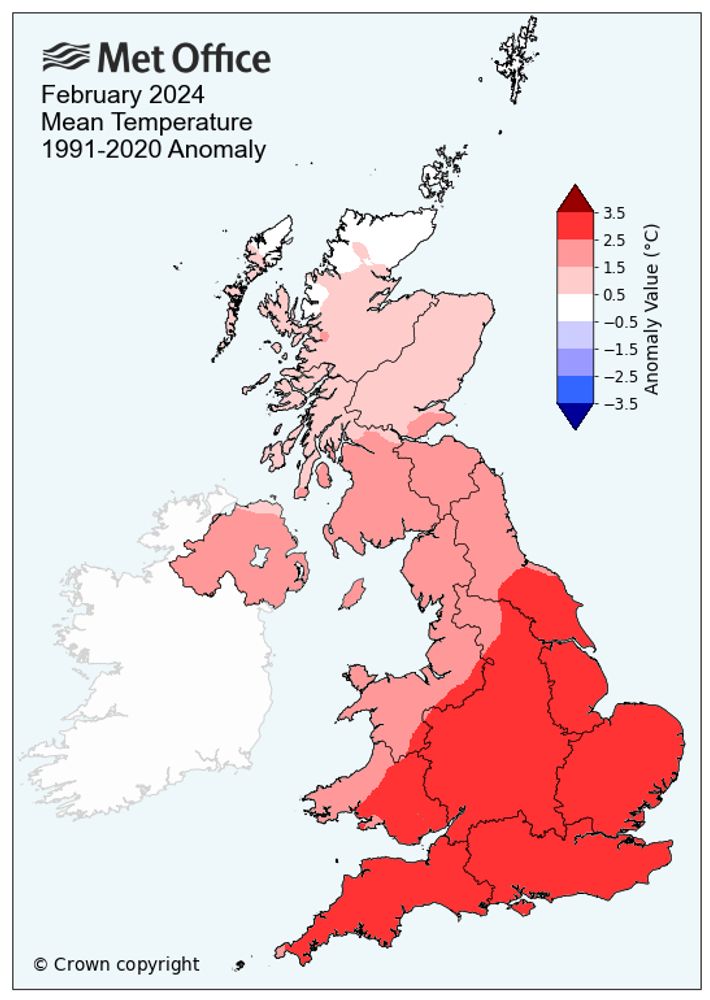
England and Wales have just had their warmest February on record, says the UK Met Office:
England averaged 7.5C, while Wales averaged 6.9C.
For more on how UK winters are getting warmer (and wetter), see @carbonbrief.org's recent analysis:
www.carbonbrief.org/analysis-how...
England averaged 7.5C, while Wales averaged 6.9C.
For more on how UK winters are getting warmer (and wetter), see @carbonbrief.org's recent analysis:
www.carbonbrief.org/analysis-how...
March 1, 2024 at 12:55 PM
England and Wales have just had their warmest February on record, says the UK Met Office:
England averaged 7.5C, while Wales averaged 6.9C.
For more on how UK winters are getting warmer (and wetter), see @carbonbrief.org's recent analysis:
www.carbonbrief.org/analysis-how...
England averaged 7.5C, while Wales averaged 6.9C.
For more on how UK winters are getting warmer (and wetter), see @carbonbrief.org's recent analysis:
www.carbonbrief.org/analysis-how...
In a new @carbonbrief.org guest post, @drgilbz.bsky.social unpacks the extraordinary year of 2023 for Antarctic sea ice.
E.g. In July (in mid-winter), sea ice extent was almost 2.5m km2 smaller than the 1981-2010 average.
That's an area larger than Algeria.
www.carbonbrief.org/guest-post-w...
E.g. In July (in mid-winter), sea ice extent was almost 2.5m km2 smaller than the 1981-2010 average.
That's an area larger than Algeria.
www.carbonbrief.org/guest-post-w...

January 29, 2024 at 2:55 PM
In a new @carbonbrief.org guest post, @drgilbz.bsky.social unpacks the extraordinary year of 2023 for Antarctic sea ice.
E.g. In July (in mid-winter), sea ice extent was almost 2.5m km2 smaller than the 1981-2010 average.
That's an area larger than Algeria.
www.carbonbrief.org/guest-post-w...
E.g. In July (in mid-winter), sea ice extent was almost 2.5m km2 smaller than the 1981-2010 average.
That's an area larger than Algeria.
www.carbonbrief.org/guest-post-w...
Finally, the average gender balance of #COP28 party delegations is 62% male to 38% female (not inc. overflow).
There is just one all-male party delegation this year: North Korea.
(Note: Here, gender is based on the titles designated by UNFCCC, not Carbon Brief.)
7/8
There is just one all-male party delegation this year: North Korea.
(Note: Here, gender is based on the titles designated by UNFCCC, not Carbon Brief.)
7/8

December 1, 2023 at 4:25 PM
Finally, the average gender balance of #COP28 party delegations is 62% male to 38% female (not inc. overflow).
There is just one all-male party delegation this year: North Korea.
(Note: Here, gender is based on the titles designated by UNFCCC, not Carbon Brief.)
7/8
There is just one all-male party delegation this year: North Korea.
(Note: Here, gender is based on the titles designated by UNFCCC, not Carbon Brief.)
7/8
More than 84,000 delegates have registered for #COP28 (81k to attend in person and 3k online). This would make it the largest COP *by miles*.
That’s 30,000 people more than at COP27 last year (the previous biggest).
2/8
That’s 30,000 people more than at COP27 last year (the previous biggest).
2/8

December 1, 2023 at 4:24 PM
More than 84,000 delegates have registered for #COP28 (81k to attend in person and 3k online). This would make it the largest COP *by miles*.
That’s 30,000 people more than at COP27 last year (the previous biggest).
2/8
That’s 30,000 people more than at COP27 last year (the previous biggest).
2/8