I made use of a package called JAX, which is primarily for Deep Learning but can speed up optimsation problems. Well worth checking out.
13/13
I made use of a package called JAX, which is primarily for Deep Learning but can speed up optimsation problems. Well worth checking out.
13/13
12/n
12/n
While maybe not that exciting by itself, once we repeat this for all the spectra in the data set (over 6 million!), we get some fantastic results.
11/n

While maybe not that exciting by itself, once we repeat this for all the spectra in the data set (over 6 million!), we get some fantastic results.
11/n
10/n

10/n
Here I indicate locations of the photospheric lines and their potential source. These lines are taken from a modelled spectral atlas.
9/n

Here I indicate locations of the photospheric lines and their potential source. These lines are taken from a modelled spectral atlas.
9/n
The details are best seen by plotting an individual spectrum. The coronal line is indicated by the arrow.
There is lots of other information in the spectrum, not all of it wanted!
8/n

The details are best seen by plotting an individual spectrum. The coronal line is indicated by the arrow.
There is lots of other information in the spectrum, not all of it wanted!
8/n
Hence, each data file contains the results of a slit exposure, so is wavelength verus slit location. There are two beams, so two similar images.
7/n

Hence, each data file contains the results of a slit exposure, so is wavelength verus slit location. There are two beams, so two similar images.
7/n
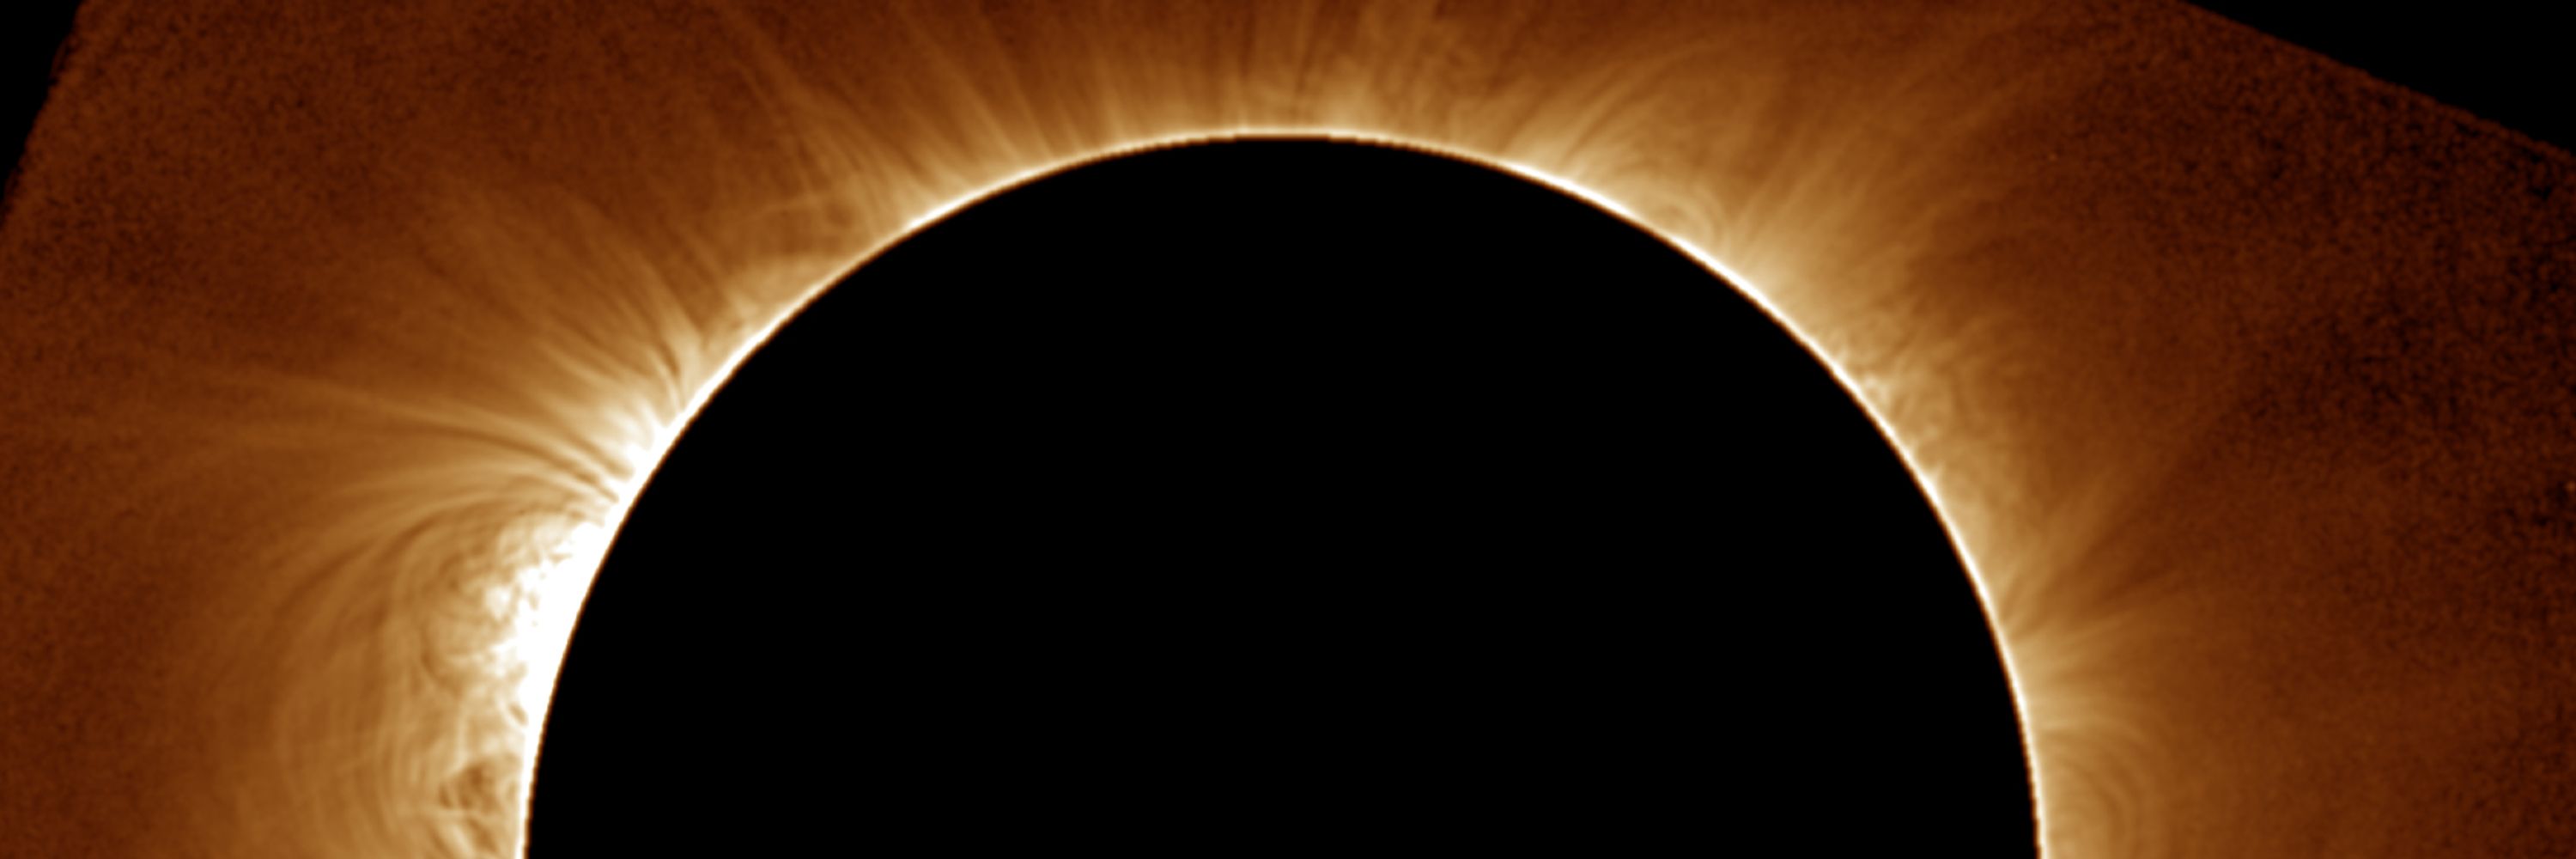
Cryo-NIRSP observed an open field region, catching an active region and a streamer base on either edge.
6/n


Cryo-NIRSP observed an open field region, catching an active region and a streamer base on either edge.
6/n
5/n
5/n
The team attached an image of the data, reporting they could see the corona....
My honest first reaction was 'What the hell?!?' 🤨
I didn't know what to make of it. I am used to working with pretty images, so felt a bit morose 😢 😂
4/n

The team attached an image of the data, reporting they could see the corona....
My honest first reaction was 'What the hell?!?' 🤨
I didn't know what to make of it. I am used to working with pretty images, so felt a bit morose 😢 😂
4/n
It was a long 9 month wait until the data was actually taken. But the DKIST team were great at keeping me informed of preparations and discussed the details of implementing my proposal.
3/n
It was a long 9 month wait until the data was actually taken. But the DKIST team were great at keeping me informed of preparations and discussed the details of implementing my proposal.
3/n
Existing gata can be accessed by the DKIST data center.
2/n
Existing gata can be accessed by the DKIST data center.
2/n

The first results are given in a paper by Tom Schad: iopscience.iop.org/article/10.3...
The first results are given in a paper by Tom Schad: iopscience.iop.org/article/10.3...
In the next (extended) post I will talk about the data itself.
In the next (extended) post I will talk about the data itself.
It provides multiple spectra at different positions along a slit, so can focus only on a narrow strip of the Sun at any one time.

It provides multiple spectra at different positions along a slit, so can focus only on a narrow strip of the Sun at any one time.

