Day 19. Projections
World Continents UTM Vs. Equal-Area (LAEA) Projection
by Soroush Saffarzadeh
#GeoData #rstats #DataViz #Maps #SpatialViz


Day 19. Projections
World Continents UTM Vs. Equal-Area (LAEA) Projection
by Soroush Saffarzadeh
#GeoData #rstats #DataViz #Maps #SpatialViz
Day 18: Out Of This World
Render a 3D map of Olympus Mons on Mars using elevation data
by Ignacio Urria Yáñez.
#GeoData #rstats #DataViz #Maps #SpatialViz


Day 18: Out Of This World
Render a 3D map of Olympus Mons on Mars using elevation data
by Ignacio Urria Yáñez.
#GeoData #rstats #DataViz #Maps #SpatialViz
Day 17: A New Tool
Mapping Co-Hotspots in Amsterdam: A Social-Spatial Network Analysis using SNoMaN Software
by Shuyu Zhang
#GeoData #rstats #DataViz #Maps #SpatialViz


Day 17: A New Tool
Mapping Co-Hotspots in Amsterdam: A Social-Spatial Network Analysis using SNoMaN Software
by Shuyu Zhang
#GeoData #rstats #DataViz #Maps #SpatialViz
Day 15: FIRE.
Finance, Insurance, Real Estate and other advanced services as markers of urban globalisation
by @clementinecttn.bsky.social
#GeoData #rstats #DataViz #Maps #SpatialViz


Day 15: FIRE.
Finance, Insurance, Real Estate and other advanced services as markers of urban globalisation
by @clementinecttn.bsky.social
#GeoData #rstats #DataViz #Maps #SpatialViz
Day 11: Minimal Map
Blue Whale Sightings
by Roger Marín de Yzaguirre
#GeoData #rstats #DataViz #Maps #SpatialViz


Day 11: Minimal Map
Blue Whale Sightings
by Roger Marín de Yzaguirre
#GeoData #rstats #DataViz #Maps #SpatialViz
Day 9: Analog.
M(ap), or M analog plot
by @cforgaci.bsky.social
#GeoData #rstats #DataViz #Maps #SpatialViz


Day 9: Analog.
M(ap), or M analog plot
by @cforgaci.bsky.social
#GeoData #rstats #DataViz #Maps #SpatialViz
Day 8: Urban.
Periurban intensities.
by @bhausleitner.bsky.social & @cforgaci.bsky.social
#GeoData #rstats #DataViz #Maps #SpatialViz


Day 8: Urban.
Periurban intensities.
by @bhausleitner.bsky.social & @cforgaci.bsky.social
#GeoData #rstats #DataViz #Maps #SpatialViz
Day 7: Accessibility.
Access, A Matter of Means.
by @ineszaid.bsky.social
#GeoData #rstats #DataViz #Maps #SpatialViz


Day 7: Accessibility.
Access, A Matter of Means.
by @ineszaid.bsky.social
#GeoData #rstats #DataViz #Maps #SpatialViz
Day 5: Earth.
Comparing Global and Local Digital Terrain Models
by @cforgaci.bsky.social
#GeoData #rstats #DataViz #Maps #SpatialViz

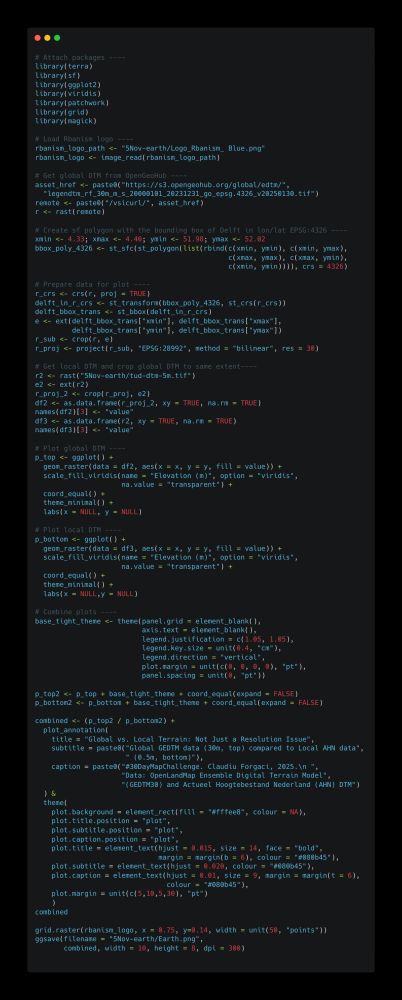
Day 5: Earth.
Comparing Global and Local Digital Terrain Models
by @cforgaci.bsky.social
#GeoData #rstats #DataViz #Maps #SpatialViz
Day 4: My Data.
Cycling into the “Highlands” of the Netherlands: Veluwezoom (already too high for me!)
by Yehan Wu


Day 4: My Data.
Cycling into the “Highlands” of the Netherlands: Veluwezoom (already too high for me!)
by Yehan Wu
Day 3. Polygons.
Destruction Patterns in Gaza
by @dni-ka.bsky.social


Day 3. Polygons.
Destruction Patterns in Gaza
by @dni-ka.bsky.social
Day 2. Lines.
Horses, beware! Postal horse roads in 1810 France
by @clementinecttn.bsky.social
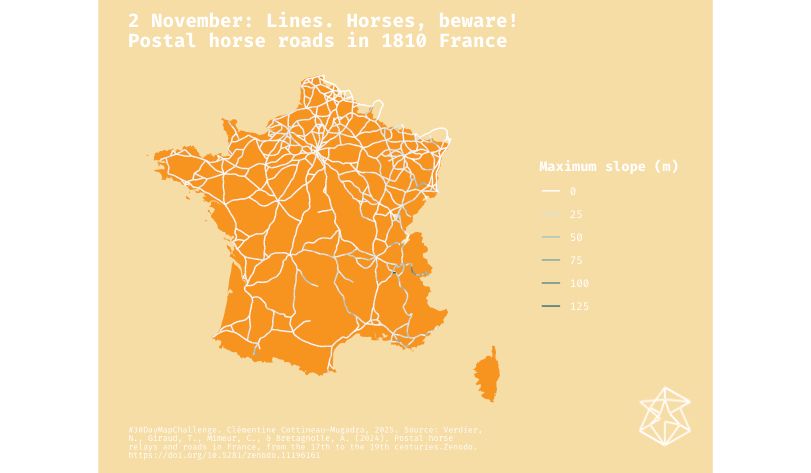

Day 2. Lines.
Horses, beware! Postal horse roads in 1810 France
by @clementinecttn.bsky.social
Day 1. Points.
Pigeons, beware! 1km around distributors of contraceptive seeds in the City of Brussels
by @clementinecttn.bsky.social


Day 1. Points.
Pigeons, beware! 1km around distributors of contraceptive seeds in the City of Brussels
by @clementinecttn.bsky.social
If you’re using R, Python, or Julia, consider sharing open-source examples or tutorials. 🧭
30daymapchallenge.com
#GeoData #DataViz #Maps #SpatialViz

If you’re using R, Python, or Julia, consider sharing open-source examples or tutorials. 🧭
30daymapchallenge.com
#GeoData #DataViz #Maps #SpatialViz
This blog post is almost three years old now, but all of the code still works!
#DataViz #RSpatial #30DayMapChallenge

This blog post is almost three years old now, but all of the code still works!
#DataViz #RSpatial #30DayMapChallenge

#30DayMapChallenge #30DayMapChallenge2025 #30DayMapChallengeRbanism
30daymapchallenge.com
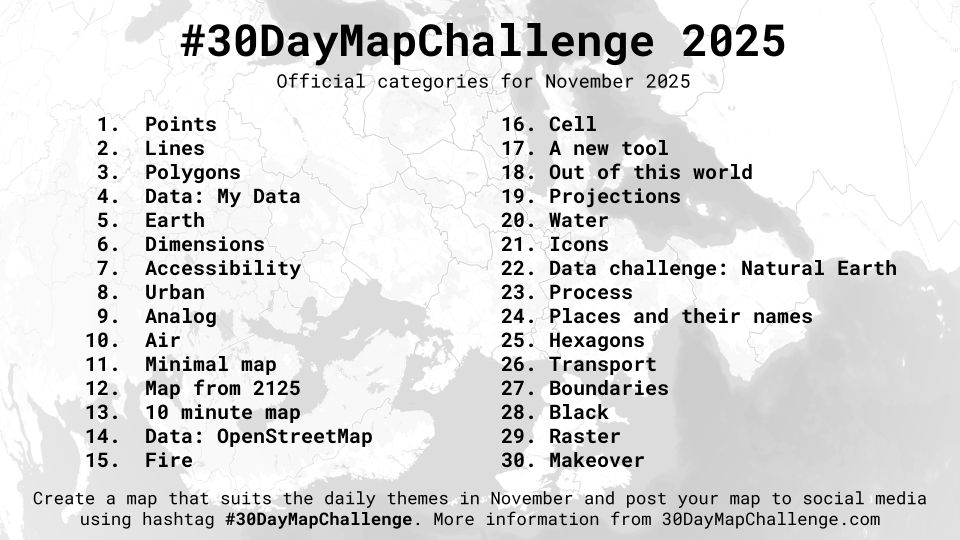
#30DayMapChallenge #30DayMapChallenge2025 #30DayMapChallengeRbanism
30daymapchallenge.com
For 30 days, we’ll explore together creative mapping through daily themes, all scripted and coded in R!
Scan the QR and join
#Rbanism #R #bk #tudelft

For 30 days, we’ll explore together creative mapping through daily themes, all scripted and coded in R!
Scan the QR and join
#Rbanism #R #bk #tudelft
We are excited to share our new lesson **Geospatial Data Carpentry for Urbanism** and open it for feedback.
Any question > [email protected]

We are excited to share our new lesson **Geospatial Data Carpentry for Urbanism** and open it for feedback.
Any question > [email protected]

doi.org/10.1002/psp....

doi.org/10.1002/psp....
...Including one article on housing and household mobility...
odissei-data.nl/2025/10/01/c...

...Including one article on housing and household mobility...
odissei-data.nl/2025/10/01/c...
We are teaming up with the #Rcafé team at TU Delft to organise a *refactoring workshop* next month. The objective: to (learn to) clean and optimise the code of our #30DayMapChallenge maps together... while eating pizza.
Free registration: www.eventbrite.nl/e/nice-and-c...
We are teaming up with the #Rcafé team at TU Delft to organise a *refactoring workshop* next month. The objective: to (learn to) clean and optimise the code of our #30DayMapChallenge maps together... while eating pizza.
Free registration: www.eventbrite.nl/e/nice-and-c...

Density of Elderly (older than 60) in 2019
By Diego Buitrago-Mora, 2024.
Data: Data for Good at Meta - High Resolution Population Density Maps and Demographic Estimates
#Rbanism #30DayMapChallenge2024 #rstats #30DayMapChallenge2024_Rbanism

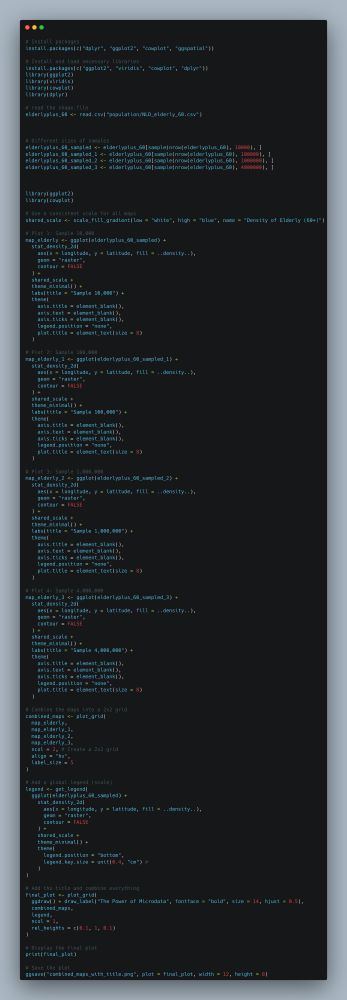
Density of Elderly (older than 60) in 2019
By Diego Buitrago-Mora, 2024.
Data: Data for Good at Meta - High Resolution Population Density Maps and Demographic Estimates
#Rbanism #30DayMapChallenge2024 #rstats #30DayMapChallenge2024_Rbanism

