


Re-up because of an error in the legend 😅.
Late entry for Day 10 of the #30DayMapChallenge - Air.
Mapping average wind speed from November 5, 2025.
Code: github.com/rajodm/30Day...
#dataviz #rstats #ggplot2
Late entry for Day 10 of the #30DayMapChallenge - Air.
Mapping average wind speed from November 5, 2025.
Code: github.com/rajodm/30Day...
#dataviz #rstats #ggplot2

November 12, 2025 at 7:00 AM
Re-up because of an error in the legend 😅.
Late entry for Day 10 of the #30DayMapChallenge - Air.
Mapping average wind speed from November 5, 2025.
Code: github.com/rajodm/30Day...
#dataviz #rstats #ggplot2
Late entry for Day 10 of the #30DayMapChallenge - Air.
Mapping average wind speed from November 5, 2025.
Code: github.com/rajodm/30Day...
#dataviz #rstats #ggplot2
3D Tanaka contour map of Scotland with #rayshader for Day 6 of the #30DayMapChallenge - Dimensions.
Code: github.com/rajodm/30Day...
Thanks @milos-makes-maps.bsky.social for the helpful tutorial!
#dataviz #rstats #ggplot2
Code: github.com/rajodm/30Day...
Thanks @milos-makes-maps.bsky.social for the helpful tutorial!
#dataviz #rstats #ggplot2

November 7, 2025 at 10:40 AM
3D Tanaka contour map of Scotland with #rayshader for Day 6 of the #30DayMapChallenge - Dimensions.
Code: github.com/rajodm/30Day...
Thanks @milos-makes-maps.bsky.social for the helpful tutorial!
#dataviz #rstats #ggplot2
Code: github.com/rajodm/30Day...
Thanks @milos-makes-maps.bsky.social for the helpful tutorial!
#dataviz #rstats #ggplot2
Here we go, #30daymapchallenge Day 1: points.
Health facilities across Sub-Saharan Africa.
Code: github.com/rajodm/30Day...
#dataviz #rstats
Health facilities across Sub-Saharan Africa.
Code: github.com/rajodm/30Day...
#dataviz #rstats

November 1, 2025 at 3:26 AM
Here we go, #30daymapchallenge Day 1: points.
Health facilities across Sub-Saharan Africa.
Code: github.com/rajodm/30Day...
#dataviz #rstats
Health facilities across Sub-Saharan Africa.
Code: github.com/rajodm/30Day...
#dataviz #rstats
#TidyTuesday week 42
Had some fun experimenting with the {gt} package for this week data from the UK Met Office on historical weather and climate.
Code: github.com/rajodm/TidyT...
#dataviz #rstats #ggplot2
Had some fun experimenting with the {gt} package for this week data from the UK Met Office on historical weather and climate.
Code: github.com/rajodm/TidyT...
#dataviz #rstats #ggplot2

October 23, 2025 at 7:06 PM
#TidyTuesday week 42
Had some fun experimenting with the {gt} package for this week data from the UK Met Office on historical weather and climate.
Code: github.com/rajodm/TidyT...
#dataviz #rstats #ggplot2
Had some fun experimenting with the {gt} package for this week data from the UK Met Office on historical weather and climate.
Code: github.com/rajodm/TidyT...
#dataviz #rstats #ggplot2
#TidyTuesday week 37
Data: allrecipes.com, {tastyR} package
Code: github.com/rajodm/TidyT...
#dataviz #rstats #ggplot2
Data: allrecipes.com, {tastyR} package
Code: github.com/rajodm/TidyT...
#dataviz #rstats #ggplot2

September 19, 2025 at 9:22 PM
#TidyTuesday week 37
Data: allrecipes.com, {tastyR} package
Code: github.com/rajodm/TidyT...
#dataviz #rstats #ggplot2
Data: allrecipes.com, {tastyR} package
Code: github.com/rajodm/TidyT...
#dataviz #rstats #ggplot2
#TidyTuesday week 36
Data: Henley Passport Index
Code: github.com/rajodm/TidyT...
#dataviz #rstats #ggplot2
Data: Henley Passport Index
Code: github.com/rajodm/TidyT...
#dataviz #rstats #ggplot2

September 11, 2025 at 7:21 PM
#TidyTuesday week 36
Data: Henley Passport Index
Code: github.com/rajodm/TidyT...
#dataviz #rstats #ggplot2
Data: Henley Passport Index
Code: github.com/rajodm/TidyT...
#dataviz #rstats #ggplot2

August 23, 2025 at 7:08 PM
With {paletteer} you can filter palettes by exact length needed. It returns the original package name, palette name, and length for each option.

August 14, 2025 at 7:28 PM
With {paletteer} you can filter palettes by exact length needed. It returns the original package name, palette name, and length for each option.
#TidyTuesday week 32
🌪️Extreme weather events attribution studies
Code: github.com/rajodm/TidyT...
#dataviz #rstats #ggplot2
🌪️Extreme weather events attribution studies
Code: github.com/rajodm/TidyT...
#dataviz #rstats #ggplot2

August 13, 2025 at 10:24 PM
#TidyTuesday week 32
🌪️Extreme weather events attribution studies
Code: github.com/rajodm/TidyT...
#dataviz #rstats #ggplot2
🌪️Extreme weather events attribution studies
Code: github.com/rajodm/TidyT...
#dataviz #rstats #ggplot2
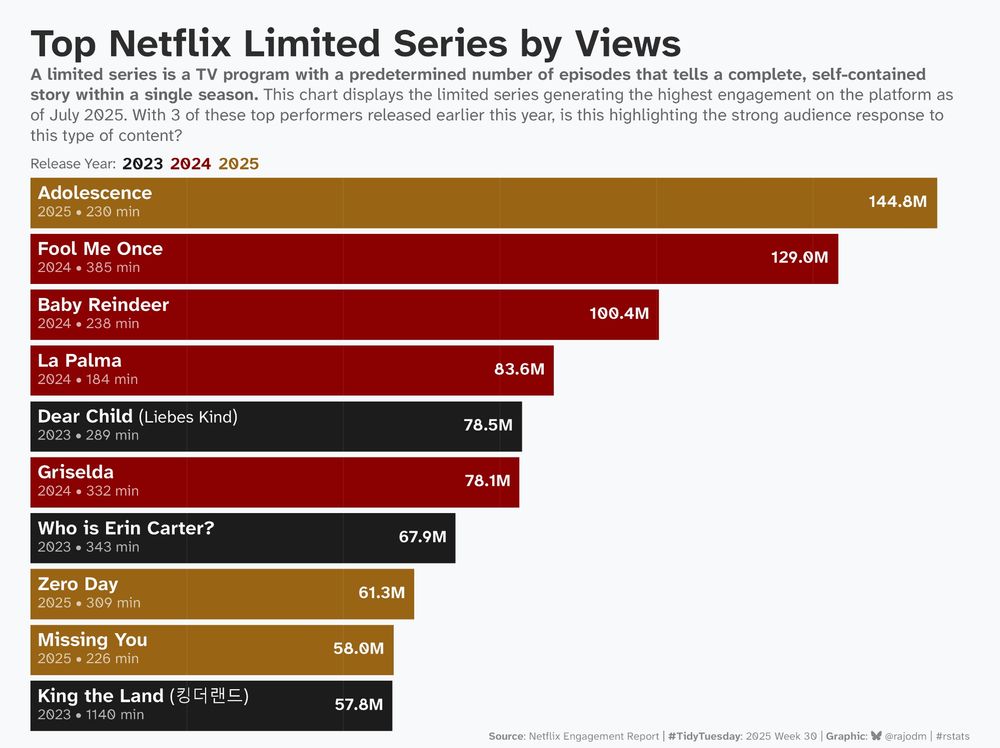
#TidyTuesday week 30
#Netflix limited series audience engagement.
- Data: Netflix engagement report
- code: github.com/rajodm/TidyT...
#dataviz #rstats #ggplot2
#Netflix limited series audience engagement.
- Data: Netflix engagement report
- code: github.com/rajodm/TidyT...
#dataviz #rstats #ggplot2
July 29, 2025 at 5:23 PM
#TidyTuesday week 30
#Netflix limited series audience engagement.
- Data: Netflix engagement report
- code: github.com/rajodm/TidyT...
#dataviz #rstats #ggplot2
#Netflix limited series audience engagement.
- Data: Netflix engagement report
- code: github.com/rajodm/TidyT...
#dataviz #rstats #ggplot2
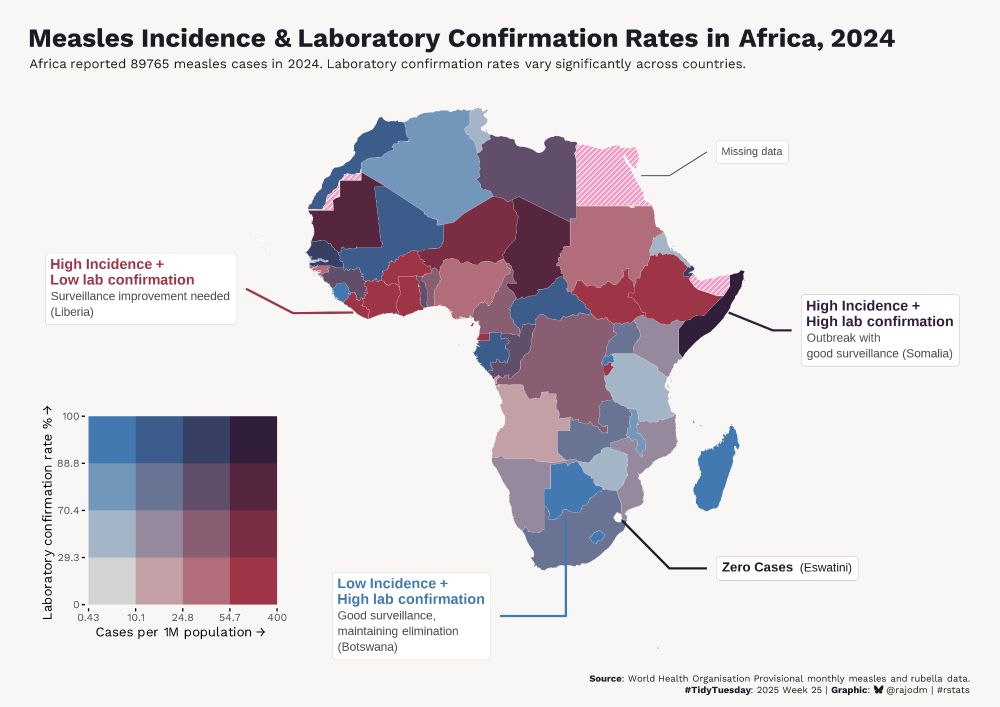
#TidyTuesday week 25
📊 Exploring #measles incidence and laboratory confirmation rates in Africa (2024).
Code: github.com/rajodm/TidyT...
#dataviz #rstats #ggplot2
📊 Exploring #measles incidence and laboratory confirmation rates in Africa (2024).
Code: github.com/rajodm/TidyT...
#dataviz #rstats #ggplot2
June 26, 2025 at 10:07 AM
#TidyTuesday week 25
📊 Exploring #measles incidence and laboratory confirmation rates in Africa (2024).
Code: github.com/rajodm/TidyT...
#dataviz #rstats #ggplot2
📊 Exploring #measles incidence and laboratory confirmation rates in Africa (2024).
Code: github.com/rajodm/TidyT...
#dataviz #rstats #ggplot2
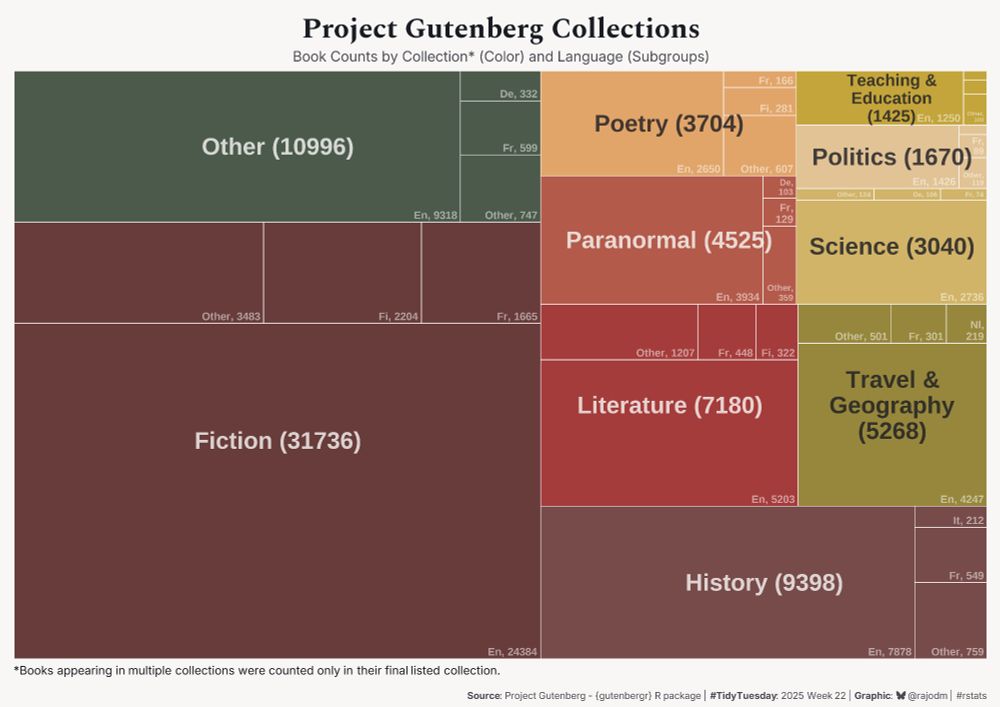
#TidyTuesday week 22
Data: Project Gutenberg
Code: github.com/rajodm/TidyT...
#rstats #dataviz #ggplot2
Data: Project Gutenberg
Code: github.com/rajodm/TidyT...
#rstats #dataviz #ggplot2
June 3, 2025 at 6:00 PM
#TidyTuesday week 22
Data: Project Gutenberg
Code: github.com/rajodm/TidyT...
#rstats #dataviz #ggplot2
Data: Project Gutenberg
Code: github.com/rajodm/TidyT...
#rstats #dataviz #ggplot2
May 14, 2025 at 12:25 PM
#TidyTuesday week 18.
Data: NSF Grant Terminations Under the Trump Administration.
Code: github.com/rajodm/TidyT...
#dataviz #rstats #ggplot2
Data: NSF Grant Terminations Under the Trump Administration.
Code: github.com/rajodm/TidyT...
#dataviz #rstats #ggplot2

May 6, 2025 at 3:03 AM
#TidyTuesday week 18.
Data: NSF Grant Terminations Under the Trump Administration.
Code: github.com/rajodm/TidyT...
#dataviz #rstats #ggplot2
Data: NSF Grant Terminations Under the Trump Administration.
Code: github.com/rajodm/TidyT...
#dataviz #rstats #ggplot2
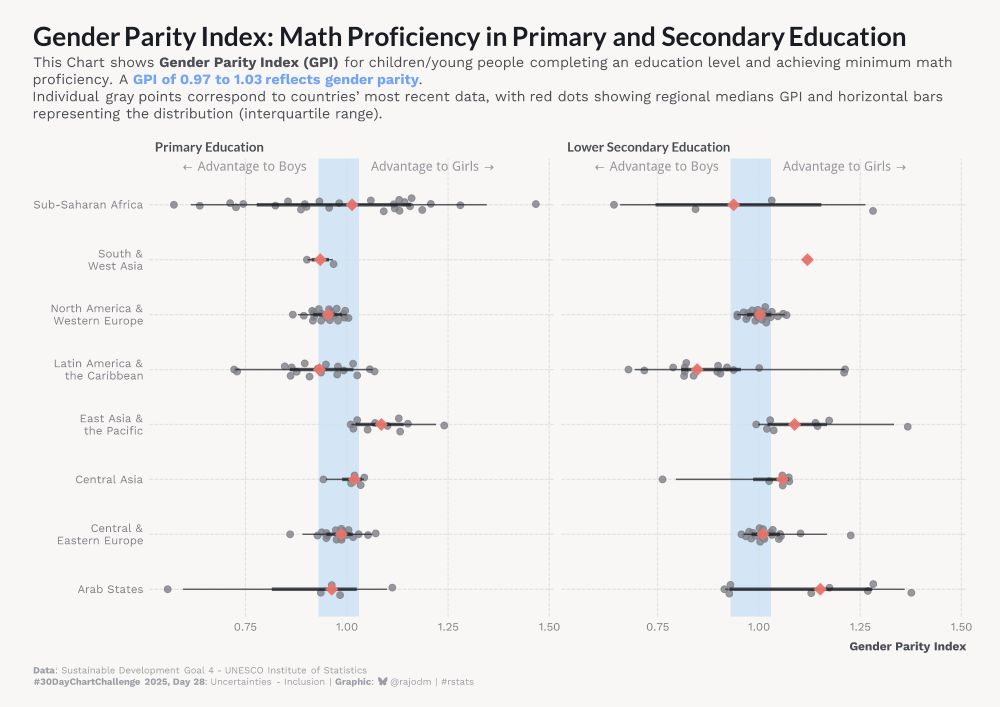
Late #30DayChartChallenge #Day28,
Theme: Uncertainties - Inclusion
📊🏫 Gender disparities in Math proficiency across primary and lower secondary.
#dataviz #rstats #ggplot2
Theme: Uncertainties - Inclusion
📊🏫 Gender disparities in Math proficiency across primary and lower secondary.
#dataviz #rstats #ggplot2
April 29, 2025 at 9:29 AM
Late #30DayChartChallenge #Day28,
Theme: Uncertainties - Inclusion
📊🏫 Gender disparities in Math proficiency across primary and lower secondary.
#dataviz #rstats #ggplot2
Theme: Uncertainties - Inclusion
📊🏫 Gender disparities in Math proficiency across primary and lower secondary.
#dataviz #rstats #ggplot2
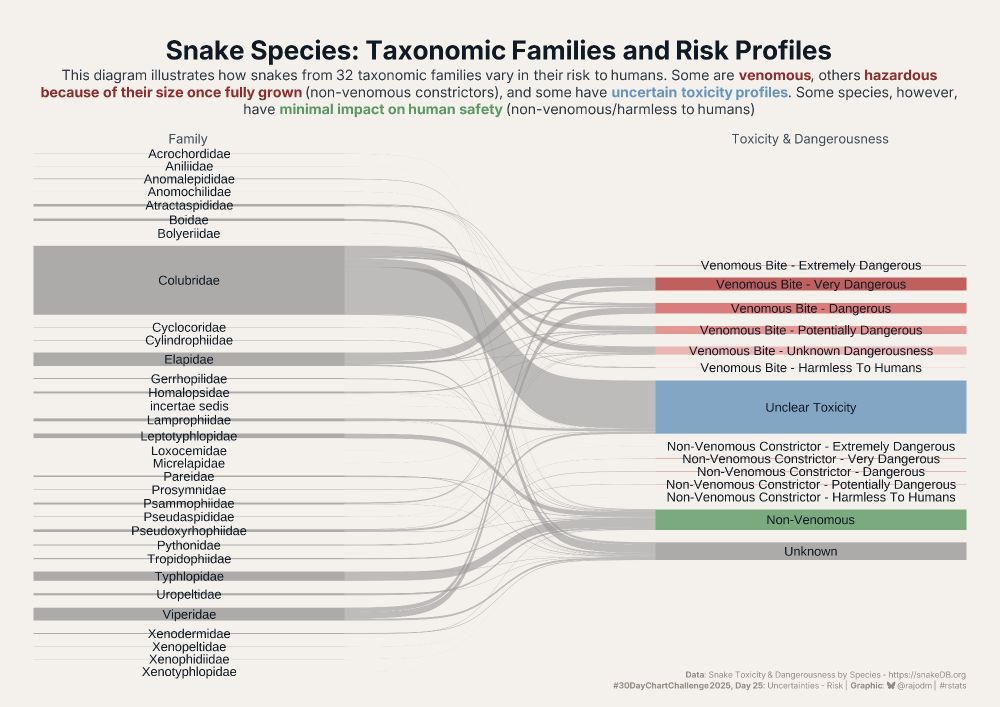
#30DayChartChallenge #Day25:
👉 Uncertainties - risk
📊🐍⚠️ Snakes: dangerousness and toxicity.
Are all snakes dangerous? Which snake families pose the greatest risk to humans? Are venomous snakes the only ones to fear?
#dataviz #rstats #ggplot2
👉 Uncertainties - risk
📊🐍⚠️ Snakes: dangerousness and toxicity.
Are all snakes dangerous? Which snake families pose the greatest risk to humans? Are venomous snakes the only ones to fear?
#dataviz #rstats #ggplot2
April 25, 2025 at 4:00 AM
#30DayChartChallenge #Day25:
👉 Uncertainties - risk
📊🐍⚠️ Snakes: dangerousness and toxicity.
Are all snakes dangerous? Which snake families pose the greatest risk to humans? Are venomous snakes the only ones to fear?
#dataviz #rstats #ggplot2
👉 Uncertainties - risk
📊🐍⚠️ Snakes: dangerousness and toxicity.
Are all snakes dangerous? Which snake families pose the greatest risk to humans? Are venomous snakes the only ones to fear?
#dataviz #rstats #ggplot2
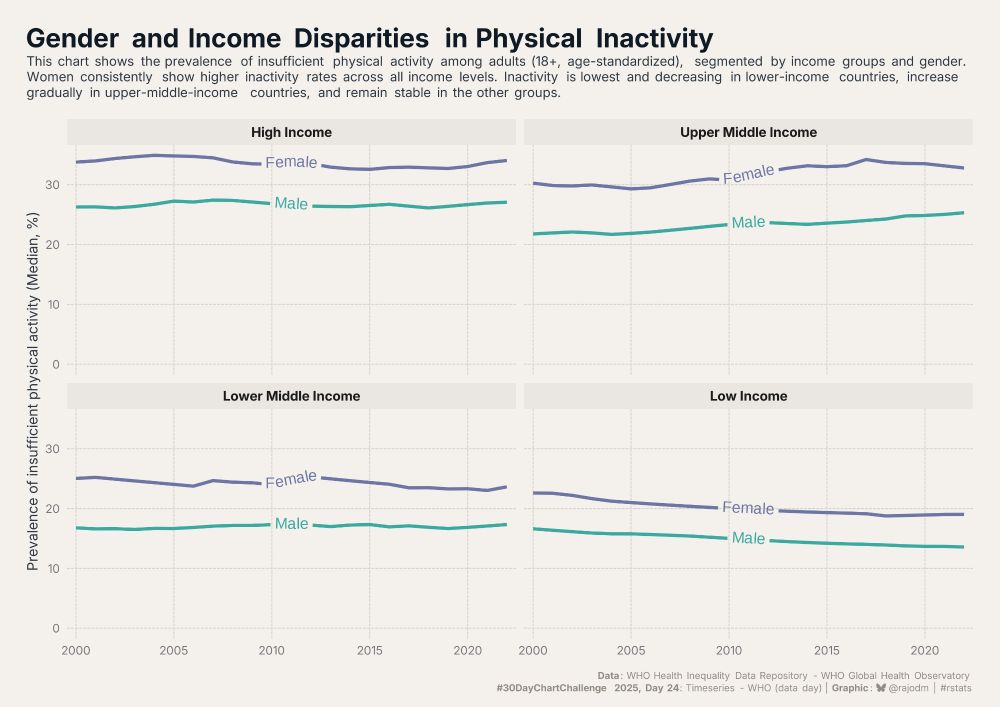
#30DayChartChallenge #Day24
👉 Timeseries - W.H.O. (data day)
📊🤸Physical activity shows clear patterns: women are consistently less active than men across all income levels, and wealthier countries display higher inactivity rates than lower-income regions.
#dataviz #rstats #ggplot2
👉 Timeseries - W.H.O. (data day)
📊🤸Physical activity shows clear patterns: women are consistently less active than men across all income levels, and wealthier countries display higher inactivity rates than lower-income regions.
#dataviz #rstats #ggplot2
April 24, 2025 at 8:20 AM
#30DayChartChallenge #Day24
👉 Timeseries - W.H.O. (data day)
📊🤸Physical activity shows clear patterns: women are consistently less active than men across all income levels, and wealthier countries display higher inactivity rates than lower-income regions.
#dataviz #rstats #ggplot2
👉 Timeseries - W.H.O. (data day)
📊🤸Physical activity shows clear patterns: women are consistently less active than men across all income levels, and wealthier countries display higher inactivity rates than lower-income regions.
#dataviz #rstats #ggplot2
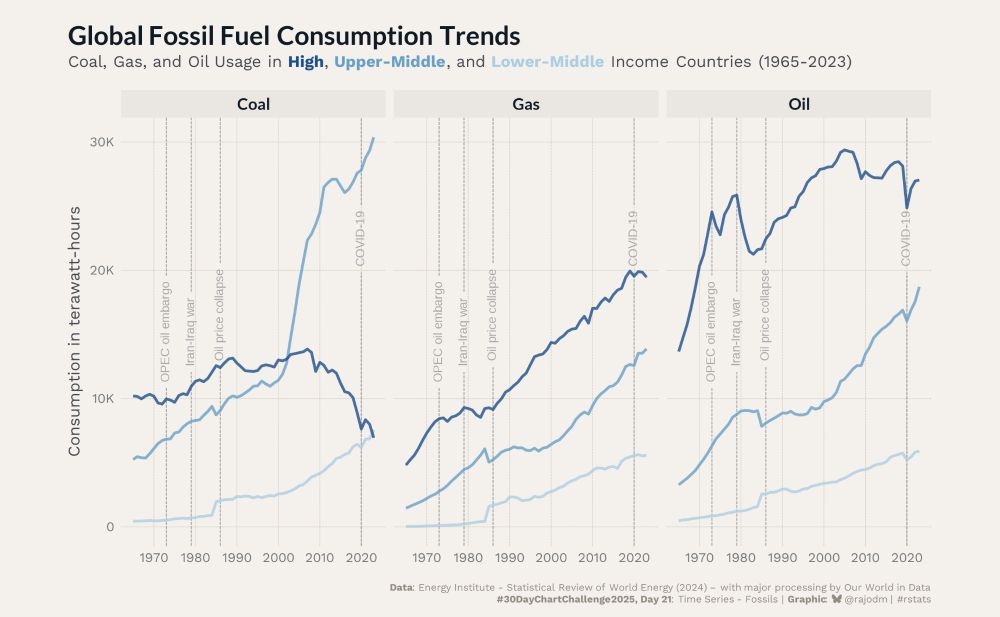
#Day21 of #30DayChartChallenge, theme: Timeseries - Fossils.
📊 Fossil fuel consumption patterns across income levels from 1965 to 2023.
#dataviz #rstats #ggplot2
📊 Fossil fuel consumption patterns across income levels from 1965 to 2023.
#dataviz #rstats #ggplot2
April 21, 2025 at 7:12 AM
#Day21 of #30DayChartChallenge, theme: Timeseries - Fossils.
📊 Fossil fuel consumption patterns across income levels from 1965 to 2023.
#dataviz #rstats #ggplot2
📊 Fossil fuel consumption patterns across income levels from 1965 to 2023.
#dataviz #rstats #ggplot2
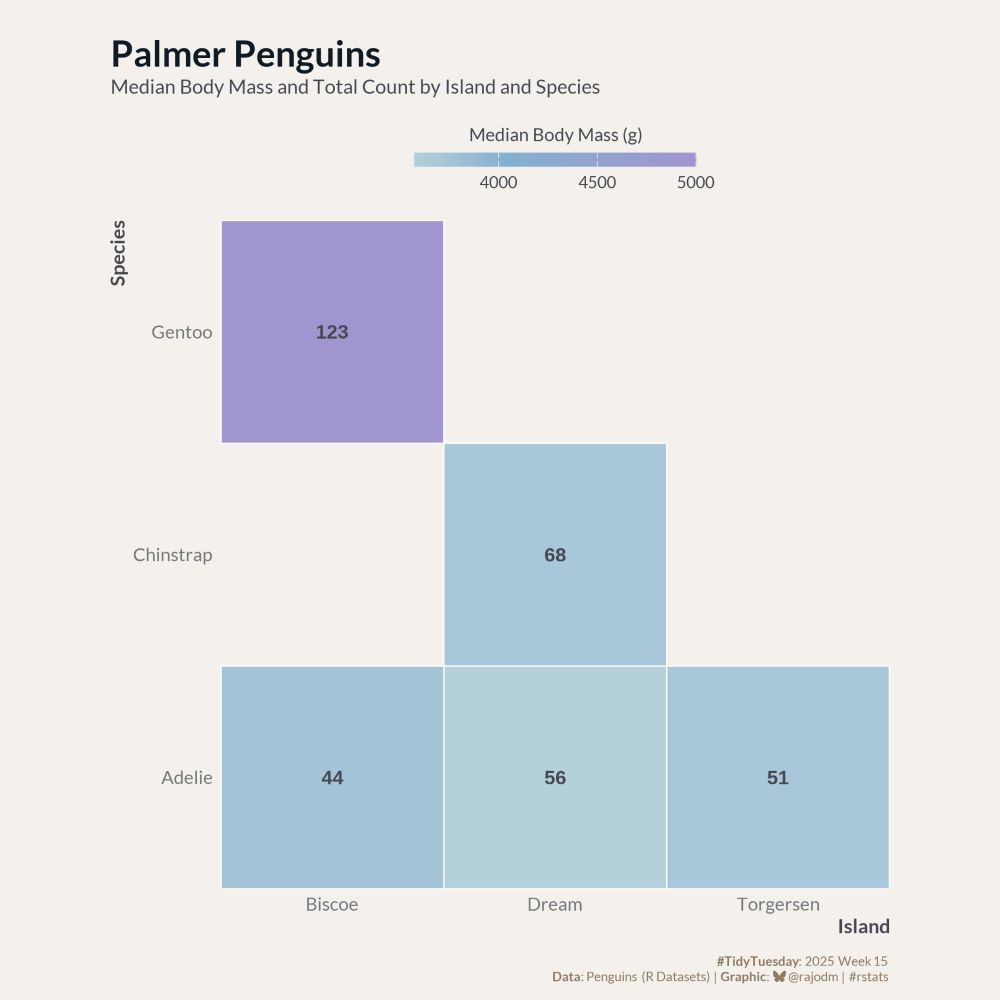
#TidyTuesday week 15.
Data: Palmer Penguins (Base R).
Code: github.com/rajodm/TidyT...
#dataviz #rstats #ggplot2
Data: Palmer Penguins (Base R).
Code: github.com/rajodm/TidyT...
#dataviz #rstats #ggplot2
April 19, 2025 at 10:38 PM
#TidyTuesday week 15.
Data: Palmer Penguins (Base R).
Code: github.com/rajodm/TidyT...
#dataviz #rstats #ggplot2
Data: Palmer Penguins (Base R).
Code: github.com/rajodm/TidyT...
#dataviz #rstats #ggplot2
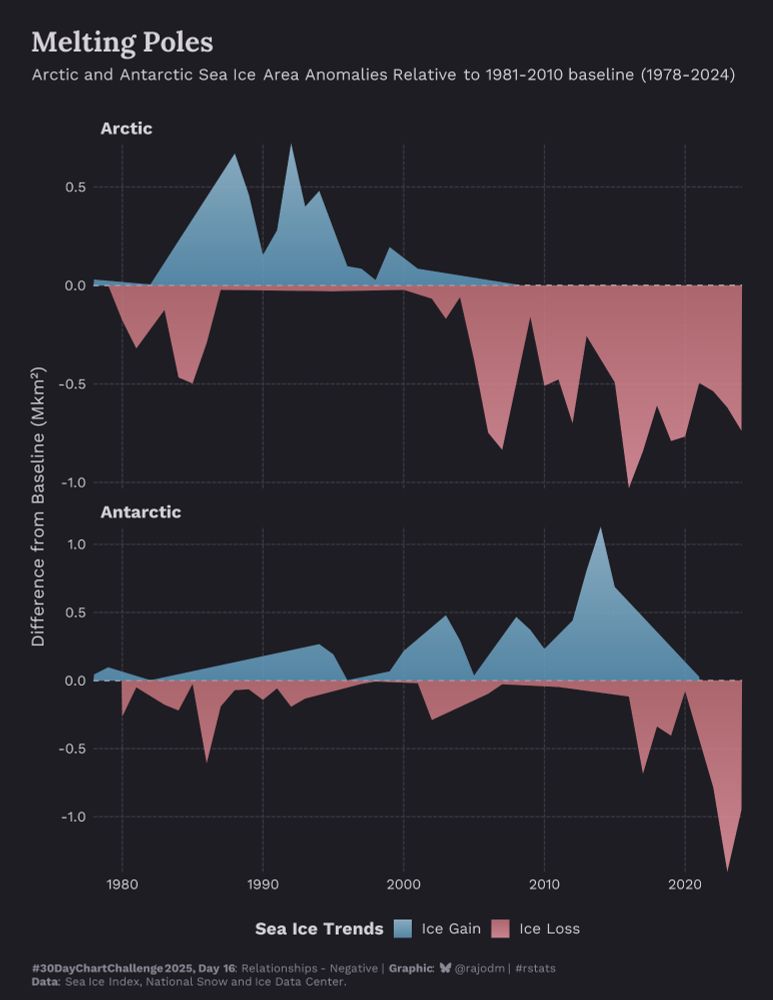
#30DayChartChallenge #Day16
📊❄️ The breaking bond between our climate systems and the sea ice area for today's theme: Relationships - Negative.
This chart shows ice area gain (blue) and loss (red) from 1978 to 2024 compared to the 1981-2010 baseline.
#dataviz #rstats #ggplot2
📊❄️ The breaking bond between our climate systems and the sea ice area for today's theme: Relationships - Negative.
This chart shows ice area gain (blue) and loss (red) from 1978 to 2024 compared to the 1981-2010 baseline.
#dataviz #rstats #ggplot2
April 16, 2025 at 8:27 AM
#30DayChartChallenge #Day16
📊❄️ The breaking bond between our climate systems and the sea ice area for today's theme: Relationships - Negative.
This chart shows ice area gain (blue) and loss (red) from 1978 to 2024 compared to the 1981-2010 baseline.
#dataviz #rstats #ggplot2
📊❄️ The breaking bond between our climate systems and the sea ice area for today's theme: Relationships - Negative.
This chart shows ice area gain (blue) and loss (red) from 1978 to 2024 compared to the 1981-2010 baseline.
#dataviz #rstats #ggplot2
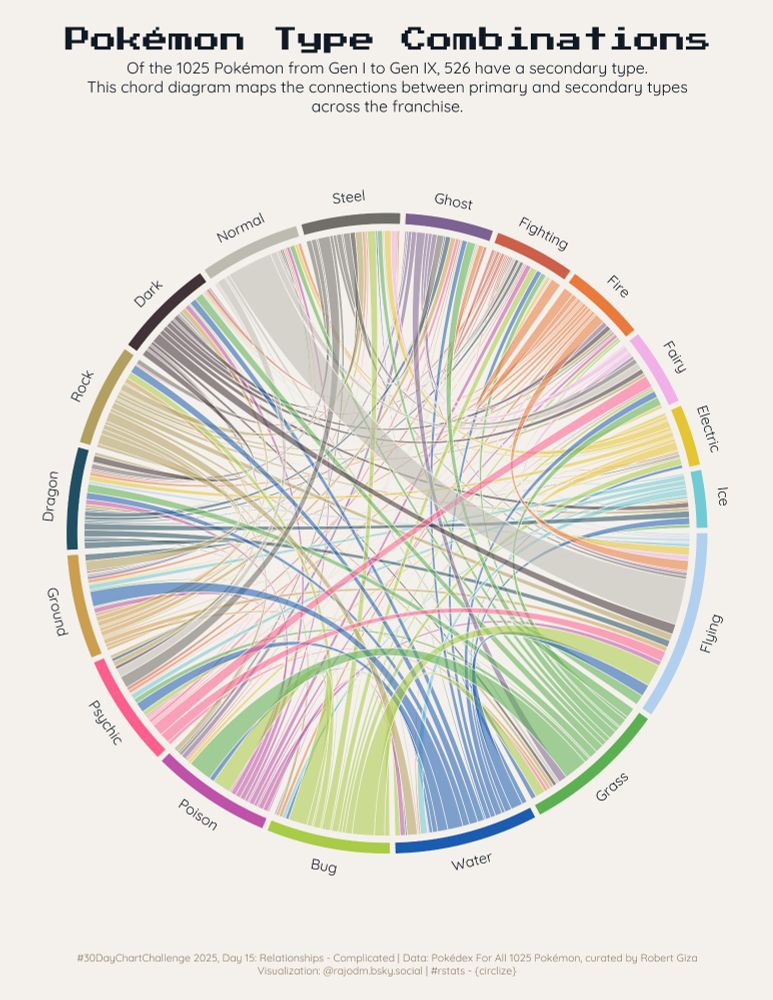
#30DayChartChallenge #Day15, Relationships - Complicated.
📊🎮 A chord diagram showing all Pokémon type combinations from gen. I to gen. IX! 🎮✨ Each connection represents dual-type Pokémon.
#dataviz #rstats #pokémon
📊🎮 A chord diagram showing all Pokémon type combinations from gen. I to gen. IX! 🎮✨ Each connection represents dual-type Pokémon.
#dataviz #rstats #pokémon
April 15, 2025 at 2:46 AM
#30DayChartChallenge #Day15, Relationships - Complicated.
📊🎮 A chord diagram showing all Pokémon type combinations from gen. I to gen. IX! 🎮✨ Each connection represents dual-type Pokémon.
#dataviz #rstats #pokémon
📊🎮 A chord diagram showing all Pokémon type combinations from gen. I to gen. IX! 🎮✨ Each connection represents dual-type Pokémon.
#dataviz #rstats #pokémon
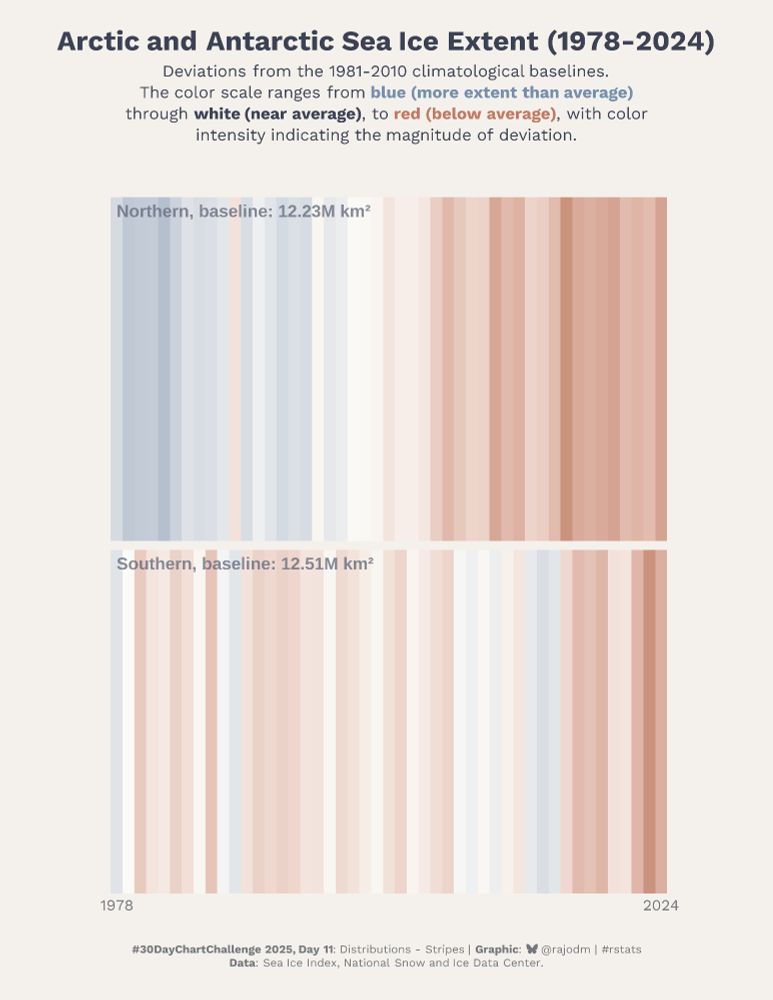
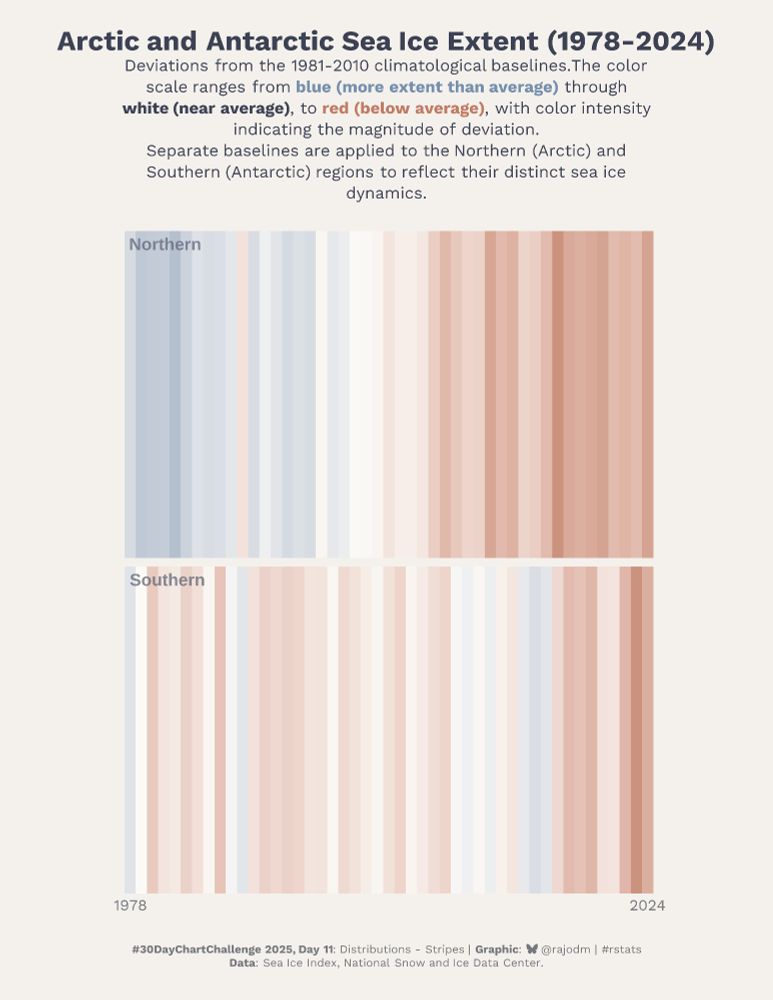
46 years of Arctic and Antarctic sea ice evolution for #30DayChartChallenge #Day11.
Prompt: Distributions - Stripes.
There's a clear decline of sea ice extent in the northern region, while the Antarctic displays no consistent trends.
#dataviz #rstats #ggplot2
Prompt: Distributions - Stripes.
There's a clear decline of sea ice extent in the northern region, while the Antarctic displays no consistent trends.
#dataviz #rstats #ggplot2
April 11, 2025 at 4:53 PM
46 years of Arctic and Antarctic sea ice evolution for #30DayChartChallenge #Day11.
Prompt: Distributions - Stripes.
There's a clear decline of sea ice extent in the northern region, while the Antarctic displays no consistent trends.
#dataviz #rstats #ggplot2
Prompt: Distributions - Stripes.
There's a clear decline of sea ice extent in the northern region, while the Antarctic displays no consistent trends.
#dataviz #rstats #ggplot2
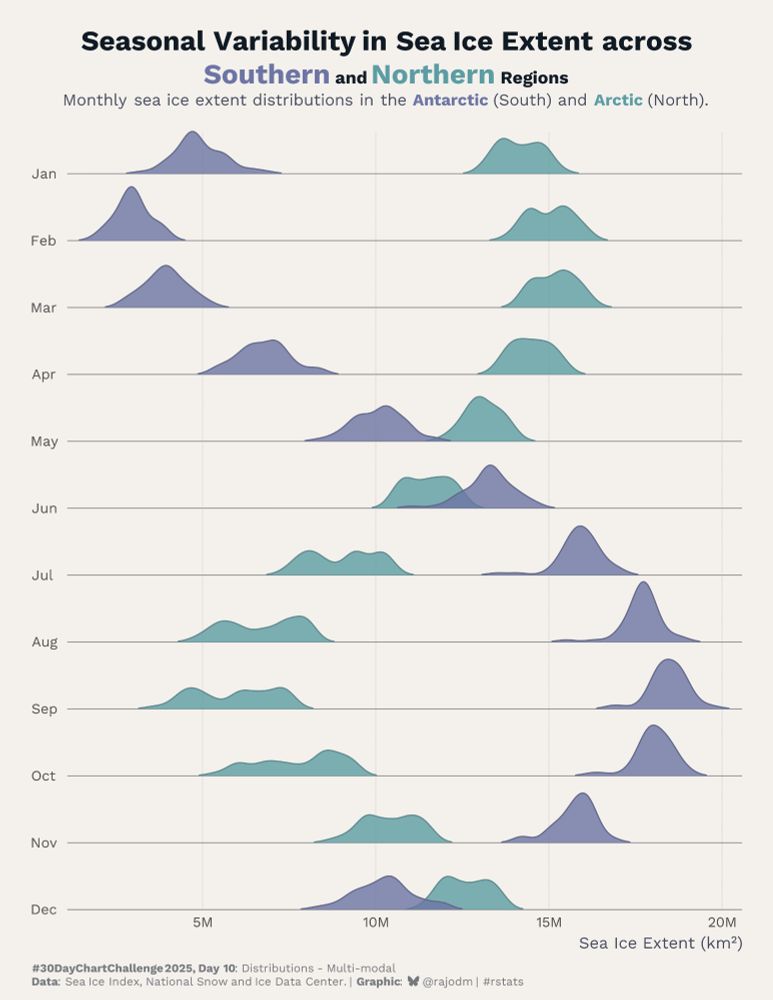
#Day10 of #30DayChartChallenge:
Distributions - Multi-modal!
📊❄️ A ridge line showing the seasonal distribution of sea ice extent, with opposite patterns between Arctic and Antarctic regions.
#dataviz #rstats #ggplot2
Distributions - Multi-modal!
📊❄️ A ridge line showing the seasonal distribution of sea ice extent, with opposite patterns between Arctic and Antarctic regions.
#dataviz #rstats #ggplot2
April 10, 2025 at 4:52 PM
#Day10 of #30DayChartChallenge:
Distributions - Multi-modal!
📊❄️ A ridge line showing the seasonal distribution of sea ice extent, with opposite patterns between Arctic and Antarctic regions.
#dataviz #rstats #ggplot2
Distributions - Multi-modal!
📊❄️ A ridge line showing the seasonal distribution of sea ice extent, with opposite patterns between Arctic and Antarctic regions.
#dataviz #rstats #ggplot2
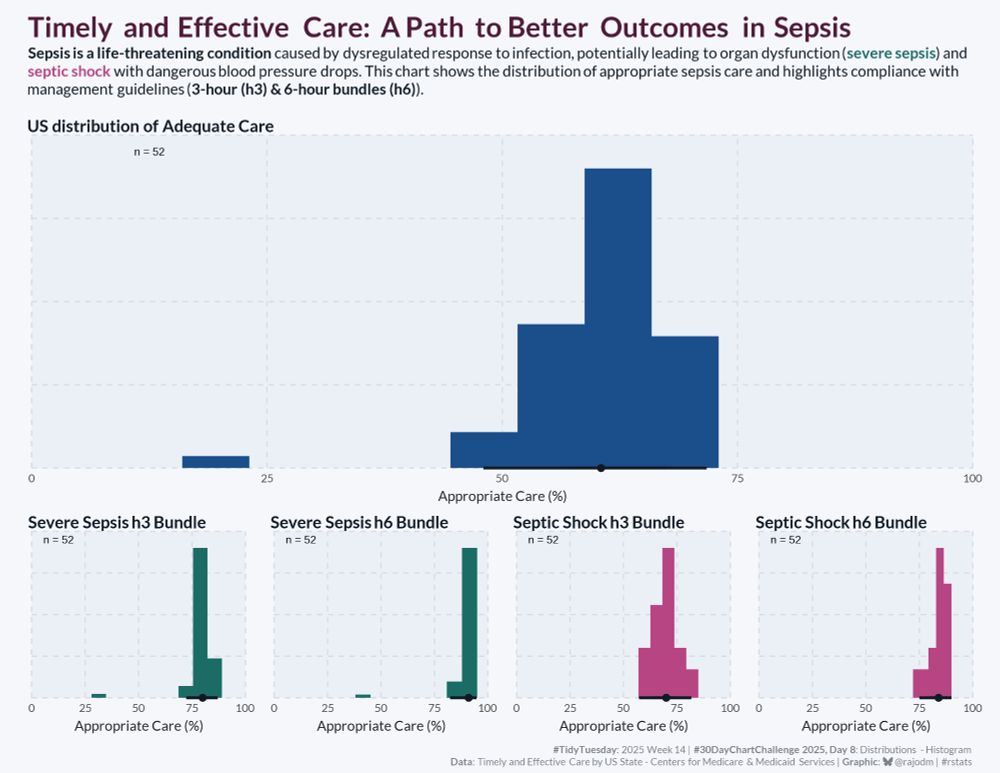
An analysis of how US healthcare facilities are performing on critical sepsis care guidelines for #30DayChartChallenge #Day8: Distributions - Histogram & #TidyTuesday week 14.
Data: Timely and Effective Care by US state
Code: github.com/rajodm/TidyT...
#dataviz #rstats #ggplot2
Data: Timely and Effective Care by US state
Code: github.com/rajodm/TidyT...
#dataviz #rstats #ggplot2
April 8, 2025 at 10:00 AM
An analysis of how US healthcare facilities are performing on critical sepsis care guidelines for #30DayChartChallenge #Day8: Distributions - Histogram & #TidyTuesday week 14.
Data: Timely and Effective Care by US state
Code: github.com/rajodm/TidyT...
#dataviz #rstats #ggplot2
Data: Timely and Effective Care by US state
Code: github.com/rajodm/TidyT...
#dataviz #rstats #ggplot2