


Jens Terhaar
@polarocean.bsky.social
Father of 3, ocean biogeochemical modeller at the University of Bern, interested in high-latitude oceans, carbon cycle, ocean-climate interaction & ecosystem stressors such as ocean acidification and primary production.
And these SSTs stopped to be record-breaking in July 2024

May 6, 2025 at 11:53 AM
And these SSTs stopped to be record-breaking in July 2024
Adding another of these observation-based estimates of air-sea heat fluxes (COREv2), which we did not add to the paper because it does not cover the entire timeseries, we can show that these estimates all agree within the uncertainties.

May 1, 2025 at 8:03 AM
Adding another of these observation-based estimates of air-sea heat fluxes (COREv2), which we did not add to the paper because it does not cover the entire timeseries, we can show that these estimates all agree within the uncertainties.
Last but not least, I want to say thank you to the most important people in my life: My wife and my three children who make me realize each day why we life and why I want to contribute a tiny bit to make earth a better place for all of us.

April 30, 2025 at 8:56 AM
Last but not least, I want to say thank you to the most important people in my life: My wife and my three children who make me realize each day why we life and why I want to contribute a tiny bit to make earth a better place for all of us.
In case you want to know more about the two presentations that I gave at #EGU25, please check out our two recently published papers in @nature.com and @natcomms.nature.com:
- Record SSTs (lnkd.in/d-sdWK-Y)
- Past AMOC (lnkd.in/dUbQgZ3A) (also the topic of my award lecture).
- Record SSTs (lnkd.in/d-sdWK-Y)
- Past AMOC (lnkd.in/dUbQgZ3A) (also the topic of my award lecture).

April 30, 2025 at 8:56 AM
In case you want to know more about the two presentations that I gave at #EGU25, please check out our two recently published papers in @nature.com and @natcomms.nature.com:
- Record SSTs (lnkd.in/d-sdWK-Y)
- Past AMOC (lnkd.in/dUbQgZ3A) (also the topic of my award lecture).
- Record SSTs (lnkd.in/d-sdWK-Y)
- Past AMOC (lnkd.in/dUbQgZ3A) (also the topic of my award lecture).
Most of all, I am extremely grateful for all the people who have supported me over time and who have been friends during this really exciting time. Thank you to all of you! This would not have been possible without all of you!

April 30, 2025 at 8:56 AM
Most of all, I am extremely grateful for all the people who have supported me over time and who have been friends during this really exciting time. Thank you to all of you! This would not have been possible without all of you!
Yesterday, I received the Ocean Science Outstanding Early Career Scientist Award at #EGU25.
I am very grateful for this recognition about my work on the ocean carbon cycle, ocean biogeochemistry, earth system modeling, ocean-climate interactions, climate projections, and physical oceanography.
I am very grateful for this recognition about my work on the ocean carbon cycle, ocean biogeochemistry, earth system modeling, ocean-climate interactions, climate projections, and physical oceanography.

April 30, 2025 at 8:56 AM
Yesterday, I received the Ocean Science Outstanding Early Career Scientist Award at #EGU25.
I am very grateful for this recognition about my work on the ocean carbon cycle, ocean biogeochemistry, earth system modeling, ocean-climate interactions, climate projections, and physical oceanography.
I am very grateful for this recognition about my work on the ocean carbon cycle, ocean biogeochemistry, earth system modeling, ocean-climate interactions, climate projections, and physical oceanography.
At the moment, the model-based and the observation-based estimates of the ocean carbon sink provided by the Global Carbon Budget remain imperfect (essd.copernicus.org/articles/17/...).

March 28, 2025 at 9:37 AM
At the moment, the model-based and the observation-based estimates of the ocean carbon sink provided by the Global Carbon Budget remain imperfect (essd.copernicus.org/articles/17/...).
That must be a misunderstanding. We do not say that warming is not accelerating. It is accelerating simply because emissions are increasing and emissions are related to the warming rate. It looks not too different to atmospheric warming, I believe.

March 13, 2025 at 12:43 PM
That must be a misunderstanding. We do not say that warming is not accelerating. It is accelerating simply because emissions are increasing and emissions are related to the warming rate. It looks not too different to atmospheric warming, I believe.
We also looked at common characteristics between the jumps in the models and found that a jump in SSTs of at least 0.25°C can only occur if there is an El-Niño event. In most cases, the Pacific and Atlantic Ocean were also very high.

March 12, 2025 at 4:13 PM
We also looked at common characteristics between the jumps in the models and found that a jump in SSTs of at least 0.25°C can only occur if there is an El-Niño event. In most cases, the Pacific and Atlantic Ocean were also very high.
In these simulations, we find indeed 11 jumps in SSTs that are larger than 0.25°C. Such jumps thus occur around every 1000 years. This is twice as large as estimated from observations but uncertainties are large in both estimates and are not significantly different.

March 12, 2025 at 4:13 PM
In these simulations, we find indeed 11 jumps in SSTs that are larger than 0.25°C. Such jumps thus occur around every 1000 years. This is twice as large as estimated from observations but uncertainties are large in both estimates and are not significantly different.
Based on these characteristics, we constructed synthetic timeseries of 100 million years. We then counted the jumps in SSTs of at least 0.25°C. We found that we can expect such jumps every 500 years. However, uncertainties are large due to the uncertainties of the underlying characteristics.

March 12, 2025 at 4:13 PM
Based on these characteristics, we constructed synthetic timeseries of 100 million years. We then counted the jumps in SSTs of at least 0.25°C. We found that we can expect such jumps every 500 years. However, uncertainties are large due to the uncertainties of the underlying characteristics.
The jump in SSTs in 2023/24 has come as a surprise to many. The annual averaged SSTs from April 2023 to March 2024 have exceeded the previous record over the same period by 0.25°C. Never before has an SST record been broken by such a margin.

March 12, 2025 at 4:13 PM
The jump in SSTs in 2023/24 has come as a surprise to many. The annual averaged SSTs from April 2023 to March 2024 have exceeded the previous record over the same period by 0.25°C. Never before has an SST record been broken by such a margin.
What are the conclusions?
- The recent decline in the carbon sink is likely not mainly driven by natural variability, such as El-Niña or others, but by the atm. growth rate.
- The ocean carbon sink will likely not substantially increase unless the growth rate of atmospheric CO2 increases again.
- The recent decline in the carbon sink is likely not mainly driven by natural variability, such as El-Niña or others, but by the atm. growth rate.
- The ocean carbon sink will likely not substantially increase unless the growth rate of atmospheric CO2 increases again.

February 18, 2025 at 3:07 PM
What are the conclusions?
- The recent decline in the carbon sink is likely not mainly driven by natural variability, such as El-Niña or others, but by the atm. growth rate.
- The ocean carbon sink will likely not substantially increase unless the growth rate of atmospheric CO2 increases again.
- The recent decline in the carbon sink is likely not mainly driven by natural variability, such as El-Niña or others, but by the atm. growth rate.
- The ocean carbon sink will likely not substantially increase unless the growth rate of atmospheric CO2 increases again.
Here, I plotted the ocean carbon sink and the atmospheric CO2 over time. Black are observations and orange and blue are ensemble means of six IPSL-CM6A-LR simulations for SSP1-2.6 and SSP2-4.5.

February 18, 2025 at 3:07 PM
Here, I plotted the ocean carbon sink and the atmospheric CO2 over time. Black are observations and orange and blue are ensemble means of six IPSL-CM6A-LR simulations for SSP1-2.6 and SSP2-4.5.
This figure is just above. I wonder how sensitive the trend in the other figure is to the start and end date. Especially since the 1980s, the North Atlantic heat content has increased substantially. There is some spatial variability but integrated over the entire North Atlantic north of 26.5°...

January 16, 2025 at 4:24 PM
This figure is just above. I wonder how sensitive the trend in the other figure is to the start and end date. Especially since the 1980s, the North Atlantic heat content has increased substantially. There is some spatial variability but integrated over the entire North Atlantic north of 26.5°...
My guess would be that an integral over the entire North Atlantic north of 26.5°N (which includes the Nordic Seas), would still lead to a warming in the North Atlantic. There are some patterns, but there is also large variability there. And I suppose the eddies in the gulf stream...

January 16, 2025 at 3:41 PM
My guess would be that an integral over the entire North Atlantic north of 26.5°N (which includes the Nordic Seas), would still lead to a warming in the North Atlantic. There are some patterns, but there is also large variability there. And I suppose the eddies in the gulf stream...
But similar variability is also seen in other parts of the ocean. Not sure if that is really a warming blob. In addition, I also calculated the difference in SSTs between 1982-1991 and 2015-2024 to ensure that the linear trend is not influenced by start or end values. The pattern looks similar.

January 16, 2025 at 12:15 PM
But similar variability is also seen in other parts of the ocean. Not sure if that is really a warming blob. In addition, I also calculated the difference in SSTs between 1982-1991 and 2015-2024 to ensure that the linear trend is not influenced by start or end values. The pattern looks similar.
I also just calculated the linear trend in SSTs from 1983 to 2024 based on NOAA OISST V2.1 (°C per decade).
There is not really a warming hole. There is strong warming in the Labrador sea and on the east coast of the USA and Canada. The region east of the UK seems to warm less.
There is not really a warming hole. There is strong warming in the Labrador sea and on the east coast of the USA and Canada. The region east of the UK seems to warm less.

January 16, 2025 at 12:15 PM
I also just calculated the linear trend in SSTs from 1983 to 2024 based on NOAA OISST V2.1 (°C per decade).
There is not really a warming hole. There is strong warming in the Labrador sea and on the east coast of the USA and Canada. The region east of the UK seems to warm less.
There is not really a warming hole. There is strong warming in the Labrador sea and on the east coast of the USA and Canada. The region east of the UK seems to warm less.
Not sure, which cooling you are referring today. I just used NOAA OISST V2.1 to calculate the trend in SSTs from 1982 to 2024. This is what it looks like (°C per decade).
January 16, 2025 at 12:07 PM
Not sure, which cooling you are referring today. I just used NOAA OISST V2.1 to calculate the trend in SSTs from 1982 to 2024. This is what it looks like (°C per decade).
As our approach relies on the integrated air-sea heat flux between the latitude of the reconstructed AMOC and the Arctic, the latitude can be changed. Thus, the AMOC can be reconstructed with air-sea heat fluxes at any latitude between 26.5°N and 50°N.

January 15, 2025 at 10:11 AM
As our approach relies on the integrated air-sea heat flux between the latitude of the reconstructed AMOC and the Arctic, the latitude can be changed. Thus, the AMOC can be reconstructed with air-sea heat fluxes at any latitude between 26.5°N and 50°N.
We then combined this relationship with observation-based estimates of the air-sea heat flux to reconstruct the decadal-averaged AMOC since the 1960s.
Our reconstructions suggest that the AMOC has not declined yet!!!
Our reconstructions suggest that the AMOC has not declined yet!!!

January 15, 2025 at 10:11 AM
We then combined this relationship with observation-based estimates of the air-sea heat flux to reconstruct the decadal-averaged AMOC since the 1960s.
Our reconstructions suggest that the AMOC has not declined yet!!!
Our reconstructions suggest that the AMOC has not declined yet!!!
As expected based on this explanation, we found a tight relationship between anomalies of the AMOC and anomalies of the heat flux on decadal and centannial timescales across CMIP5 and CMIP6 models.
On annual timescales, other short-term processes strongly weaken the relationship.
On annual timescales, other short-term processes strongly weaken the relationship.

January 15, 2025 at 10:11 AM
As expected based on this explanation, we found a tight relationship between anomalies of the AMOC and anomalies of the heat flux on decadal and centannial timescales across CMIP5 and CMIP6 models.
On annual timescales, other short-term processes strongly weaken the relationship.
On annual timescales, other short-term processes strongly weaken the relationship.
Instead, past AMOC changes have mainly been linked to changes in the air-sea heat flux in the North Atlantic. If the AMOC strengthens, more heat is transported northward and released to the atmosphere. If the AMOC weakens, less heat is transported northward and heat is taken up from the atmosphere.

January 15, 2025 at 10:11 AM
Instead, past AMOC changes have mainly been linked to changes in the air-sea heat flux in the North Atlantic. If the AMOC strengthens, more heat is transported northward and released to the atmosphere. If the AMOC weakens, less heat is transported northward and heat is taken up from the atmosphere.
But did not changes in the sea surface temperature (SST) suggest a decline of the AMOC over the last decades?
In our study, we show that the anomalies in the AMOC and the SST in the subpolar gyre are not well correlated across CMIP6 models, suggesting that SSTs are not a reliable AMOC proxy.
In our study, we show that the anomalies in the AMOC and the SST in the subpolar gyre are not well correlated across CMIP6 models, suggesting that SSTs are not a reliable AMOC proxy.

January 15, 2025 at 10:11 AM
But did not changes in the sea surface temperature (SST) suggest a decline of the AMOC over the last decades?
In our study, we show that the anomalies in the AMOC and the SST in the subpolar gyre are not well correlated across CMIP6 models, suggesting that SSTs are not a reliable AMOC proxy.
In our study, we show that the anomalies in the AMOC and the SST in the subpolar gyre are not well correlated across CMIP6 models, suggesting that SSTs are not a reliable AMOC proxy.
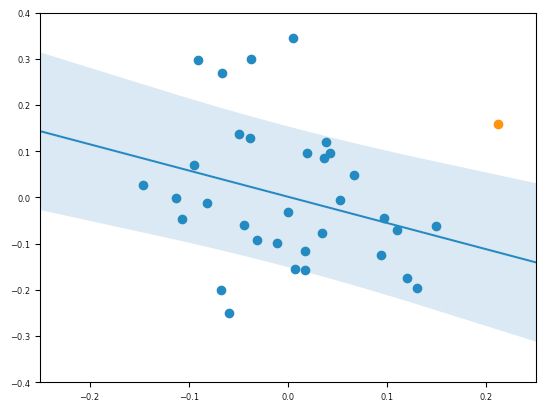
Here is the associated figure with a 1-sigma projection uncertainty. As mentioned earlier, the carbon sink anomaly is out of the 1-sigma range but within the 2-sigma range. Taking in the uncertainty of the 2023 carbon sink anomaly, it overlaps with the 1-sigma range.
December 18, 2024 at 10:38 AM
Here is the associated figure with a 1-sigma projection uncertainty. As mentioned earlier, the carbon sink anomaly is out of the 1-sigma range but within the 2-sigma range. Taking in the uncertainty of the 2023 carbon sink anomaly, it overlaps with the 1-sigma range.