


Patrick Stotz
@patrickstotz.bsky.social
💼 Co-lead data & visualizations @spiegel.de
🗺️ Blogging about maps at letsmakeamap.com
#dataviz #ddj #maps #rstats
🗺️ Blogging about maps at letsmakeamap.com
#dataviz #ddj #maps #rstats
Questionable Rmd-rendering after installing the latest RStudio version.

November 15, 2025 at 9:18 AM
Questionable Rmd-rendering after installing the latest RStudio version.
Destatis hat prima Daten. Nicht auf Ebene von Einzelprodukten, aber doch sehr fein gegliedert und mit monatlichen Werten.
Vor allem die 5- und 10-Steller hier:
www-genesis.destatis.de/datenbank/on...
Das war die Basis für dieses Tool bei uns im Artikel
Vor allem die 5- und 10-Steller hier:
www-genesis.destatis.de/datenbank/on...
Das war die Basis für dieses Tool bei uns im Artikel

November 12, 2025 at 3:02 PM
Destatis hat prima Daten. Nicht auf Ebene von Einzelprodukten, aber doch sehr fein gegliedert und mit monatlichen Werten.
Vor allem die 5- und 10-Steller hier:
www-genesis.destatis.de/datenbank/on...
Das war die Basis für dieses Tool bei uns im Artikel
Vor allem die 5- und 10-Steller hier:
www-genesis.destatis.de/datenbank/on...
Das war die Basis für dieses Tool bei uns im Artikel
Wir haben überwiegend Eigenmarken verwendet, aber nicht nur. Hier die Liste der Produkte

November 12, 2025 at 12:58 PM
Wir haben überwiegend Eigenmarken verwendet, aber nicht nur. Hier die Liste der Produkte
How much more expensive breakfast has become in Germany due to inflation. Our inflation explainer starts with this playful little tool. #dataviz #ddj
www.spiegel.de/wirtschaft/s...
www.spiegel.de/wirtschaft/s...

November 12, 2025 at 10:26 AM
How much more expensive breakfast has become in Germany due to inflation. Our inflation explainer starts with this playful little tool. #dataviz #ddj
www.spiegel.de/wirtschaft/s...
www.spiegel.de/wirtschaft/s...
What would happen if the Amazon rainforest collapsed?
Our look at deforestation and feedback loops.
Also, the perfect occasion to make use of our new MapLibre/Protomaps scroller component.
#maps #dataviz #ddj
www.spiegel.de/wissenschaft...
Our look at deforestation and feedback loops.
Also, the perfect occasion to make use of our new MapLibre/Protomaps scroller component.
#maps #dataviz #ddj
www.spiegel.de/wissenschaft...
November 12, 2025 at 10:22 AM
What would happen if the Amazon rainforest collapsed?
Our look at deforestation and feedback loops.
Also, the perfect occasion to make use of our new MapLibre/Protomaps scroller component.
#maps #dataviz #ddj
www.spiegel.de/wissenschaft...
Our look at deforestation and feedback loops.
Also, the perfect occasion to make use of our new MapLibre/Protomaps scroller component.
#maps #dataviz #ddj
www.spiegel.de/wissenschaft...
Today, we asked our readers to place themselves on a scale from hopeful (Hoffnung) to fearful (Angst) when it comes to climate change.
I know, not representative sample and everything, but this is more devastating than expected.
I know, not representative sample and everything, but this is more devastating than expected.

November 6, 2025 at 4:41 PM
Today, we asked our readers to place themselves on a scale from hopeful (Hoffnung) to fearful (Angst) when it comes to climate change.
I know, not representative sample and everything, but this is more devastating than expected.
I know, not representative sample and everything, but this is more devastating than expected.
Not the only one:
www.spiegel.de/stil/nudeln-...
www.spiegel.de/stil/nudeln-...

October 24, 2025 at 1:41 PM
Not the only one:
www.spiegel.de/stil/nudeln-...
www.spiegel.de/stil/nudeln-...
This is how the war in Ukraine has changed.
For this story, we used Gaussian splatting for the first time, which creates a unique aesthetic. What do you think?
www.spiegel.de/ausland/ukra...
For this story, we used Gaussian splatting for the first time, which creates a unique aesthetic. What do you think?
www.spiegel.de/ausland/ukra...
October 10, 2025 at 8:30 AM
This is how the war in Ukraine has changed.
For this story, we used Gaussian splatting for the first time, which creates a unique aesthetic. What do you think?
www.spiegel.de/ausland/ukra...
For this story, we used Gaussian splatting for the first time, which creates a unique aesthetic. What do you think?
www.spiegel.de/ausland/ukra...
Das Rebhuhn ist der Vogel des Jahres. Glückwünsch!
Auch an das übermotivierte Männchen, dass bei uns mal morgens wiederholt mit Schwung gegen die Scheibe gerannt ist, um sein Spiegelbild zu vertreiben.
www.spiegel.de/wissenschaft...
Auch an das übermotivierte Männchen, dass bei uns mal morgens wiederholt mit Schwung gegen die Scheibe gerannt ist, um sein Spiegelbild zu vertreiben.
www.spiegel.de/wissenschaft...

October 9, 2025 at 12:44 PM
Das Rebhuhn ist der Vogel des Jahres. Glückwünsch!
Auch an das übermotivierte Männchen, dass bei uns mal morgens wiederholt mit Schwung gegen die Scheibe gerannt ist, um sein Spiegelbild zu vertreiben.
www.spiegel.de/wissenschaft...
Auch an das übermotivierte Männchen, dass bei uns mal morgens wiederholt mit Schwung gegen die Scheibe gerannt ist, um sein Spiegelbild zu vertreiben.
www.spiegel.de/wissenschaft...
Some beautiful Datawrapper hacks from our article on the MSCI World. And yes, technically those are custom choropleth maps 😀 #dataviz
www.spiegel.de/wirtschaft/s...
www.spiegel.de/wirtschaft/s...


October 8, 2025 at 7:51 AM
Some beautiful Datawrapper hacks from our article on the MSCI World. And yes, technically those are custom choropleth maps 😀 #dataviz
www.spiegel.de/wirtschaft/s...
www.spiegel.de/wirtschaft/s...
That's the one. Scribbly and proudly marked as property by some kids around 1900. (3/3)

September 28, 2025 at 4:08 PM
That's the one. Scribbly and proudly marked as property by some kids around 1900. (3/3)
It also features numerous maps in "Merkator's projection". Probs, however, for the scale specification, which is referred to as the "equatorial scale". (2/3)

September 28, 2025 at 4:08 PM
It also features numerous maps in "Merkator's projection". Probs, however, for the scale specification, which is referred to as the "equatorial scale". (2/3)
More basement findings. This time a German school atlas from 1897.
Below the globes is an illustration with the highest peaks. It lists Gaurishankar as the highest with 8810 m. Looks like they mixed it up with Mt. Everest...(1/3)
Below the globes is an illustration with the highest peaks. It lists Gaurishankar as the highest with 8810 m. Looks like they mixed it up with Mt. Everest...(1/3)

September 28, 2025 at 4:08 PM
More basement findings. This time a German school atlas from 1897.
Below the globes is an illustration with the highest peaks. It lists Gaurishankar as the highest with 8810 m. Looks like they mixed it up with Mt. Everest...(1/3)
Below the globes is an illustration with the highest peaks. It lists Gaurishankar as the highest with 8810 m. Looks like they mixed it up with Mt. Everest...(1/3)

Congrats, you've just called this "a bunch of dictators".
Plus, it's a difference if you want to inflate the size of a country or if you want it to be equally sized compared to other parts of the world.
Plus, it's a difference if you want to inflate the size of a country or if you want it to be equally sized compared to other parts of the world.

September 18, 2025 at 4:33 PM
Congrats, you've just called this "a bunch of dictators".
Plus, it's a difference if you want to inflate the size of a country or if you want it to be equally sized compared to other parts of the world.
Plus, it's a difference if you want to inflate the size of a country or if you want it to be equally sized compared to other parts of the world.
More outstanding maps in this Mercator / 'Correct The Map' explainer by Reuters 😍
www.reuters.com/graphics/AFR...
www.reuters.com/graphics/AFR...


September 18, 2025 at 12:45 PM
More outstanding maps in this Mercator / 'Correct The Map' explainer by Reuters 😍
www.reuters.com/graphics/AFR...
www.reuters.com/graphics/AFR...
Though a few weeks old, this FT article on ICE deportation flights makes excellent use of maps (both on desktop and mobile) #dataviz #maps
ig.ft.com/us-deportati...
ig.ft.com/us-deportati...

September 18, 2025 at 12:31 PM
Though a few weeks old, this FT article on ICE deportation flights makes excellent use of maps (both on desktop and mobile) #dataviz #maps
ig.ft.com/us-deportati...
ig.ft.com/us-deportati...
Yes, slightly. No flawless results so far, though.
Great game BTW!
Great game BTW!

September 18, 2025 at 12:20 PM
Yes, slightly. No flawless results so far, though.
Great game BTW!
Great game BTW!
Söder auf Instagram. Prost Mahlzeit!

August 8, 2025 at 10:33 AM
Söder auf Instagram. Prost Mahlzeit!

Die BILD ist derweil schon bei alternativen Fakten angekommen
July 26, 2025 at 9:47 AM
Die BILD ist derweil schon bei alternativen Fakten angekommen
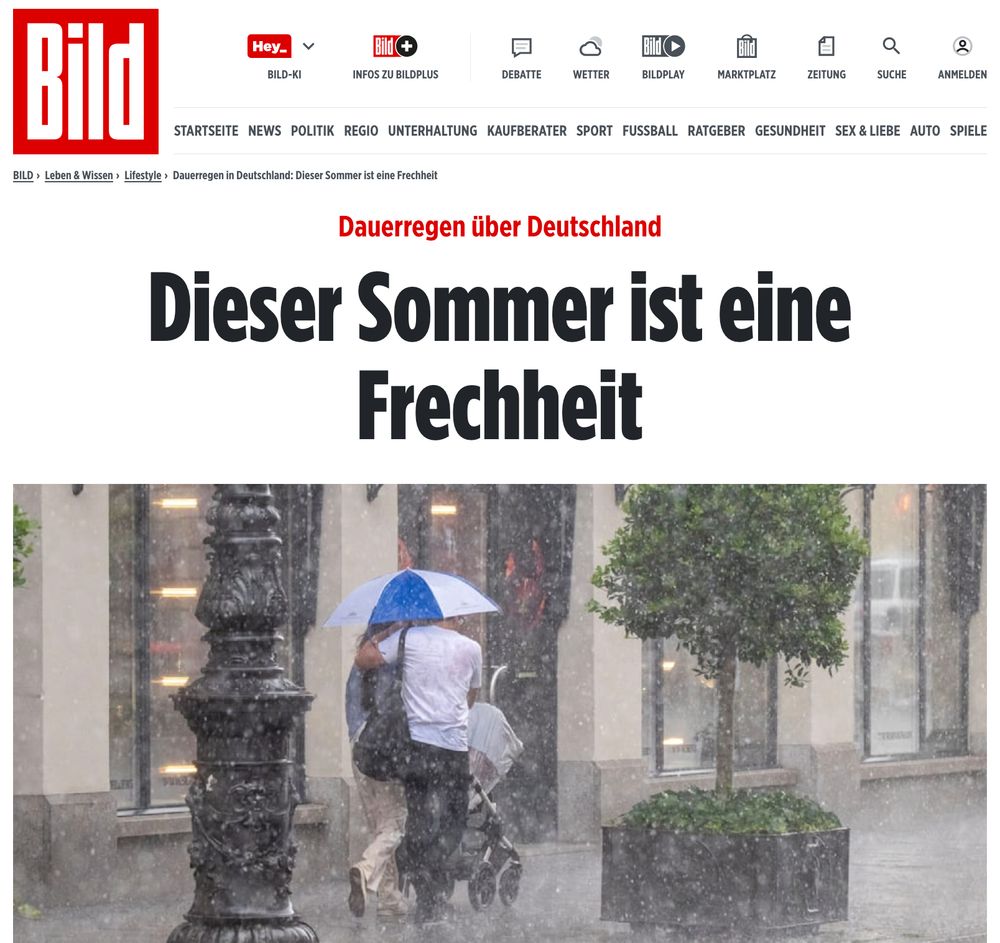
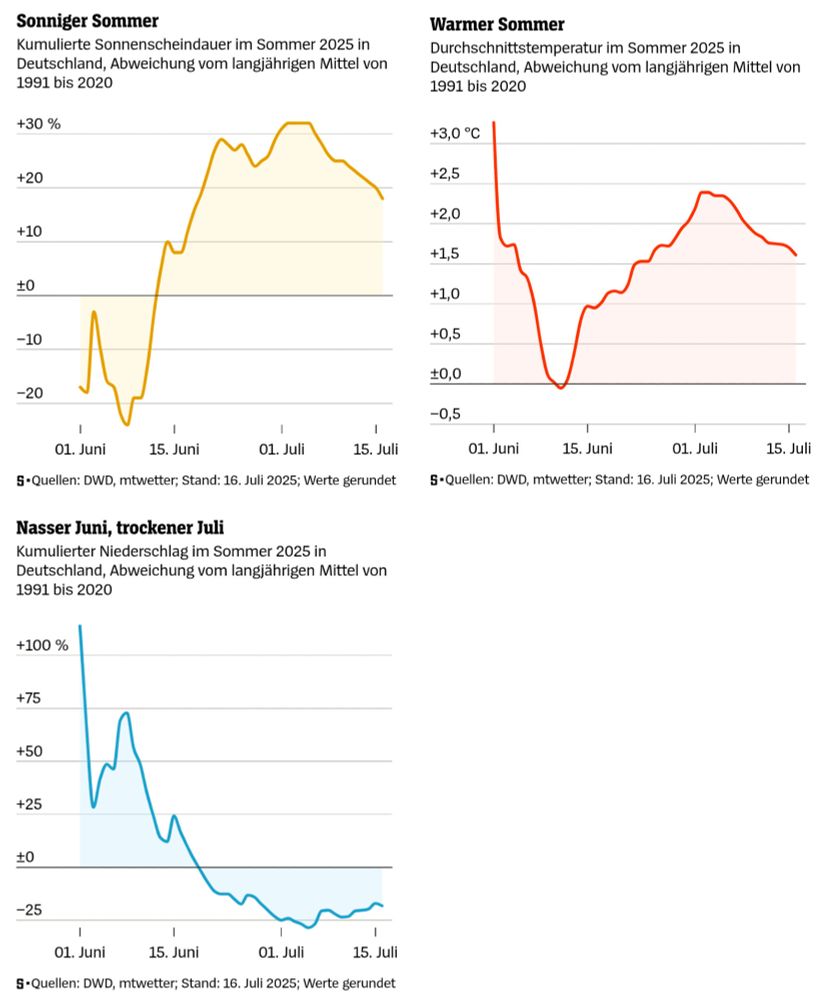
The new reality of climate change. It's raining in Germany, and the tabloid BILD headlines “This summer is an outrage.”
The data: So far, the summer has been fairly sunny, very warm, and rather dry.
The data: So far, the summer has been fairly sunny, very warm, and rather dry.
July 26, 2025 at 9:45 AM
The new reality of climate change. It's raining in Germany, and the tabloid BILD headlines “This summer is an outrage.”
The data: So far, the summer has been fairly sunny, very warm, and rather dry.
The data: So far, the summer has been fairly sunny, very warm, and rather dry.
Der Sommer war bislang ziemlich sonnig, sehr warm und eher trocken. Fühlt sich anders an? Das zeigt, wie sehr wir uns bereits an neue Extreme gewöhnt haben. (1/3)


July 26, 2025 at 9:35 AM
Der Sommer war bislang ziemlich sonnig, sehr warm und eher trocken. Fühlt sich anders an? Das zeigt, wie sehr wir uns bereits an neue Extreme gewöhnt haben. (1/3)
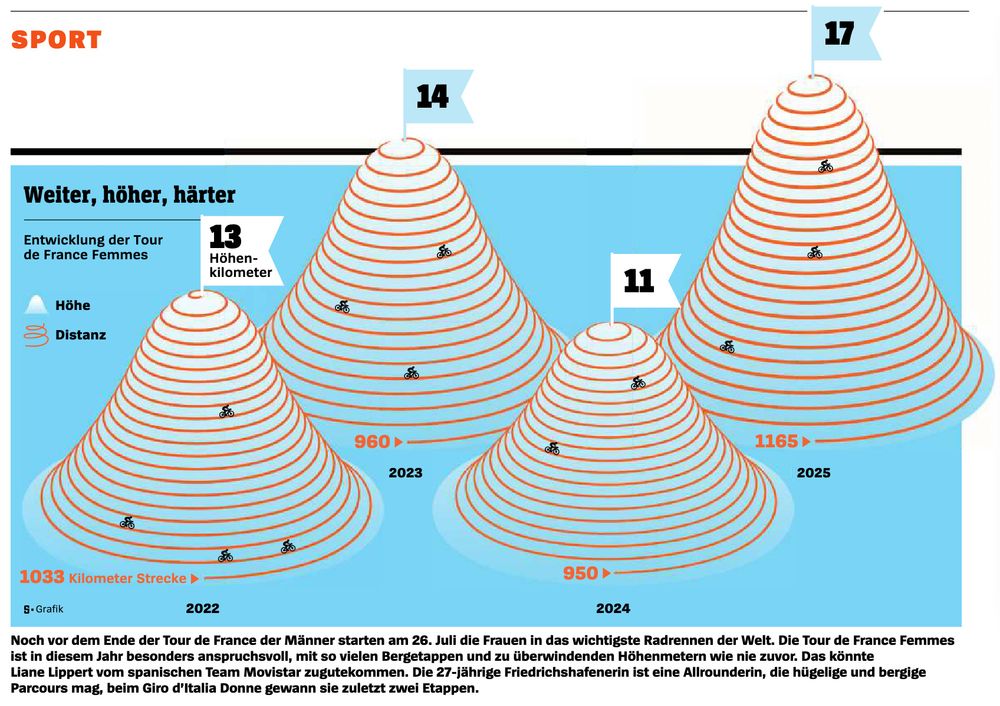
The evolution of the Tour de France Femmes, as featured in our weekly, often playful, sports graphic from the @spiegel.de magazine. #dataviz
July 25, 2025 at 8:06 AM
The evolution of the Tour de France Femmes, as featured in our weekly, often playful, sports graphic from the @spiegel.de magazine. #dataviz
ChatGPT (4o) hat von sich aus angeboten eine Karte zu erstellen (ging um den Anschluss der Este an die Elbe). Das Ergebnis sieht ok aus, ist aber inhaltlich leider komplett Bullshit

July 21, 2025 at 8:11 AM
ChatGPT (4o) hat von sich aus angeboten eine Karte zu erstellen (ging um den Anschluss der Este an die Elbe). Das Ergebnis sieht ok aus, ist aber inhaltlich leider komplett Bullshit