


It's now even easier to build on-brand data visualizations in Observable Canvases. 🎨 With our new data-driven colors, you can quickly define custom color scales based on categories in your data. Learn how Observable helps you create fast, consistently branded charts: buff.ly/YCkFGLB
November 3, 2025 at 8:31 PM
It's now even easier to build on-brand data visualizations in Observable Canvases. 🎨 With our new data-driven colors, you can quickly define custom color scales based on categories in your data. Learn how Observable helps you create fast, consistently branded charts: buff.ly/YCkFGLB
🕸️ For our final Observa-bite of the month we are adding radar charts (aka spider charts) to Observable Canvases. Check out radar charts, and all of our advanced chart types, available in canvases: buff.ly/l76pX6m
October 30, 2025 at 3:54 PM
🕸️ For our final Observa-bite of the month we are adding radar charts (aka spider charts) to Observable Canvases. Check out radar charts, and all of our advanced chart types, available in canvases: buff.ly/l76pX6m
Observable’s built-in charts are designed by top data visualization developers, interactive by default, & fast — even with big data. We’ve expanded our suite of advanced types to include Sankeys, beeswarms, arc maps & more. Meet our state-of-the-art data visualizations 👉 buff.ly/eZYyQYd
October 24, 2025 at 3:54 PM
Observable’s built-in charts are designed by top data visualization developers, interactive by default, & fast — even with big data. We’ve expanded our suite of advanced types to include Sankeys, beeswarms, arc maps & more. Meet our state-of-the-art data visualizations 👉 buff.ly/eZYyQYd
Table nodes in Observable Canvases are powerful for fast, UI-based data wrangling. In addition to interactive filtering and column management, you can now derive new columns, convert data types, and limit rows — all in the same place. Learn more: buff.ly/l76pX6m
October 23, 2025 at 7:30 PM
Table nodes in Observable Canvases are powerful for fast, UI-based data wrangling. In addition to interactive filtering and column management, you can now derive new columns, convert data types, and limit rows — all in the same place. Learn more: buff.ly/l76pX6m
🪄 Chart theming is here! Now, in Observable Canvases, you can apply custom color palettes and fonts to create dashboards that are automatically on-brand. Get started with dashboards and chart theming here: buff.ly/I1nu82R
October 14, 2025 at 3:54 PM
🪄 Chart theming is here! Now, in Observable Canvases, you can apply custom color palettes and fonts to create dashboards that are automatically on-brand. Get started with dashboards and chart theming here: buff.ly/I1nu82R
🐝 Beeswarm charts are a powerful way to explore quantitative variable distributions, and a useful alternative to more aggregated options like histograms & box plots. Meet our expanding library of state-of-the-art, interactive charts in Observable Canvases: buff.ly/SLQY7SD
October 3, 2025 at 3:31 PM
🐝 Beeswarm charts are a powerful way to explore quantitative variable distributions, and a useful alternative to more aggregated options like histograms & box plots. Meet our expanding library of state-of-the-art, interactive charts in Observable Canvases: buff.ly/SLQY7SD
Slow-loading tables and overworked browsers can bog down analysis when you're exploring large datasets. In our new post, we explain how table virtualization in Observable Canvas keeps data work fast and fluid — even with big data, and when viewing complex, branching analyses: buff.ly/7cfqsQA
September 18, 2025 at 3:54 PM
Slow-loading tables and overworked browsers can bog down analysis when you're exploring large datasets. In our new post, we explain how table virtualization in Observable Canvas keeps data work fast and fluid — even with big data, and when viewing complex, branching analyses: buff.ly/7cfqsQA
Treemaps help you go beyond donut charts and stacked bars to visualize parts of a whole for hierarchical data. Learn how canvases put state-of-the-art, interactive charts like treemaps, Sankey diagrams, beeswarms, bump charts, and more at your fingertips: buff.ly/DaE8zgO
September 17, 2025 at 7:31 PM
Treemaps help you go beyond donut charts and stacked bars to visualize parts of a whole for hierarchical data. Learn how canvases put state-of-the-art, interactive charts like treemaps, Sankey diagrams, beeswarms, bump charts, and more at your fingertips: buff.ly/DaE8zgO
Sankey diagrams make it easy to see how quantities flow through a system, but they're tough to build from scratch.
In Observable Canvases, you can create Sankey diagrams (plus arc maps, beeswarms, & more) in minutes — all optimized for clarity and performance: buff.ly/gsd0cpg
In Observable Canvases, you can create Sankey diagrams (plus arc maps, beeswarms, & more) in minutes — all optimized for clarity and performance: buff.ly/gsd0cpg
September 11, 2025 at 7:31 PM
Sankey diagrams make it easy to see how quantities flow through a system, but they're tough to build from scratch.
In Observable Canvases, you can create Sankey diagrams (plus arc maps, beeswarms, & more) in minutes — all optimized for clarity and performance: buff.ly/gsd0cpg
In Observable Canvases, you can create Sankey diagrams (plus arc maps, beeswarms, & more) in minutes — all optimized for clarity and performance: buff.ly/gsd0cpg
Bump charts show how rankings shift over time, and are a great option when order matters more than absolute values. In Observable Canvases, you can now build & share responsive bump charts with just a few clicks. See what's new in our summer release: buff.ly/ZDxrAvt
September 9, 2025 at 7:30 PM
Bump charts show how rankings shift over time, and are a great option when order matters more than absolute values. In Observable Canvases, you can now build & share responsive bump charts with just a few clicks. See what's new in our summer release: buff.ly/ZDxrAvt
For one of the most common operations in all of data wrangling, implementing UI-based data joins is anything but straightforward. Software engineer Tony Sullivan shares some unexpected challenges behind joins and how we handle them in Observable Canvases: buff.ly/4FRU9C9
September 4, 2025 at 7:30 PM
For one of the most common operations in all of data wrangling, implementing UI-based data joins is anything but straightforward. Software engineer Tony Sullivan shares some unexpected challenges behind joins and how we handle them in Observable Canvases: buff.ly/4FRU9C9
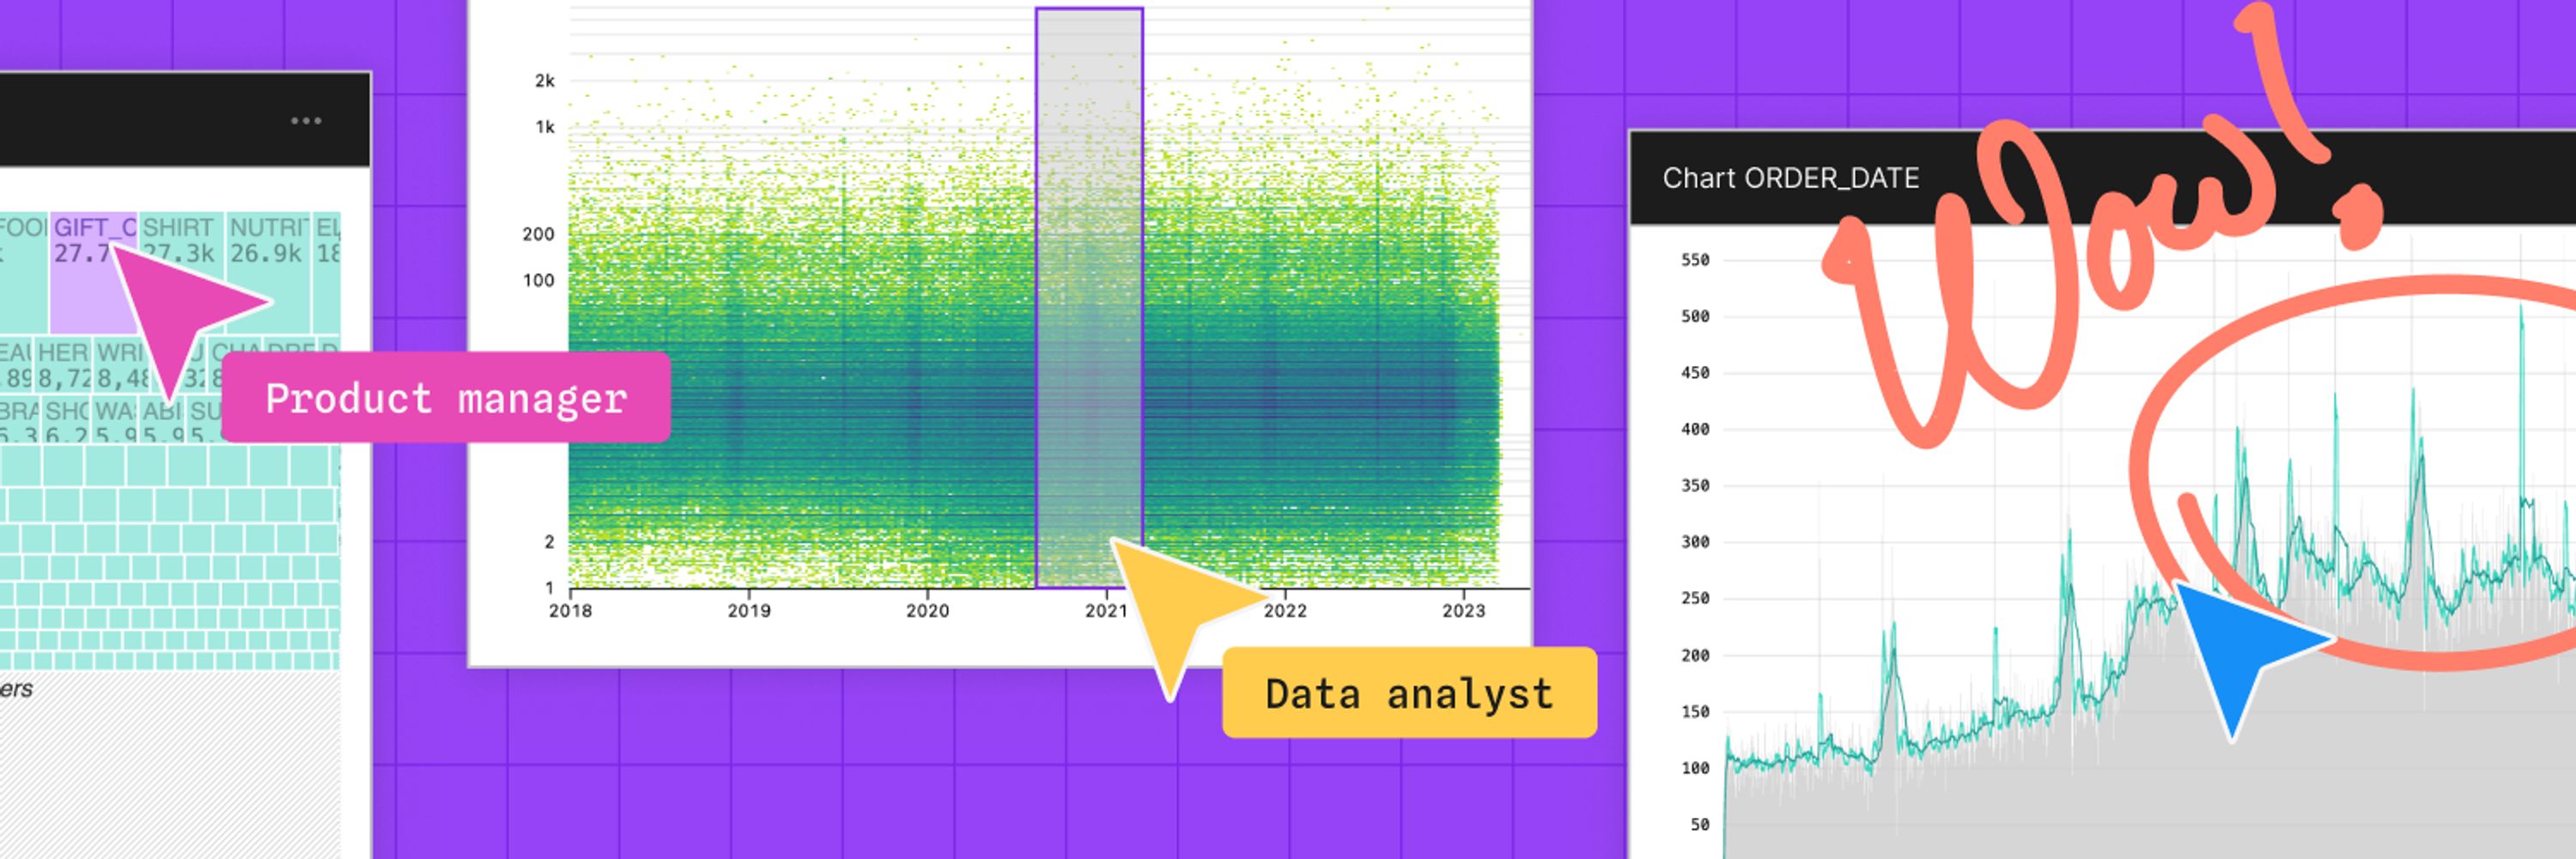
Observable Canvases make it lightweight to share interactive charts and tables as a natural extension of your data analysis. Embed canvas nodes into your internal data apps, or draw a frame around part of your canvas to generate a tidy dashboard view. Learn more: buff.ly/Bw8nukG
September 2, 2025 at 3:31 PM
Observable Canvases make it lightweight to share interactive charts and tables as a natural extension of your data analysis. Embed canvas nodes into your internal data apps, or draw a frame around part of your canvas to generate a tidy dashboard view. Learn more: buff.ly/Bw8nukG
In Observable Canvases, we’re putting advanced, interactive charts at your fingertips. Make Sankey diagrams, beeswarm charts, arc maps, bump charts, and more in just a few clicks. Learn how canvases streamline data visualization and analysis: buff.ly/ATVg0sw
August 28, 2025 at 3:31 PM
In Observable Canvases, we’re putting advanced, interactive charts at your fingertips. Make Sankey diagrams, beeswarm charts, arc maps, bump charts, and more in just a few clicks. Learn how canvases streamline data visualization and analysis: buff.ly/ATVg0sw
AI can speed up steps in throughout data analysis from initial data profiling to final chart development. For exploratory analysis, use AI to summarize database schemas and contents, automate tedious data wrangling tasks, and draft new charts. Learn more: buff.ly/5DzuzZ7
July 31, 2025 at 8:30 PM
AI can speed up steps in throughout data analysis from initial data profiling to final chart development. For exploratory analysis, use AI to summarize database schemas and contents, automate tedious data wrangling tasks, and draft new charts. Learn more: buff.ly/5DzuzZ7