


Nikhil Datta
@nikdatta.bsky.social
Economist. Assistant prof @ warwick, fellow @ CEP LSE, PhD alum @ UCL. Child of immigrants. Serene since 17/06/06. http://nikhil-datta.com
We then turn to planning designations. 15% of the gap lies in Greenbelt areas – but it’s very concentrated. Allowing building on just 10% of England’s greenbelts with the highest gap would be a huge positive. This particularly pronounced around the North and Northwest. 11/n

November 11, 2025 at 11:39 AM
We then turn to planning designations. 15% of the gap lies in Greenbelt areas – but it’s very concentrated. Allowing building on just 10% of England’s greenbelts with the highest gap would be a huge positive. This particularly pronounced around the North and Northwest. 11/n
Arguably the most important finding is that 96% of the variation is within LAs rather than between. Many LAs have areas of both high and low gaps. Croydon for example has OAs in the top 6th percentile and bottom 1st percentile. 9/n

November 11, 2025 at 11:39 AM
Arguably the most important finding is that 96% of the variation is within LAs rather than between. Many LAs have areas of both high and low gaps. Croydon for example has OAs in the top 6th percentile and bottom 1st percentile. 9/n
The proportion of densification has fallen over the past 2 decades, while urban extensions have grown along with small town extensions. We show that urban extensions are slower and more bureaucratic, with longer planning times and slower build-out rates compared to densification. 6/n

November 11, 2025 at 11:39 AM
The proportion of densification has fallen over the past 2 decades, while urban extensions have grown along with small town extensions. We show that urban extensions are slower and more bureaucratic, with longer planning times and slower build-out rates compared to densification. 6/n
We then classify every new build by where it happened—combining settlement size, distance to the city centre, and local context:
New Rural Developments – small villages & rural areas
Small Town Extensions – around small towns
Urban Extensions – city outskirts
Densification – inner-city builds
5/n
New Rural Developments – small villages & rural areas
Small Town Extensions – around small towns
Urban Extensions – city outskirts
Densification – inner-city builds
5/n

November 11, 2025 at 11:39 AM
We then classify every new build by where it happened—combining settlement size, distance to the city centre, and local context:
New Rural Developments – small villages & rural areas
Small Town Extensions – around small towns
Urban Extensions – city outskirts
Densification – inner-city builds
5/n
New Rural Developments – small villages & rural areas
Small Town Extensions – around small towns
Urban Extensions – city outskirts
Densification – inner-city builds
5/n
70% of new builds have worse than average job access than the existing housing stock, and this figure is even worse when considering only public transport. 4/n

November 11, 2025 at 11:39 AM
70% of new builds have worse than average job access than the existing housing stock, and this figure is even worse when considering only public transport. 4/n
18% of all new builds are now in rural villages or small towns without a secondary school or GP up from 11% in 2010. 3/n

November 11, 2025 at 11:39 AM
18% of all new builds are now in rural villages or small towns without a secondary school or GP up from 11% in 2010. 3/n
Where should Britain build 1.5 million homes?
@amritakulka.bsky.social l and I analysed 20 billion housing searches + availability to map demand at a hyper-local level.
Map 👉 wheretobuild.warwick.ac.uk
Full + 350 LA reports 👉 www.warwick.ac.uk/cage/whereto...
@cagewarwick.bsky.social
1/n
@amritakulka.bsky.social l and I analysed 20 billion housing searches + availability to map demand at a hyper-local level.
Map 👉 wheretobuild.warwick.ac.uk
Full + 350 LA reports 👉 www.warwick.ac.uk/cage/whereto...
@cagewarwick.bsky.social
1/n

November 11, 2025 at 11:39 AM
Where should Britain build 1.5 million homes?
@amritakulka.bsky.social l and I analysed 20 billion housing searches + availability to map demand at a hyper-local level.
Map 👉 wheretobuild.warwick.ac.uk
Full + 350 LA reports 👉 www.warwick.ac.uk/cage/whereto...
@cagewarwick.bsky.social
1/n
@amritakulka.bsky.social l and I analysed 20 billion housing searches + availability to map demand at a hyper-local level.
Map 👉 wheretobuild.warwick.ac.uk
Full + 350 LA reports 👉 www.warwick.ac.uk/cage/whereto...
@cagewarwick.bsky.social
1/n
Glad to see my new piece in The Conversation is stimulating informed debate

October 25, 2025 at 6:49 AM
Glad to see my new piece in The Conversation is stimulating informed debate
www.thisismoney.co.uk/money/cars/a...
Good to see coverage of mine and Johannes Brinkmann's @cagewarwick.bsky.social on the RTFO. Here's a nice graph showing the benefits...
Good to see coverage of mine and Johannes Brinkmann's @cagewarwick.bsky.social on the RTFO. Here's a nice graph showing the benefits...
July 17, 2025 at 8:47 AM
www.thisismoney.co.uk/money/cars/a...
Good to see coverage of mine and Johannes Brinkmann's @cagewarwick.bsky.social on the RTFO. Here's a nice graph showing the benefits...
Good to see coverage of mine and Johannes Brinkmann's @cagewarwick.bsky.social on the RTFO. Here's a nice graph showing the benefits...

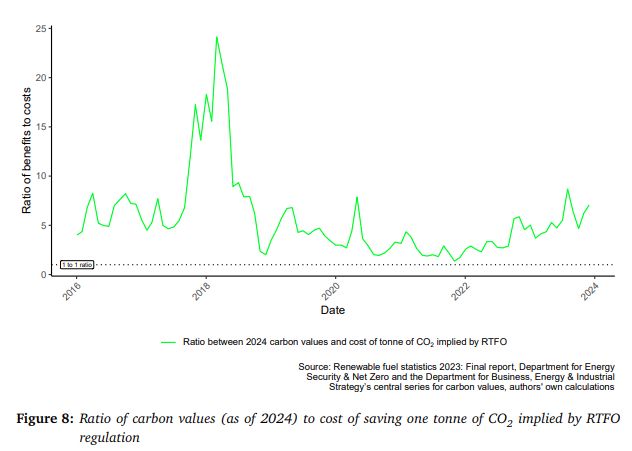
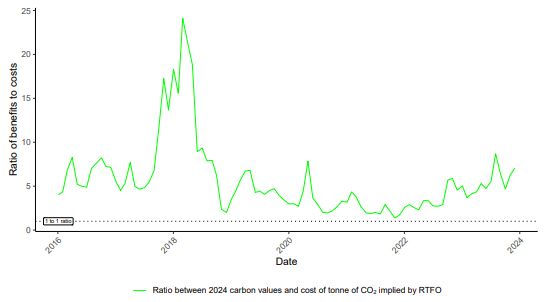
5. Based on the government's current estimated cost of overall damage to society per tonne of carbon (£312), the benefits of the policy far outweigh the cost. For every £1 cost to consumers, the policy has saved between £1.37 to £25 worth of carbon damage over time. The average lies at £5.70.
April 24, 2025 at 10:12 AM
5. Based on the government's current estimated cost of overall damage to society per tonne of carbon (£312), the benefits of the policy far outweigh the cost. For every £1 cost to consumers, the policy has saved between £1.37 to £25 worth of carbon damage over time. The average lies at £5.70.
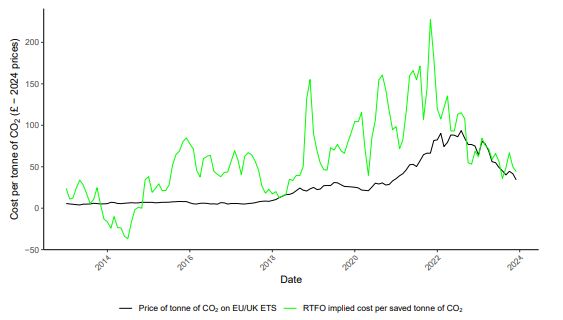
4. The implied cost per tonne of co2 saved due to the RTFO (in 2024 prices) in turn experiences a lot of volatility, especially when compared to other policies. Within 2018 alone the cost of saving a tonne of carbon ranged from £13 in March to over 10 times that amount 9 months later.
April 24, 2025 at 10:12 AM
4. The implied cost per tonne of co2 saved due to the RTFO (in 2024 prices) in turn experiences a lot of volatility, especially when compared to other policies. Within 2018 alone the cost of saving a tonne of carbon ranged from £13 in March to over 10 times that amount 9 months later.
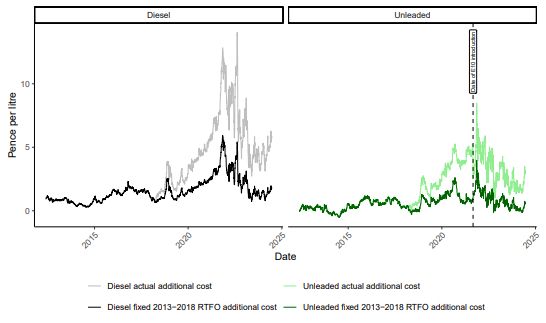
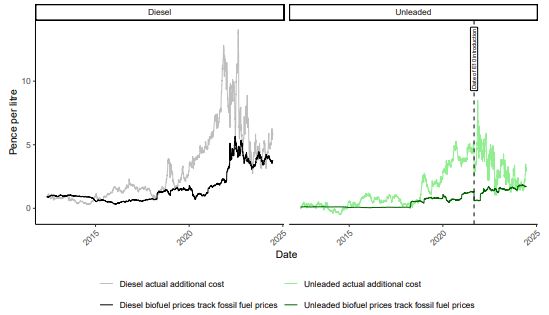
... We decompose the pump price increases by carrying out two exercises, one where we fix the RTFO at the 2013-2018 level, and one where we fix biofuel prices to track fossils. The decompositions show a role for both the RTFO level & changes in prices to biofuels. The latter drive volatility.
April 24, 2025 at 10:12 AM
... We decompose the pump price increases by carrying out two exercises, one where we fix the RTFO at the 2013-2018 level, and one where we fix biofuel prices to track fossils. The decompositions show a role for both the RTFO level & changes in prices to biofuels. The latter drive volatility.
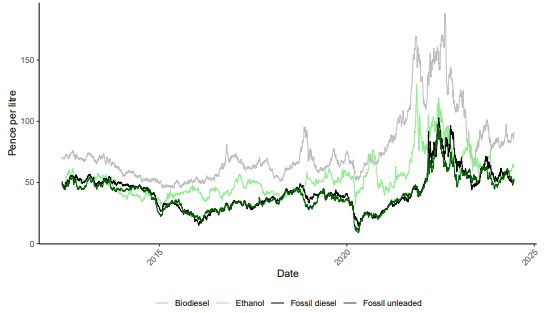
3. The cost increase is driven by a combination of the increase in the RTFO, as well as increases in biofuels (ethanol and biodiesel). Biodiesel is notably always higher than fossil fuels by quite a considerable amount...
April 24, 2025 at 10:12 AM
3. The cost increase is driven by a combination of the increase in the RTFO, as well as increases in biofuels (ethanol and biodiesel). Biodiesel is notably always higher than fossil fuels by quite a considerable amount...
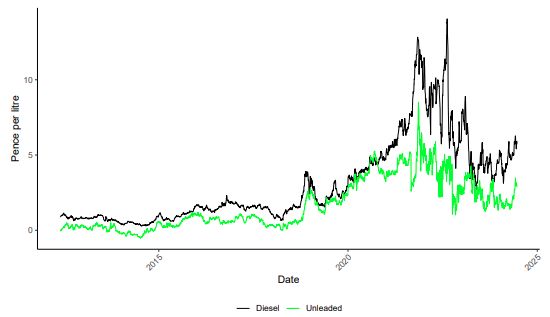
2. The RTFO has pushed up pump prices, and the increase has varied a lot. Impacts have ranged from negligible, to substantial. In 2021 the RTFO added up to 8ppl to unleaded, and in 2022 up to 14ppl to diesel. The RTFO has also increased volatility in pump prices.
April 24, 2025 at 10:12 AM
2. The RTFO has pushed up pump prices, and the increase has varied a lot. Impacts have ranged from negligible, to substantial. In 2021 the RTFO added up to 8ppl to unleaded, and in 2022 up to 14ppl to diesel. The RTFO has also increased volatility in pump prices.
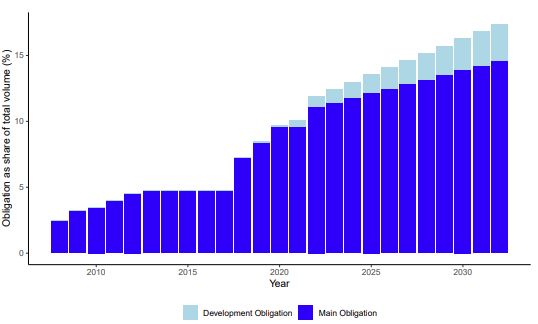
1. The RTFO has risen considerably since introduction. The current obligation stands at 13.5%,having started at 2.5%.
April 24, 2025 at 10:12 AM
1. The RTFO has risen considerably since introduction. The current obligation stands at 13.5%,having started at 2.5%.
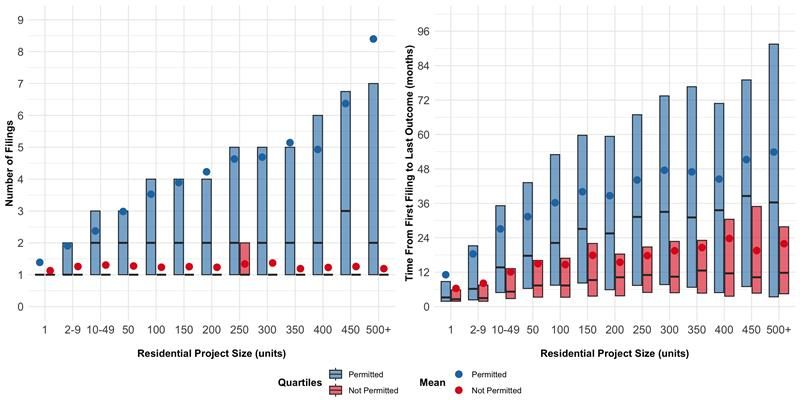
2. Rejection rates don't tell us much. They've been flat (and non-zero) for a long time, but that doesn't mean planning hasn't become more cumbersome. Our research shows that projects face large amounts of paperwork, regulation and delays, particularly larger projects... 3/n
March 12, 2025 at 10:51 AM
2. Rejection rates don't tell us much. They've been flat (and non-zero) for a long time, but that doesn't mean planning hasn't become more cumbersome. Our research shows that projects face large amounts of paperwork, regulation and delays, particularly larger projects... 3/n
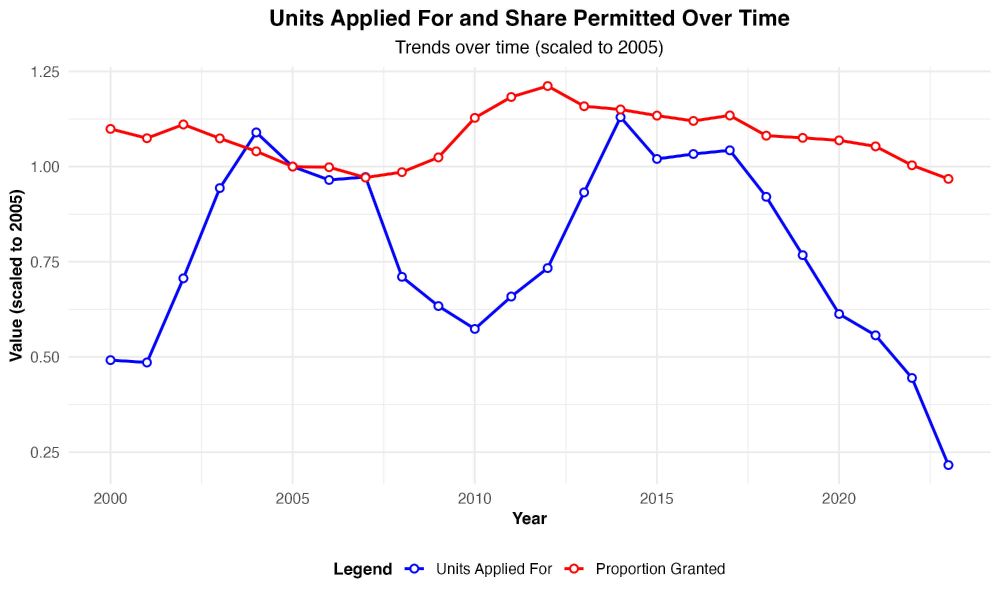
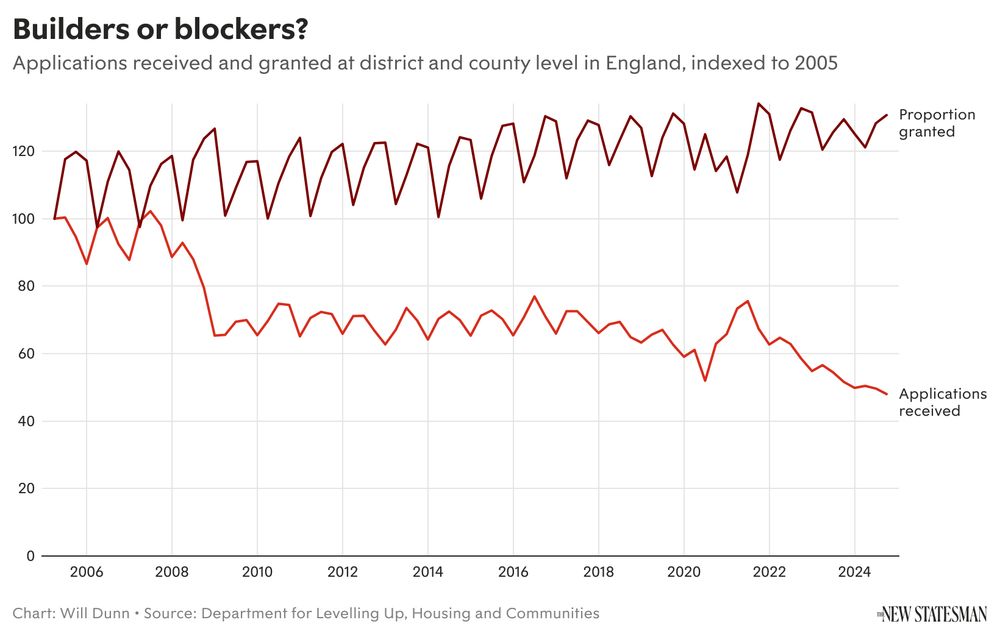
1. Applications does not equal total units. We break down each application into # housing units in our work, and show there has been a massive compositional shift to big housing projects. When adjusting for this, # units applied for didn't start declining until 2018 (left image is ours). 2/n
March 12, 2025 at 10:51 AM
1. Applications does not equal total units. We break down each application into # housing units in our work, and show there has been a massive compositional shift to big housing projects. When adjusting for this, # units applied for didn't start declining until 2018 (left image is ours). 2/n
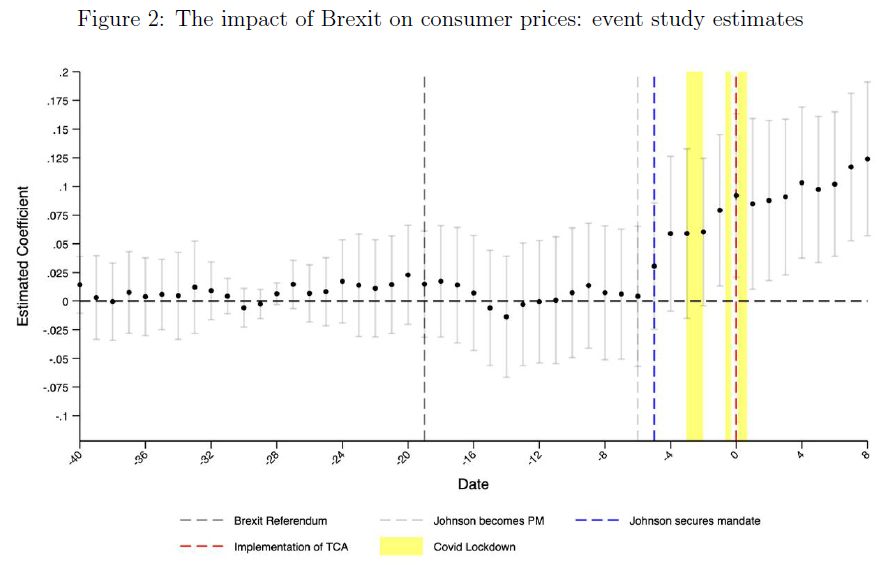
5 years ago today Britain left the EU. Between 2020-2023, Brexit drove up food prices by 4% a year on average.
Research from Jan David Bakker, @joshdelyon.bsky.social , @richarddavies.bsky.social and myself.
You can read the paper here: tinyurl.com/27vjakwa
Research from Jan David Bakker, @joshdelyon.bsky.social , @richarddavies.bsky.social and myself.
You can read the paper here: tinyurl.com/27vjakwa
January 31, 2025 at 12:03 PM
5 years ago today Britain left the EU. Between 2020-2023, Brexit drove up food prices by 4% a year on average.
Research from Jan David Bakker, @joshdelyon.bsky.social , @richarddavies.bsky.social and myself.
You can read the paper here: tinyurl.com/27vjakwa
Research from Jan David Bakker, @joshdelyon.bsky.social , @richarddavies.bsky.social and myself.
You can read the paper here: tinyurl.com/27vjakwa
The view from my office this morning weren't half bad

January 12, 2025 at 9:10 AM
The view from my office this morning weren't half bad
10. On the supply side, ZHC job adverts get 25% MORE applicants for the otherwise same job, in the same establishment, in the same year. (For you ln(1+x) haters there are a bazillion other specs using other transformations which give the same result in the appendix). 13/n

October 9, 2024 at 9:59 AM
10. On the supply side, ZHC job adverts get 25% MORE applicants for the otherwise same job, in the same establishment, in the same year. (For you ln(1+x) haters there are a bazillion other specs using other transformations which give the same result in the appendix). 13/n
9. Lastly, on the demand side I don't find any evidence that slack labour markets allow firms to take on more ZHC workers. I essentially find the opposite. 12/n

October 9, 2024 at 9:59 AM
9. Lastly, on the demand side I don't find any evidence that slack labour markets allow firms to take on more ZHC workers. I essentially find the opposite. 12/n
8. I also show firms use ZHCs to weather (sorry) demand shocks. Some of my establishments are al-fresco and so exposed to weather shocks. Al-fresco establishments are shown to adjust ZHC hours v flexibly wrt weather conditions, which is a proxy for demand in this setting. 11/n

October 9, 2024 at 9:57 AM
8. I also show firms use ZHCs to weather (sorry) demand shocks. Some of my establishments are al-fresco and so exposed to weather shocks. Al-fresco establishments are shown to adjust ZHC hours v flexibly wrt weather conditions, which is a proxy for demand in this setting. 11/n
7. ZHCs also get used to respond to separations - when fixed hour workers leave, ZHCs increase temporarily. The first figure is cover rates at the exact job role level, the second allows for substitutability across roles. It peaks at around 21%, close to the absentee cover. 10/n

October 9, 2024 at 9:57 AM
7. ZHCs also get used to respond to separations - when fixed hour workers leave, ZHCs increase temporarily. The first figure is cover rates at the exact job role level, the second allows for substitutability across roles. It peaks at around 21%, close to the absentee cover. 10/n
6. On the firm side, using data on unexpected worker absences (e.g. sick days) I show ZHCs get used as a form of cover for temporary absentee shocks. I find cover rates of about 25% when we allow for job-role substitutability (e.g. a cleaner can cover for a waiter). 9/n

October 9, 2024 at 9:57 AM
6. On the firm side, using data on unexpected worker absences (e.g. sick days) I show ZHCs get used as a form of cover for temporary absentee shocks. I find cover rates of about 25% when we allow for job-role substitutability (e.g. a cleaner can cover for a waiter). 9/n