Stanford U Prof, Civil & Env Eng; Director, Atmos/Energy Program
Cofounder-Solutions Project; Appeared on Letterman
Testified Held v Montana
https://web.stanford.edu/group/efmh/jacobson/
Stanford.io/Jacobson
SD, IA, KS, WY, OK, ND, NM
Providing up to 85% of demand (in SD)

SD, IA, KS, WY, OK, ND, NM
Providing up to 85% of demand (in SD)
More WindWaterSolar means much cheaper electricity
Of the 12 states with the most (50-121%) WWS supply as a % of demand, 11 have electricity prices 1.9-5.2 c/kWh below the US average
web.stanford.edu/group/efmh/j...
web.stanford.edu/group/efmh/j...

More WindWaterSolar means much cheaper electricity
Of the 12 states with the most (50-121%) WWS supply as a % of demand, 11 have electricity prices 1.9-5.2 c/kWh below the US average
web.stanford.edu/group/efmh/j...
web.stanford.edu/group/efmh/j...
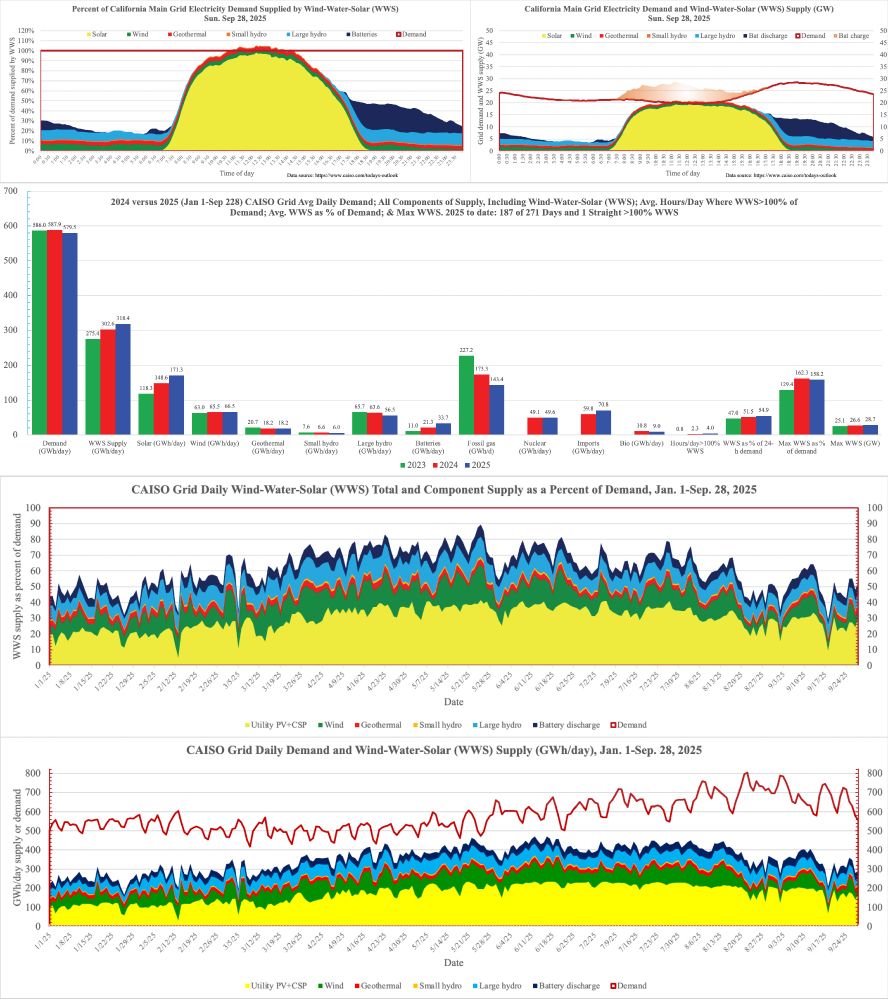
53% of all '25 demand supplied by in-state WWS (v 49.7% in '24 & 45.7% in '23)
Gas down 16% v '24 & 37% v '23
Demand down 2.1% v '24 & 1.4% v '23 due to growth of roof PV

53% of all '25 demand supplied by in-state WWS (v 49.7% in '24 & 45.7% in '23)
Gas down 16% v '24 & 37% v '23
Demand down 2.1% v '24 & 1.4% v '23 due to growth of roof PV
WindWaterSolar met >100% of demand for parts of 216th & 217th days of 2025.
Fossil gas down 37.3%, solar up 42.6%, batteries up 198%, demand down 1.4% vs '23
Average of 3.8 h/day > 100% WWS among all days in '25 v 0.7 h/day in '23

WindWaterSolar met >100% of demand for parts of 216th & 217th days of 2025.
Fossil gas down 37.3%, solar up 42.6%, batteries up 198%, demand down 1.4% vs '23
Average of 3.8 h/day > 100% WWS among all days in '25 v 0.7 h/day in '23
Gas down 17.5% v '24 & 37.4% v '23
Solar up 15% v '24 & 43% v '23
Batteries up 56% v '24 & 198% v '23
61.4% of demand in '25 met by WWS (54% in-state +7.5% imports=58% of 12.9% imports)

Gas down 17.5% v '24 & 37.4% v '23
Solar up 15% v '24 & 43% v '23
Batteries up 56% v '24 & 198% v '23
61.4% of demand in '25 met by WWS (54% in-state +7.5% imports=58% of 12.9% imports)
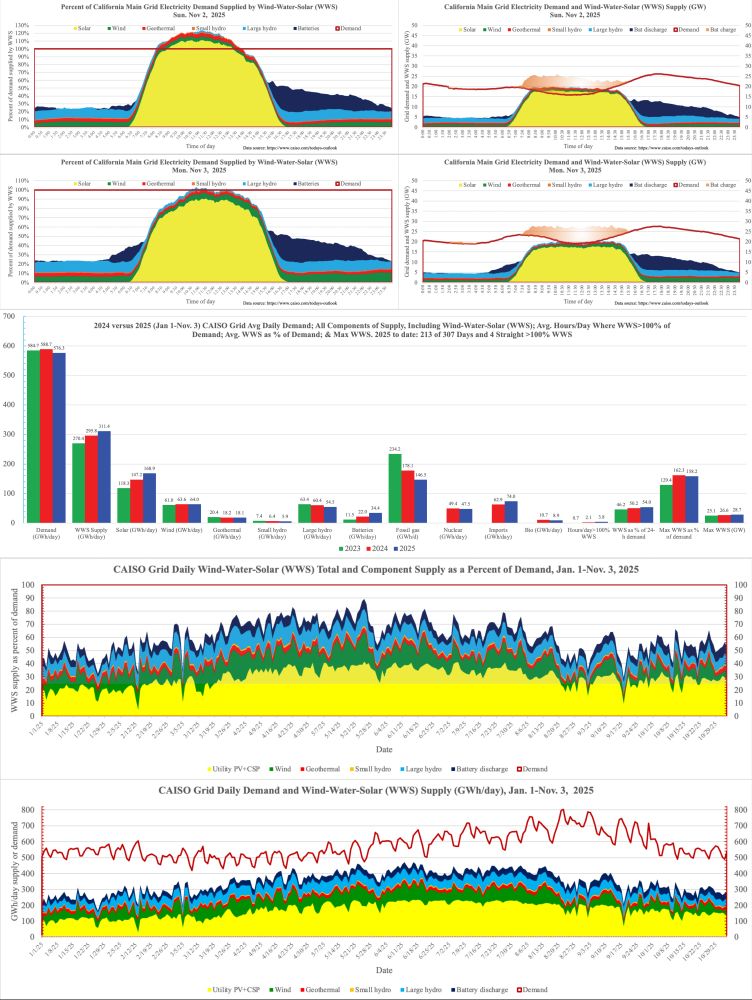
Two more 100% WindWaterSolar days for part of the day in CA, making it 213 100% days so far in 2025.
CA will be 100% WWS 24/7/365 by 2037.
PV and batteries are replacing gas rapidly.
Gas down 18% versus 2024 and 37.4% versus 2023.

Two more 100% WindWaterSolar days for part of the day in CA, making it 213 100% days so far in 2025.
CA will be 100% WWS 24/7/365 by 2037.
PV and batteries are replacing gas rapidly.
Gas down 18% versus 2024 and 37.4% versus 2023.
And look: Little wind Sat day but still 100% WWS
Gas down 18% v '24; 37% v '23
Demand down 2% v '24; 1.4% v '23
Solar up 15% v '24; 43% v '23
Batt up 56% v '24; 199% v '23

And look: Little wind Sat day but still 100% WWS
Gas down 18% v '24; 37% v '23
Demand down 2% v '24; 1.4% v '23
Solar up 15% v '24; 43% v '23
Batt up 56% v '24; 199% v '23
CA 54.24% in-state WWS for all of 2025, 3.87% higher than last year's 50.37%. At this rate, CA will be 100% WWS 24/7/365 by 2036.
Gas down 18.5% v '24 & 37.4% v '23

CA 54.24% in-state WWS for all of 2025, 3.87% higher than last year's 50.37%. At this rate, CA will be 100% WWS 24/7/365 by 2036.
Gas down 18.5% v '24 & 37.4% v '23
206 days in 2025 so far with WindWaterSolar exceeding 100% of demand on CA's main grid for part of the day, averaging 3.9 among all 298 days in 2025
And fossil gas is down 37.4% in 2 y

206 days in 2025 so far with WindWaterSolar exceeding 100% of demand on CA's main grid for part of the day, averaging 3.9 among all 298 days in 2025
And fossil gas is down 37.4% in 2 y
61.7% of all demand in '25 met by WWS: 54.3% in-state WWS & 7.4% imported WWS (58% of 12.68% imports)
Gas down 18.2% v '24 & 37.3% v '23
Solar up 14.4% v '24 & 43.1% v '23
Batteries up 56% v '24 & 201% v '23

61.7% of all demand in '25 met by WWS: 54.3% in-state WWS & 7.4% imported WWS (58% of 12.68% imports)
Gas down 18.2% v '24 & 37.3% v '23
Solar up 14.4% v '24 & 43.1% v '23
Batteries up 56% v '24 & 201% v '23
202 of 293 days (69%) in 2025 w/WWS meeting >100% of demand for part of day, including 6 days straight
Gas down 18.4% v '24 & 37.4% v '23
In-state WWS supplying 54.4% of all demand in 2025, plus 58% of 12.63% of imports, so really 61.7% of demand

202 of 293 days (69%) in 2025 w/WWS meeting >100% of demand for part of day, including 6 days straight
Gas down 18.4% v '24 & 37.4% v '23
In-state WWS supplying 54.4% of all demand in 2025, plus 58% of 12.63% of imports, so really 61.7% of demand
200 days of 100% WindWaterSolar on CA's main grid in 2025
Including a record battery output of 47.69 GWh on 10/17
Gas down 18.5% v '24 & 37.2% v '23
PV up 14.6% v '24 & 43.5% v '23
Batteries up 56.8% v '24 & 202.7% v '23
Demand down 2.1% v '24 & 1.3% v '23

200 days of 100% WindWaterSolar on CA's main grid in 2025
Including a record battery output of 47.69 GWh on 10/17
Gas down 18.5% v '24 & 37.2% v '23
PV up 14.6% v '24 & 43.5% v '23
Batteries up 56.8% v '24 & 202.7% v '23
Demand down 2.1% v '24 & 1.3% v '23
Oct 16: 198th day in 2025 w/WWS >100% of demand
WWS met 54.5% of demand in '25
Gas down 37% v '23 & 19% v '24
PV up 44% v '23 & 15% v '24
Batteries up 203% v '23 & 57% v '24
Demand down 1.2% v '23 & 2.1% v '24 despite more AI

Oct 16: 198th day in 2025 w/WWS >100% of demand
WWS met 54.5% of demand in '25
Gas down 37% v '23 & 19% v '24
PV up 44% v '23 & 15% v '24
Batteries up 203% v '23 & 57% v '24
Demand down 1.2% v '23 & 2.1% v '24 despite more AI
195th & 196th days in 2025 with >100% WindWaterSolar for part of day
WWS peaked at 135% of demand both days
Gas down 19% v '24 & 37% v '23
Batteries up 57% v '24 & 205% v '23
Solar up 15% v '24 & 44% v '23
WWS 54.6% of demand v 46.7% in '23

195th & 196th days in 2025 with >100% WindWaterSolar for part of day
WWS peaked at 135% of demand both days
Gas down 19% v '24 & 37% v '23
Batteries up 57% v '24 & 205% v '23
Solar up 15% v '24 & 44% v '23
WWS 54.6% of demand v 46.7% in '23
Gas down 18% v '24 & 37% v '23, replaced largely by solar & batteries
54.7% of all demand met by WWS
Demand down 1.7% v '24 & 1.1% v '23 due largely to growth of roof PV

Gas down 18% v '24 & 37% v '23, replaced largely by solar & batteries
54.7% of all demand met by WWS
Demand down 1.7% v '24 & 1.1% v '23 due largely to growth of roof PV
Now 191 days of 2025 with > 100% WWS for part of day.
Gas is down 18% v '24, 37% v '23
Solar up 15% v '24, 45% v '23
Demand down 1.7% v' 24, 1% v '23 despite more AI

Now 191 days of 2025 with > 100% WWS for part of day.
Gas is down 18% v '24, 37% v '23
Solar up 15% v '24, 45% v '23
Demand down 1.7% v' 24, 1% v '23 despite more AI
Fossil gas down 17.4% year to date in 2025 v '24 and down 37.4% v '23
Wind up 2.1% v '24 and 5.1% v '23
Solar up 15.1% v '24 and 44.8% v '23
Batteries up 58.4% v '24 and 206.4% v '23
Demand down 1.4% v '24 and 1% v '23

Fossil gas down 17.4% year to date in 2025 v '24 and down 37.4% v '23
Wind up 2.1% v '24 and 5.1% v '23
Solar up 15.1% v '24 and 44.8% v '23
Batteries up 58.4% v '24 and 206.4% v '23
Demand down 1.4% v '24 and 1% v '23

Gas down 37% v '23 & 17.3% v '24
Solar up 45% v '23 & 15.2% v '24
Batteries up 206% v '23 & 59% v '24
Demand down 1.1% v '23 & 1.4% v '24 despite more AI

Gas down 37% v '23 & 17.3% v '24
Solar up 45% v '23 & 15.2% v '24
Batteries up 206% v '23 & 59% v '24
Demand down 1.1% v '23 & 1.4% v '24 despite more AI
Grateful to be ranked #10 all time in Meteorology & Atmospheric Sciences (#2 first publishing after 1985); #19 all time in Energy (#9 first publishing after 1980); and #1,609 out of 10 million since 1788.
Incredible company
web.stanford.edu/group/efmh/j...

Grateful to be ranked #10 all time in Meteorology & Atmospheric Sciences (#2 first publishing after 1985); #19 all time in Energy (#9 first publishing after 1980); and #1,609 out of 10 million since 1788.
Incredible company
web.stanford.edu/group/efmh/j...


Gas down 20% v '24, 39% v '23
WWS up 6% v '24, 17% v '23
Batteries up 60% v '24, 211% v '23
Demand down 2.1% v '24, 1.8% v '23

Gas down 20% v '24, 39% v '23
WWS up 6% v '24, 17% v '23
Batteries up 60% v '24, 211% v '23
Demand down 2.1% v '24, 1.8% v '23
PV up 17% v '24 & 47% v '23
Batteries up 60% v '24 & 211% v '23
182 out of 255 days (71.3%) with >100% WindWaterSolar supply meeting California ISO demand.
CA will be 100% WWS by 2035

PV up 17% v '24 & 47% v '23
Batteries up 60% v '24 & 211% v '23
182 out of 255 days (71.3%) with >100% WindWaterSolar supply meeting California ISO demand.
CA will be 100% WWS by 2035

